The quenched mass portion of star-forming galaxies and the origin of the star formation sequence slope
Abstract
Observationally, a massive disk galaxy can harbor a bulge component that is comparably inactive as a quiescent galaxy (QG). It has been speculated that the quenched component contained in star-forming galaxies (SFGs) is the reason why the star formation main sequence (MS) has a shallow slope at high masses. In this paper, we present a toy model to quantify the quenched mass portion of SFGs () at fixed stellar mass () and to reconcile the MS slopes both in the low and the high mass regimes. In this model, each SFG is composed by a star-forming plus a quenched component. The mass of the star-forming component () correlates with the star formation rate (SFR) following a relation SFR , where . The quenched component contributes to the stellar mass but does not to the SFR. It is thus possible to quantify based on the departure of the observed MS slope from . Adopting the redshift-dependent MS slope reported by Whitaker et al. (2014), we explore the evolution of the relations over . We find that Milky-Way-like SFGs (with ) typically have a at , whereas this value rapidly rises up to at . The origin of an MS slope seen in the low mass regime is also discussed. We argue for a scenario in which the majority of low mass SFGs stay in a “steady-stage” star formation phase. In this phase, the SFR is mainly regulated by stellar feedback and not significantly influenced by the quenching mechanisms, thus keeping roughly constant over cosmic time. This scenario successfully produces an MS slope, as well as the observed MS evolution from to at low masses.
1 Introduction
Large galaxy surveys have established that star-forming galaxies (SFGs) follow a relatively tight star formation rate (SFR)stellar mass () relation from local universe to at least redshift (e.g., Brinchmann et al., 2004; Noeske et al., 2007; Elbaz et al., 2007; Karim et al., 2011; Guo et al., 2013; Speagle et al., 2014; Tasca et al., 2015), with a dispersion of dex in the logarithmic scale (Guo et al., 2013; Speagle et al., 2014; Whitaker et al., 2014; Kurczynski et al., 2016). In a decade since its discovery, this star formation “main sequence” (MS) is parameterized in a single power-law of SFR , in which and are called the normalization parameter and the slope of the MS, respectively. Since the SFR relation describes the stellar mass growth rate in galaxies at a given cosmic epoch, it has now been used as an important tool in studying galaxy assembly (e.g., Leitner, 2012; Patel et al., 2013) and testing galaxy formation models (e.g., Somerville & Davé, 2015).
In the past decade, much observational efforts have been focused on studying the SFR relation at different cosmic epoches (see Speagle et al. (2014) for a compilation of these works). The utilization of deep infrared photometry in SFR estimates enables a more robust characterization of this relation down to very low masses in the recent years. Using a mass-complete galaxy sample, Whitaker et al. (2014) constrained the MS down to () at (). For the first time, Whitaker et al. (2014) reported that the MS is not consistent with a single power-law at . Instead, it is better fitted in a broken power-law form, such that below a “knee” mass () of , the MS has a redshift-independent slope of . Above , the MS slope ranges from 0.2 to 0.7, depending on redshift. Subsequent works report a similar trend in the redshift range probed in Whitaker et al. (2014), but suggest that may increase with redshift (Lee et al., 2015; Schreiber et al., 2015; Tomczak et al., 2016). At higher redshifts (), observations suggest that the MS also has a slope of at high masses (Tasca et al., 2015; Schreiber et al., 2015).
The shallow MS slope seen at since has been argued to be a consequence of the inclusion of quenched mass in massive galaxies (Whitaker et al., 2014; Lee et al., 2015; Schreiber et al., 2015; Erfanianfar et al., 2016). This idea can be easily interpreted since the quenched component of a SFG contributes to but does not to the SFR, thus naturally resulting in a flattening in the SFR relation. The observations support this scenario. In the nearby Universe, it has been well established that the low mass SFGs () are generally disk-dominated and composed by young stellar populations Kauffmann et al. (2003), whereas the more massive ones usually harbor a prominent bulge component containing relatively old stellar populations (Abramson et al., 2014; González Delgado et al., 2015). More specifically, the specific star formation rate (sSFR) in the bulges of massive disk galaxies can be an order of magnitude lower than that in the disks, i.e., the bulges are indeed quenched (González Delgado et al., 2016). A similar picture appears to hold at higher redshifts. Nelson et al. (2016) studied the stacked H map of SFGs at and found that there is a strong central dip in the equivalent width of H for massive SFGs, indicating the existence of a relatively old bulge component. Even at the cosmic star formation peak, there is evidence that the most massive SFGs () have already harbored a quenched bulge component at , resembling their counterparts at lower redshifts (Tacchella et al., 2015). Since the fraction of bulgy SFGs rapidly increases above (Erfanianfar et al., 2016; Pan et al., 2016), the quenched mass could be a potentially important contributor to the mass budget of SFGs.
The quenched mass portion contained in a SFG (hereafter referred as ) directly characterizes the “maturity degree” of that galaxy, however is not well explored in previous studies. Obviously, can not be well constrained for individual galaxies without spatially-resolved information. However, one can possibly quantify the average for the whole SFG population with very general information, as described below. In this paper, we develop a toy model to quantify the average at fixed by utilizing the bending effect of the quenched mass on the observed SFR relation. The observations that less massive galaxies with consistently follow a redshift-independent MS slope, lead us to the basic assumption of this model, that SFGs with a consistently follow a MS slope , where . We justify this assumption and find that it is supported by the observations, as see below. Under this assumption, can be constrained by comparing the observed MS slope with . Throughout this paper, we adopt a concordance CDM cosmology with , , . Mpc-1 and a Chabrier (2003) initial mass function (IMF).
2 The model
Whitaker et al. (2014) for the first time claimed that there is a clear curvature in the MS at . Therefore, the observed MS is better fitted with a broken power-law form
| (1) |
where and and are the slopes below and above , respectively. A diagrammatic sketch of the observed log(SFR)log plane is shown in the left panel of Figure 1.
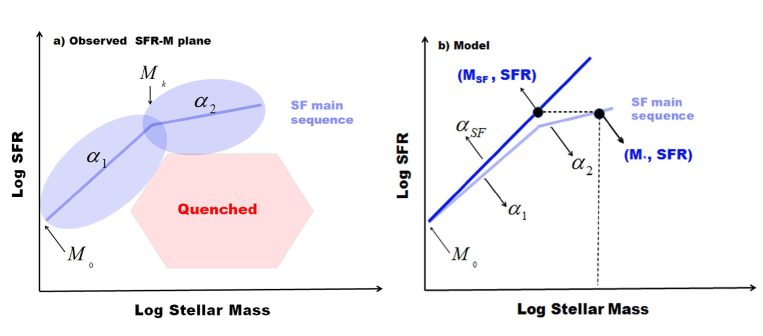
To reconcile the observed and , we present a toy model in which a SFG is composed by a star-forming plus a quenched component, each following a SFR relation
| (2) |
where and are the stellar masses of the star-forming and quenched component, respectively. Regardless the exact form of the SFR relation, the quenched component is expected to be only weakly correlated with the recent SFR. In observations, the -selected quiescent galaxies (QGs) (e.g., Williams et al., 2009) have average SFRs that are 20-40 times lower than SFGs, i.e., . It is thus safely assuming that the observed SFR is primarily correlated with the star-forming component. Assuming the star-forming component accounts for a mass fraction of , then
| (3) |
where is the total stellar mass of the galaxy. Given the total SFR is primarily correlated with the star-forming component, then
| (4) |

Since the less massive SFGs are disk dominated and expected to contain little amount of quenched mass, then should be similar to , i.e., , as indicated in the right panel of Figure 1. To eliminate the normalization parameters, one must take the boundary conditions into consideration. We assume that below a threshold mass of , SFGs are solely composed by the star-forming component (see the right panel of Figure 1 ). Then at
| (5) |
Similarly, at
| (6) |
Combining (1), (4), (5) and (6), then
| (7) |
The quenched mass portion is then easily derived as =1.
Note that , and can be determined from the MS, while and are free parameters. As mentioned above, the observations suggest that . In contrast, is not that well constrained. As defined, is a threshold mass below which the influence of quenching on galaxies could be ignored. In the local universe, Taylor et al. (2015) found that the red population dissolves into obscurity when . A similar conclusion is also reached by Geha et al. (2012), who demonstrated that quenched galaxies with do not exist in the field. Based on these studies, we suggest that should be smaller than .
To further explore the dependence of upon and , we show the relation as a function of and in Figure 2. As can be seen, the relation is not very sensitive to both and in the mass regime of . This supports that the estimation is robust at high masses as long as the main sequence parameters are well determined. However, is strongly dependent on the choice of the free parameters at , implying that this method may be no longer valid in the low mass regime. We further discuss this in the caveat section.
It should be noted that there are non-ignorable uncertainties in the SFR and estimates, which may affect the measured MS parameters. Fortunately, these uncertainties only contribute to the dispersion of the MS relation and do not affect its slope (Kurczynski et al., 2016). Therefore, the estimated is robust against these measurement uncertainties. To conclude, this section presents a very simple model to quantify the relation of SFGs, which enables one to directly assess how “mature” the galaxies are at a given . The derived should be treated as an average value since we have neglected the dispersion in the SFR relation. Since is directly driven by the quenching processes, the evolution of the relation could be useful in constraining some key parameters of quenching, such as the average quenching rate and quenching time scale (Lian et al., 2016) in the future studies.
3 A possible origin of the slope
Although the latest observational studies report a MS slope of 1.0 at (e.g., Whitaker et al., 2014; Schreiber et al., 2015; Tomczak et al., 2016), the authors do not provide a plausible explanation to its origin. In this paper we argue that is totally expected since the low mass SFGs haven’t underwent star formation suppression, as we will discuss bellow.
In principle, a SFG can grow its stellar mass via star formation or mergers. Specifically, the relative importance of these two channels depends on stellar mass and redshift. Both observations (e.g., van Dokkum et al., 2010; Ownsworth et al., 2014; Vulcani et al., 2016) and simulations (e.g., De Lucia & Blaizot, 2007; Guo & White, 2008; Rodriguez-Gomez et al., 2016; Qu et al., 2016) suggested that mergers significantly contribute to the mass growth of massive galaxies ( ), especially at . In contrast, the mass growth of low mass galaxies is dominated by in-situ star formation and the role of mergers is minor (Leja et al., 2015; Qu et al., 2016). As the analysis below is mainly focused on galaxies with , we will only consider the role of star formation in stellar mass growth and assume that mergers do not affect our final conclusion. Given this assumption, the stellar mass growth in a SFG between and is
| (8) |
where is the return fraction due to mass loss. The return fraction is a function of time. However, as almost mass loss is within the first years, we fix to 0.36 (for a Chabrier (2003) IMF) in the following discussion.
The existence of a tight MS relation from at least to suggests that the behavior of star-forming activity is predominately regular and smooth, rather than dominated by stochastic events like starbursts (.e.g., Noeske et al., 2007; Speagle et al., 2014). Specifically, the SFR can maintain at least over yr, as supported by the good consistency between the dust-corrected UV and H-based SFR, both in the local (Hao et al., 2011; Kennicutt & Evans, 2012) and the high redshift universe (Shivaei et al., 2016). In the case that the SFR keeps constant over the time interval probed, then equation (8) can be written as .
Without quenching processes, then a SFG may maintain its SFR over a very long period after the SFR reaches a relatively stable value . Assuming the SFR reaches at and keeps constant (or roughly constant) at , then at any cosmic time (where ) its stellar mass is
| (9) |
where is the stellar mass formed prior to . In the case of , then . For the whole SFG population, it should be reasonable assuming that the majority reaches a stable SFR at a similar . This assumption is supported by the simulation of Hopkins et al. (2014), who showed that galaxies reach their stable SFR at . Therefore, the global SFR relation can be expressed as log(SFR)=log(log in the logarithmic space, which naturally results in an MS slope as observed.
However, this scenario should be over simple since it is not realistic for individual galaxies to strictly follow a constant SFR over a Hubble time. For SFGs, there are considerable variations in the star formation histories even at a fixed , which are then manifested in the dispersion of the observed SFR relation (Cassarà et al., 2016). Therefore, we emphasize that the “constant SFR” assumption should be interpreted in a “population-average” sense and does not necessarily hold for individual galaxies.
4 The evolution of the main sequence at low masses
In the above section we proposed a scenario in which SFGs keep their SFRs roughly constant over cosmic time. As a consequence, the stellar mass of a galaxy linearly correlates with cosmic time , i.e., , which then naturally results in an slope in the log(SFR)log() relation. This scenario predicts that the position of a SFG on the log(SFR)log() plane simply shifts towards higher masses as increasing , while keeping its SFR unchanged. As such, given a log(SFR)log() relation at a starting cosmic time , one can predict the MS at any . To verify this scenario, in this section we compare the model predicted MS relations with observations. We emphasize that this comparison is only meaningful for low mass galaxies with since we assume that they are not significantly influenced by the quenching processes. The observed quenched fraction at is quite low (¡10%) even in the local Universe (Geha et al., 2012; Taylor et al., 2015), supporting this assumption.
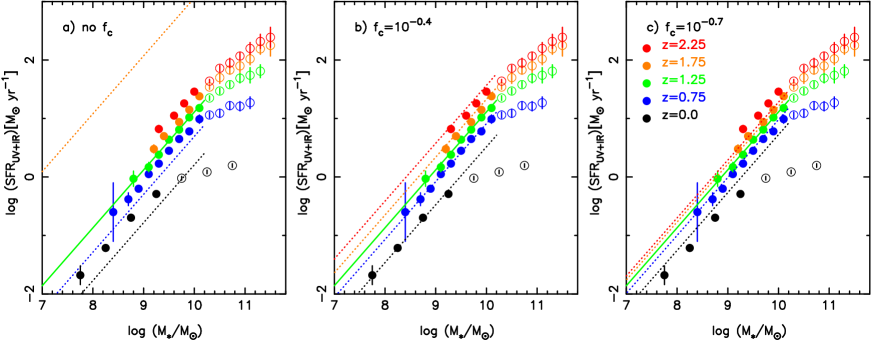
The observed MS data at are drawn from Whitaker et al. (2014). We also complement the MS data at from Gavazzi et al. (2015). The SFRs of Whitaker et al. (2014) are estimated from the ultraviolet and 24 m infrared photometry, while those of Gavazzi et al. (2015) are from the observed H fluxes. Both works have assumed a Chabrier (2003) IMF in the SFR and estimates. We choose a starting point of to predict the MS relations at or at under the scenario proposed above. A is chosen since at this redshift the observation reported MS slope () is most close to our expectation. In fact changing will not affect any of our conclusion. At , Whitaker et al. (2014) fit the MS with
| (10) |
as shown in the green solid line in Figure 3. Using the stellar growth given by equation (8), we predict the MS relations at four redshifts and show the results in the doted lines in panel a). As can be seen, the predicted MS relations clearly do not match the observations. This may indicate that the proposed scenario is incorrect. However, we speculate that this disagreement may arise from the inconsistency between the cosmic SFR density and the stellar mass density growth rate (), as reported in some previous works (Hopkins & Beacom, 2006; Wilkins et al., 2008; Yu & Wang, 2016). These works found that the inferred from the observed stellar mass functions is lower than the observed SFR density up to a factor of 0.2-0.6 dex. Taking this effect into consideration, we correct for the stellar mass growth due to the observed SFR by
| (11) |
where is a correcting factor between 0.0 and 1.0.
We have tried a wide range of to seek for a correcting factor that can result in a best matching between model predictions and observations. The explored ranges from 0.0 to 1.0 dex, with a step of dex. For each , the degree of the matching between model predictions and observations is then characterized by
| (12) |
where and are the predicted and observed star formation rate, respectively. is the total number of data points that are considered for the comparison. Since we focus on galaxies with , thus only the data points with are used for the comparison at . At , data points with are used since the MS has turned over above this mass, as seen in Figure 3. The data points that are used for comparison are denoted in solid symbols in Figure 3. We find that a correcting factor yields the best matching (a minimal =0.005) between model predictions and observations, as shown in panel b). This best-fit value is well consistent with that reported in the previous studies. In panel c), it is clear that a correcting factor obviously underestimate the evolution of the MS.
It is still unclear why there is a systematic offset between the cosmic SFR density and . This may arise from the problems in stellar mass estimates, star formation rate estimates, or both (see Madau & Dickinson (2014) and Leja et al. (2015) for a more detailed discussion). Nevertheless, the good consistency between the model predicted and observed MS relations over a wide redshift range still strongly support this scenario.
5 The evolution of and quenched mass density over z=[0.5,2.5]
In this section we adopt the MS parameters given by Whitaker et al. (2014) to explore the evolution of over . Whitaker et al. (2014) fit a broken power law form for the MS relation with a fixed turn over mass of . The slope is close to unity at , for which Whitaker et al. (2014) give
| (13) |
where is redshift. Above , the slope is strongly redshift-dependent, with a form of
| (14) |
To simplify, we adopt and in this section. The derived relations are shown in Figure 4. As can be seen, the of a Milky-Way-like SFG (with ) is around at , whereas it rapidly rises up to at . This indicates that the massive SFGs have been dominated by quenched mass since very high redshifts.

An important feature of Figure 4 is that even at , the most massive SFGs have already contained a considerably high fraction of quenched mass. For example, the can be greater than 50% for SFGs with . This is broadly consistent with the findings of Tacchella et al. (2015). Tacchella et al. (2015) reach their conclusions based on a small sample of 22 SFGs (only 5 with ), which may be seriously biased to selection effects. Since the estimation depends on the parameters of the MS, Figure 4 thus confirms their finding in a more statistical sense.
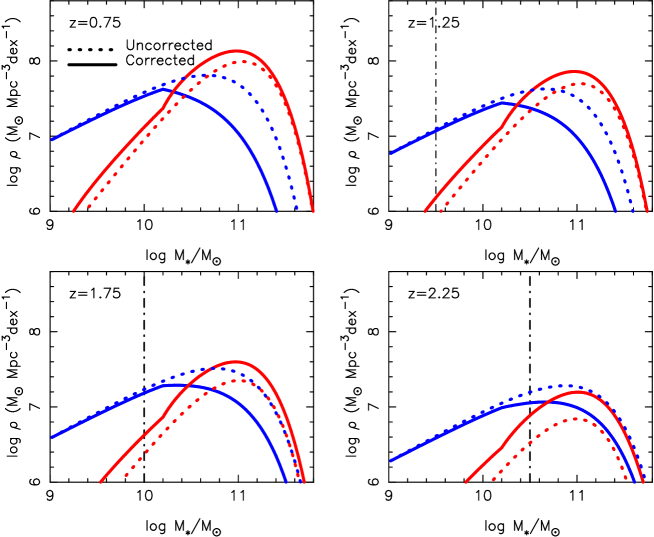
Using the stellar mass functions, early works have estimated star-forming and quenched stellar mass density in the universe (Ilbert et al., 2013; Muzzin et al., 2013; Tomczak et al., 2014). These works do not consider the hidden quenched mass in SFGs, thus will certainly underestimate the true quenched mass density. We revisit this issue by taking into consideration. The corrected mass density for the star-forming and quenched component should be
| (15) | |||
| (16) |
where and are the stellar mass density of QGs and SFGs derived from their stellar mass functions, respectively. In this paper we adopt the stellar mass functions reported by Muzzin et al. (2013), who also use the technology to define SFGs and QGs. The results are shown in Figure 5. As can be seen, without correcting for , the quenched mass density takes over at , which is already reported in early works. Once is taken into consideration, the quenched mass is already taking over at for galaxies more massive than . The results of Figure 5 are broadly consistent with the recent findings of Renzini (2016).
Figure 5 reveals that the quenched mass density doubles (increase dex) after correcting for at , i.e., the SFGs contribute equally or even more than QGs do to the total quenched mass budget. Although remains to be confirmed, this could be the case in the early cosmic epoch when quenching just started at work. As the quenching processes proceed in an inside-out manner in massive SFGs (e.g., Pan et al., 2014; Li et al., 2015; Tacchella et al., 2015; Pan et al., 2015, 2016; Belfiore et al., 2016), quenched mass have already emerged in the bulge of a SFG prior to the fully quenching of that galaxy. Therefore, it makes sense that the quenched mass primarily exists in the bulges of massive SFGs when quenching is still at its preliminary stage.
6 Discussion
We have developed a toy model to interpret the slope of the log(SFR)log() relation of star-forming galaxies. Our model splits a SFG into a quenched plus a star-forming component, which is initially inspired by the observations that bulges are generally quenched while disks are still forming stars (Abramson et al., 2014). However, we emphasize that the quenched mass mentioned in this paper is not strictly equal to the bulge mass for two reasons. First, star-forming bulges do also exist, especially at high redshifts (Barro et al., 2013; Whitaker et al., 2015). Second, a considerable fraction of the old stars can migrate from the bulge to the outer disk due to resonant scattering with transient spiral arms (Sellwood & Binney, 2002; Roškar et al., 2008; Loebman et al., 2016; El-Badry et al., 2016), making these two components indistinguishable even with the help of a disk-bulge decomposition.
In Section 3 we argue that the MS will naturally have an slope once SFGs enter a steady-stage star formation phase. Section 4 further verifies the capability of this scenario in explaining the observed evolution of the MS over at . In fact the notion that low mass galaxies generally have an extended star formation history is not new. Previous works on galaxy stellar populations have indicated that while the massive galaxies form the majority of their stellar mass at , the less massive ones grow their mass with a similar speed over a Hubble time (.e.g., Thomas et al., 2005; McDermid et al., 2015). A similar conclusion is also reached by studies with independent approaches. For example, Behroozi et al. (2013) and Moster et al. (2013) study the average star formation history of galaxies in dark matter haloes from high redshifts to the present day using an abundance matching method. They both find that the low mass haloes () have a steady SFR since .
This steady-stage star formation phase is likely a consequence of stellar feedback. Stellar feedback has long been served as an important mechanism that shaping various properties of galaxies in the low mass regime, including the stellar surface density (Kauffmann et al., 2003), the metallicity (Tremonti et al., 2004) and the morphologies (Brook et al., 2011). The star-of-the-art numerical simulations have successfully produced a low star formation efficiency in low mass haloes as seen in observations by taking explicit stellar feedback physics into consideration (.e.g., Hopkins et al., 2014; Ceverino et al., 2014). In the FIRE simulation, a galaxy will reach a steady SFR phase at , at which the stellar feedback appears to dominate gas dynamics (Hopkins et al., 2014). Without additional quenching mechanisms (such as active galactic nucleus (AGN) feedback or halo shock heating) involved, the simulations indicate that the galaxy will maintain its SFR for a long period (see Figure 10 of Hopkins et al. (2014)).
We also note that a correcting factor is useful in interpreting some recent findings. Tomczak et al. (2016) used the MS relation to predict the evolution of stellar mass function from to . They found that the galaxy number density is systematically over predicted by 0.2 dex at (see their Figure 10). Since the stellar mass function has a faint end slope of , this effect can be equivalently interpreted as a 0.4 dex overestimation in , as Tomczak et al. (2016) did not include a factor in their calculations.
In Section 5 we show that is already considerably high for massive SFGs at the peak of cosmic star formation (). As the quenched mass is primarily associated with bulges, this indicates that the bulge buildup process is highly efficient at high redshifts. At , galaxies are gas rich and typically have a gas fraction around 0.4-0.5 (Tacconi et al., 2010, 2013). With such a high cold gas fraction, a large amount of the gas will sink into the centers of galaxies due to violent disc instability, triggering central starbursts and forming a prominent bulge (Dekel & Burkert, 2014). This merger-free bulge forming scenario is supported by the recent work of Tadaki et al. (2016), who use ALMA and KMOS observations on 25 main sequence galaxies to reveal that the rotation-supported SFGs at have very intense central star formation rate. They conclude that these galaxies are able to form a compact bulge with a central 1kpc stellar mass density in a few years.
The link between the emergence of a quenched bulge and the fully quenching of a massive galaxy is still missing. Bulges are generally quenched, indicating that quenching may first operate from the inner galaxy regions. This is likely associated with a central starburst episode (Tacchella et al., 2015, 2016; Tadaki et al., 2016), which is possibly accompanied by strong gas outflow driven by AGNs (Genzel et al., 2014). However, an external process such as the shut-down of cold gas accretion may also needed to explain the subsequent suppression of star formation in the outer part of the galaxy (Dekel& Birnboim, 2006). The detailed quenching mechanism is key to galaxy evolution (e.g., Peng et al., 2010), however, is beyond the scope of this paper.
7 Caveat
Several issues to the analysis presented above warrant some considerations.First, the analysis presented in section 3 and section 4 suggests that is indeed the case at . However, whether holds at is not well justified. Note that in section 3 we have ignored mergers. At high masses, the role of mergers in mass growth can not be easily ignored. In merger remnants, it is not clear whether the star-forming component still follow a same SFR relation as their progenitors. However, if the properties of the star-forming component are not significantly changed during the merging process, the scaling relation between SFR and should remain for the merger remnants.
Second, the derived in this model should be treated as an upper limit of the true value since we have assumed that the quenched mass is fully responsible for the flattening of the MS. This is not well justified and there may also exist other mechanisms that can lead to the flattening. For example, Schreiber et al. (2016) claimed that the massive SFGs at have a decreased star formation efficiency that can up to a factor of 3 compared to the less massive ones, thus responsible for the flattening of the MS. However, the findings of Schreiber et al. (2016) is not seen in the local Universe. Recently, Saintonge et al. (2016) explored the mean atomic and molecular gas mass fraction along the MS at with the data from the ALFALFA, GASS and COLD GASS surveys. In contrary to Schreiber et al. (2016), Saintonge et al. (2016) found that both star formation efficiency and molecular-to-atomic gas ratio vary little for massive SFGs, indicating the flattening of the local MS is due to the global decrease of the cold gas reservoir rather than a depression in star formation efficiency.
Third, the model may be less physical for less massive SFGs. This is because less massive galaxies are disk dominated and do not harbor a notable quenched component. In addition, the model predicted is strongly dependent on and at low masses (see Figure 2), both of which are free parameters that can not be firmly constrained. Although the model predicts a very low in the low mass regime that still seems reasonable, we suggest that this value is not meaningful.
8 Summary
In this paper, we develop a toy model to quantify the quenched mass portion () of SFGs and to reconcile the star formation sequence slopes both in the low and the high mass regimes. Our results are summarized as follows.
1. In this toy model, each SFG is composed by a star-forming plus a quenched component. The mass of the star-forming component () correlates with the SFR following a relation SFR , where . The quenched component contributes to the total stellar mass while doesn’t to the SFR, thus driving the observed MS slope depart from . The difference between and thus can be used to infer , as given in equation (7).
2. We propose a scenario to interpret the origin of the main sequence slope seen at . In this scenario, the majority of low mass SFGs are less influenced by the quenching processes, thus keeping a steady SFR over cosmic time. As such, the stellar mass of a galaxy linearly correlates with cosmic time , i.e., , which then naturally results in an slope in the log(SFR)log() relation. The observed MS relations in the low mass regime agree well with the model predictions at , which supports this scenario. We suggest that the steady-stage star formation phase is driven by stellar feedback.
3. Adopting the redshift-dependent main sequence slope reported by Whitaker et al. (2014), we explore the evolution of the relation over . We find that Milky-Way-like SFGs typically have a at , whereas this value rapidly rises up to at . Taking into consideration, we retrieve the stellar mass density budget of the universe, finding the quenched mass has been taking over in galaxies with since .
References
- Abramson et al. (2014) Abramson, L. E., Kelson, D. D., Dressler, A., et al. 2014, ApJ, 785, L36
- Barro et al. (2013) Barro, G., Faber, S. M., Pérez-González, P. G., et al. 2013, ApJ, 765, 104
- Behroozi et al. (2013) Behroozi, P. S., Wechsler, R. H., & Conroy, C. 2013, ApJ, 770, 57
- Belfiore et al. (2016) Belfiore, F., Maiolino, R., Maraston, C., et al. 2016, arXiv:1609.01737
- Brinchmann et al. (2004) Brinchmann, J., Charlot, S., White, S. D. M., et al. 2004, MNRAS, 351, 1151
- Brook et al. (2011) Brook, C. B., Governato, F., Roškar, R., et al. 2011, MNRAS, 415, 1051
- Cassarà et al. (2016) Cassarà, L. P., Maccagni, D., Garilli, B., et al. 2016, A&A, 593, A9
- Ceverino et al. (2014) Ceverino, D., Klypin, A., Klimek, E. S., et al. 2014, MNRAS, 442, 1545
- Chabrier (2003) Chabrier, G. 2003, PASP, 115, 763
- Cid Fernandes et al. (2005) Cid Fernandes, R., Mateus, A., Sodré, L., Stasińska, G., & Gomes, J. M. 2005, MNRAS, 358, 363
- Conselice (2014) Conselice, C. J. 2014, ARA&A, 52, 29
- Dekel& Birnboim (2006) Dekel, A., & Birnboim, Y. 2006, MNRAS, 368, 2
- Dekel & Burkert (2014) Dekel, A., & Burkert, A. 2014, MNRAS, 438, 1870
- De Lucia & Blaizot (2007) De Lucia, G., & Blaizot, J. 2007, MNRAS, 375, 2
- Erfanianfar et al. (2016) Erfanianfar, G., Popesso, P., Finoguenov, A., et al. 2016, MNRAS, 455, 2839
- Elbaz et al. (2007) Elbaz, D., Daddi, E., Le Borgne, D., et al. 2007, A&A, 468, 33
- El-Badry et al. (2016) El-Badry, K., Wetzel, A., Geha, M., et al. 2016, ApJ, 820, 131
- Gavazzi et al. (2015) Gavazzi, G., Consolandi, G., Dotti, M., et al. 2015, A&A, 580, A116
- Geha et al. (2012) Geha, M., Blanton, M. R., Yan, R., & Tinker, J. L. 2012, ApJ, 757, 85
- Genzel et al. (2014) Genzel, R., Förster Schreiber, N. M., Rosario, D., et al. 2014, ApJ, 796, 7
- Guo & White (2008) Guo, Q., & White, S. D. M. 2008, MNRAS, 384, 2
- Guo et al. (2013) Guo, K., Zheng, X. Z., & Fu, H. 2013, ApJ, 778, 23
- González Delgado et al. (2015) González Delgado, R. M., García-Benito, R., Pérez, E., et al. 2015, A&A, 581, A103
- González Delgado et al. (2016) González Delgado, R. M., Cid Fernandes, R., Pérez, E., et al. 2016, A&A, 590, A44
- Hao et al. (2011) Hao, C.-N., Kennicutt, R. C., Johnson, B. D., et al. 2011, ApJ, 741, 124
- Haywood et al. (2016) Haywood, M., Lehnert, M. D., Di Matteo, P., et al. 2016, A&A, 589, A66
- Hopkins et al. (2014) Hopkins, P. F., Kereš, D., Oñorbe, J., et al. 2014, MNRAS, 445, 581
- Hopkins & Beacom (2006) Hopkins, A. M., & Beacom, J. F. 2006, ApJ, 651, 142
- Ilbert et al. (2013) Ilbert, O., McCracken, H. J., Le Fèvre, O., et al. 2013, A&A, 556, A55
- Kauffmann et al. (2003) Kauffmann G., White S. D. M., Heckman T. M. et al., 2003, MNRAS, 341, 54
- Karim et al. (2011) Karim, A., Schinnerer, E., Martínez-Sansigre, A., et al. 2011, ApJ, 730, 61
- Kennicutt (1998) Kennicutt, R. C., Jr. 1998, ARA&A, 36, 189
- Kennicutt & Evans (2012) Kennicutt, R. C., & Evans, N. J. 2012, ARA&A, 50, 531
- Kurczynski et al. (2016) Kurczynski, P., Gawiser, E., Acquaviva, V., et al. 2016, ApJ, 820, L1
- Lee et al. (2015) Lee, N., Sanders, D. B., Casey, C. M., et al. 2015, ApJ, 801, 80
- Leitner (2012) Leitner, S. N. 2012, ApJ, 745, 149
- Leja et al. (2015) Leja, J., van Dokkum, P. G., Franx, M., & Whitaker, K. E. 2015, ApJ, 798, 115
- Li et al. (2015) Li, C., Wang, E., Lin, L., et al. 2015, ApJ, 804, 125
- Lian et al. (2016) Lian, J., Yan, R., Zhang, K., & Kong, X. 2016, arXiv:1609.04805
- Loebman et al. (2016) Loebman, S. R., Debattista, V. P., Nidever, D. L., et al. 2016, ApJ, 818, L6
- Madau & Dickinson (2014) Madau, P., & Dickinson, M. 2014, ARA&A, 52, 415
- McDermid et al. (2015) McDermid, R. M., Alatalo, K., Blitz, L., et al. 2015, MNRAS, 448, 3484
- Moster et al. (2013) Moster, B. P., Naab, T., & White, S. D. M. 2013, MNRAS, 428, 3121
- Muzzin et al. (2013) Muzzin, A., Marchesini, D., Stefanon, M., et al. 2013, ApJ, 777, 18
- Nelson et al. (2016) Nelson, E. J., van Dokkum, P. G., Förster Schreiber, N. M., et al. 2016, ApJ, 828, 27
- Noeske et al. (2007) Noeske, K. G., Weiner, B. J., Faber, S. M., et al. 2007, ApJ, 660, L43
- Ownsworth et al. (2014) Ownsworth, J. R., Conselice, C. J., Mortlock, A., et al. 2014, MNRAS, 445, 2198
- Pan et al. (2014) Pan, Z., Li, J., Lin, W., Wang, J., & Kong, X. 2014, ApJ, 792, L4
- Pan et al. (2015) Pan, Z., Li, J., Lin, W., et al. 2015, ApJ, 804, L42
- Pan et al. (2016) Pan, Z., Zheng, X., Lin, W., et al. 2016, ApJ, 819, 91
- Panter et al. (2007) Panter, B., Jimenez, R., Heavens, A. F., & Charlot, S. 2007, MNRAS, 378, 1550
- Patel et al. (2013) Patel, S. G., Fumagalli, M., Franx, M., et al. 2013, ApJ, 778, 115
- Peng et al. (2010) Peng, Y.-j., Lilly, S. J., Kovač, K., et al. 2010, ApJ, 721, 193
- Pérez et al. (2013) Pérez, E., Cid Fernandes, R., González Delgado, R. M., et al. 2013, ApJ, 764, L1
- Renzini (2016) Renzini, A. 2016, MNRAS, 460, L45
- Rodriguez-Gomez et al. (2016) Rodriguez-Gomez, V., Pillepich, A., Sales, L. V., et al. 2016, MNRAS, 458, 2371
- Sánchez et al. (2012) Sánchez, S. F., Kennicutt, R. C., Gil de Paz, A., et al. 2012, A&A, 538, 8
- Saintonge et al. (2016) Saintonge, A., Catinella, B., Cortese, L., et al. 2016, MNRAS, 462, 1749
- Schreiber et al. (2015) Schreiber, C., Pannella, M., Elbaz, D., et al. 2015, A&A, 575, A74
- Schreiber et al. (2016) Schreiber, C., Elbaz, D., Pannella, M., et al. 2016, A&A, 589, A35
- Sellwood & Binney (2002) Sellwood, J. A., & Binney, J. J. 2002, MNRAS, 336, 785
- Shivaei et al. (2016) Shivaei, I., Kriek, M., Reddy, N. A., et al. 2016, ApJ, 820, L23
- Somerville & Davé (2015) Somerville, R. S., & Davé, R. 2015, ARA&A, 53, 51
- Speagle et al. (2014) Speagle, J. S., Steinhardt, C. L., Capak, P. L., & Silverman, J. D. 2014, ApJS, 214, 15
- Tacchella et al. (2015) Tacchella, S., Carollo, C. M., Renzini, A., et al. 2015, Science, 348, 314
- Tacchella et al. (2016) Tacchella, S., Dekel, A., Carollo, C. M., et al. 2016, MNRAS, 457, 2790
- Tacconi et al. (2010) Tacconi, L. J., Genzel, R., Neri, R., et al. 2010, Nature, 463, 781
- Tacconi et al. (2013) Tacconi, L. J., Neri, R., Genzel, R., et al. 2013, ApJ, 768, 74
- Tadaki et al. (2016) Tadaki, K.-i., Genzel, R., Kodama, T., et al. 2016, arXiv:1608.05412
- Tasca et al. (2015) Tasca, L. A. M., Le Fèvre, O., Hathi, N. P., et al. 2015, A&A, 581, A54
- Taylor et al. (2015) Taylor, E. N., Hopkins, A. M., Baldry, I. K., et al. 2015, MNRAS, 446, 2144
- Thomas et al. (2005) Thomas, D., Maraston, C., Bender, R., & Mendes de Oliveira, C. 2005, ApJ, 621, 673
- Tomczak et al. (2014) Tomczak, A. R., Quadri, R. F., Tran, K.-V. H., et al. 2014, ApJ, 783, 85
- Tomczak et al. (2016) Tomczak, A. R., Quadri, R. F., Tran, K.-V. H., et al. 2016, ApJ, 817, 118
- Tremonti et al. (2004) Tremonti, C. A., Heckman, T. M., Kauffmann, G., et al. 2004, ApJ, 613, 898
- van der Wel et al. (2014) van der Wel, A., Franx, M., van Dokkum, P. G., et al. 2014, ApJ, 788, 28
- van Dokkum et al. (2010) van Dokkum, P. G., Whitaker, K. E., Brammer, G., et al. 2010, ApJ, 709, 1018
- Vulcani et al. (2016) Vulcani, B., Marchesini, D., De Lucia, G., et al. 2016, ApJ, 816, 86
- Whitaker et al. (2014) Whitaker, K. E., Franx, M., Leja, J., et al. 2014, ApJ, 795, 104
- Whitaker et al. (2015) Whitaker, K. E., Franx, M., Bezanson, R., et al. 2015, ApJ, 811, L12
- Williams et al. (2009) Williams, R. J., Quadri, R. F., Franx, M., van Dokkum, P., & Labbé, I. 2009, ApJ, 691, 1879
- Wilkins et al. (2008) Wilkins, S. M., Trentham, N., & Hopkins, A. M. 2008, MNRAS, 385, 687
- Roškar et al. (2008) Roškar, R., Debattista, V. P., Quinn, T. R., Stinson, G. S., & Wadsley, J. 2008, ApJ, 684, L79
- Qu et al. (2016) Qu, Y., Helly, J. C., Bower, R. G., et al. 2016, arXiv:1609.07243
- Yu & Wang (2016) Yu, H., & Wang, F. Y. 2016, ApJ, 820, 114