Sc and neutron-capture abundances in Galactic low- and high- field halo stars††thanks: This paper includes data gathered with the 6.5 meter Magellan Telescopes located at Las Campanas Observatory, Chile.
Abstract
We determine relative abundance ratios for the neutron-capture elements Zr, La, Ce, Nd, and Eu for a sample of 27 Galactic dwarf stars with [Fe/H] . We also measure the iron-peak element Sc. These stars separate into three populations (low- and high- halo and thick-disc stars) based on the [/Fe] abundance ratio and their kinematics as discovered by Nissen & Schuster. We find differences between the low- and high- groups in the abundance ratios of [Sc/Fe], [Zr/Fe], [La/Zr], [Y/Eu], and [Ba/Eu] when including Y and Ba from Nissen & Schuster. For all ratios except [La/Zr], the low- stars have a lower abundance compared to the high- stars. The low- stars display the same abundance patterns of high [Ba/Y] and low [Y/Eu] as observed in present-day dwarf spheroidal galaxies, although with smaller abundance differences, when compared to the high- stars. These distinct chemical patterns have been attributed to differences in the star formation rate between the two populations and the contribution of low-metallicity, low-mass asymptotic giant branch (AGB) stars to the low- population. By comparing the low- population with AGB stellar models, we place constraints on the mass range of the AGB stars.
keywords:
Stars: abundances – Galaxy: halo1 Introduction
Understanding the earliest phases of the assembly of our Galaxy, the Milky Way, remains a key issue in contemporary astronomy. Cosmological simulations predict that mergers and accretion of satellite dwarf galaxies may play an important role through hierarchical structure formation (e.g., Bullock & Johnston, 2005; Pillepich et al., 2014). Our Galaxy is no exception. Observational support for the hierarchical nature of Galactic formation, and the role dwarf galaxies play in that process, comes from the accretion of the Sagittarius dwarf galaxy (Ibata, Gilmore & Irwin, 1994) and numerous tidal streams observed in the Galactic halo (e.g., Belokurov et al., 2006).
The chemical abundances and kinematics of Galactic halo stars hold valuable clues concerning Galactic formation at the earliest times (e.g., Eggen, Lynden-Bell & Sandage, 1962; Searle & Zinn, 1978; Venn et al., 2004; Frebel & Norris, 2015). Due to their long lifetimes, FGK-type dwarf stars are ideal for tracing the evolution of the Galaxy. The atmospheres of dwarf stars closely mirror the chemical composition of the gas clouds from which they formed. This means that spectroscopic studies of these ‘stellar fossils’ will enable us to probe the chemical and kinematic history of our Galaxy over cosmic time.
Comparison of chemical abundances between the Galactic halo and satellite dwarf spheroidal galaxies (dSph) reveals differences in their chemical composition, most notably in the [/Fe] ratio (e.g., Shetrone, Côté & Sargent, 2001; Tolstoy et al., 2003; Venn et al., 2004; Tolstoy, Hill & Tosi, 2009). On average, dSph stars with [Fe/H] have lower [/Fe] than the Galaxy. The [/Fe] ratio depends on the relative number of Type Ia to Type II supernovae, and this quantity is sensitive to the star formation rate (e.g., Tinsley, 1979; Matteucci & Greggio, 1986; Wheeler, Sneden & Truran, 1989; Nomoto, Kobayashi & Tominaga, 2013). The lower [/Fe] observed in dSph would therefore suggest a slower star formation rate relative to the Galaxy. Differences in the [/Fe] ratio between the halo and present-day dwarf galaxies preclude the continuous merging of such systems although it may be that the mergers of massive dwarf galaxies occurred at very early times in the formation of the Galactic halo (Venn et al., 2004).
Although a handful of -poor stars were known to exist in the Galactic halo (e.g., Carney et al., 1997; King, 1997; Preston & Sneden, 2000; Ivans et al., 2003), the study by Nissen & Schuster (2010) (hereafter NS10) provided the first compelling evidence that the halo hosts two populations that are well separated in [/Fe]. NS10 studied 94 halo dwarf stars in the solar neighbourhood using a careful differential analysis resulting in abundance errors for [/Fe] of only 0.02 dex. They argued that the low- stars have kinematics consistent with accretion from a satellite galaxy with a slower star formation rate than the high- population which most likely formed in-situ in the Galaxy. Additionally, NS10 found that the low- and high- populations separate in the [Na/Fe] vs. [Ni/Fe] abundance plane. No separation was seen for [Cr/Fe].
The study of NS10 was extended by Ramírez, Meléndez & Chanamé (2012). Through an analysis of the 777 nm O I triplet lines, they found that the low- stars have a lower [O/Fe] abundance compared to the high- and thick-disc stars. The low- stars also show a cosmic star-to-star scatter in [O/Fe] at a given [Fe/H].
Before continuing, it is important to recognise that any attempts to infer the chemical enrichment history of a stellar population requires a detailed understanding of the nucleosynthetic origin of individual elements (Nissen, 2013). Low- to intermediate-mass stars undergo rich nucleosynthesis once they reach the asymptotic giant branch (AGB) phase. It has been observationally confirmed that the slow neutron-capture process (-process) takes place in AGB stars (e.g., Wallerstein et al., 1997; Busso, Gallino & Wasserburg, 1999). The -process is responsible for the production of around half of the abundance of the heavy elements beyond iron. Through strong mass loss, AGB stars eject enriched material into the interstellar medium and pollute the next generation of stars (Herwig, 2005; Karakas & Lattanzio, 2014).
AGB stars may play an important role in the origin of chemical abundance differences between the Galaxy and nearby dwarf galaxies. In addition to [/Fe], differences in the ratios of [Ba/Y] and [Y/Eu] are found between dSph and the Galaxy (e.g., Tolstoy, Hill & Tosi 2009). The high [Ba/Y] observed in dSph was attributed to low-mass AGB stars enriching the interstellar medium as a result of the slower chemical evolution. To explain the low [Y/Eu] observed, Venn et al. (2004) suggested that metal-poor AGB stars did not contribute as much Y (compared to more metal-rich AGB stars) because the production of second -process peak elements such as Ba and La were favoured over first -process peak elements such as Zr and Y (Busso et al., 2001).
Nissen & Schuster (2011) (hereafter NS11) determined abundances for two neutron-capture elements produced by the -process in AGB stars, Ba and Y (along with the iron-peak elements Mn, Cu, and Zn). They discovered that the low- and high- populations could be separated in [Cu/Fe] and [Zn/Fe]. More importantly, NS11 found that the [Ba/Y] ratio differs between the two populations with the low- stars showing a higher [Ba/Y] value. Those chemical abundance patterns are similar to that found in dSph by Venn et al. (2004) and reinforces the hypothesis that the low- stars are likely to have been accreted from dSph.
The NS10 sample provides a unique opportunity to study additional neutron-capture element abundances in the low- and high- populations. Such an analysis will enable us to examine the abundances for a larger range of neutron-capture elements, with high-precision, in stars likely to have been accreted from dwarf galaxies. Stars currently in dwarf galaxies are very faint such that high precision chemical abundance studies cannot be conducted with existing facilities. The aim of this study is to investigate the role of AGB stars in the chemical enrichment of the Galactic halo and dSph. Specifically, we build upon the work of NS10 and NS11 by studying additional -process elements (Zr, La, Ce, and Nd). We also measure, for the first time with this unique sample, a rapid neutron-capture process (-process) element (Eu). Finally, we measure Sc which has been observed to behave like an element (e.g., Nissen et al., 2000).
2 Sample selection and observations
Our observations focused on obtaining high quality blue spectra for stars in the NS10 sample. In the analyses of NS10 and NS11, only lines redder than 4700 Å were measured. Our targets were selected to include both low- and high- stars across the metallicity range of [Fe/H] . The sample consists of 13 low- stars, 6 high- stars, and 8 thick-disc (TD) stars, including the two reference TD stars used in the studies by NS10 and NS11, HD 22879 and HD 76932.
Programme stars were observed using the Magellan Inamori Kyocera Echelle (MIKE) spectrograph (Bernstein et al., 2003) on the Magellan (Clay) telescope during February 2011 and June 2011. We used the 0.35” slit size which provides a resolving power of 83,000 in the blue. Typical exposure times ranged from 500 to 5000 seconds per target and the signal-to-noise ratio per pixel of the spectra was approximately 400 at 4500 Å. The wavelength coverage provided by MIKE is 3350 to 9000 Å. Data reduction was accomplished using iraf111iraf is distributed by the National Optical Astronomy Observatory, which is operated by the Association of Universities for Research in Astronomy (AURA) under a cooperative agreement with the National Science Foundation. with the MIKE mtools222www.lco.cl/telescopes-information/magellan/instruments/mike/iraf-tools/iraf-mtools-package package. Continuum fitting was performed using the Spectroscopy Made Hard (smh) package as used in Casey et al. (2014) and described in Casey (2014).
3 Abundances
Following NS10, we perform a differential line-by-line analysis relative to the TD star HD 22879. This approach enables us to obtain high-precision abundance ratios which are necessary in identifying possible separations between the low- and high- populations. The model atmospheres used in the analysis were one-dimensional, plane parallel, local thermodynamic equilibrium (LTE) atlas9 models by Castelli & Kurucz (2003). Interpolation between , , [Fe/H], and [/Fe] was required to produce model atmospheres. The stellar parameters, , , and log , as well as the abundance ratios of [Fe/H] and [/Fe] were taken from NS10 and NS11 (see Table 1). For a complete discussion on the determination of these parameters see NS10 and NS11. We use stellar parameters from NS10 without the correction for effective temperature of 100 K from NS11. Given the differential nature of the abundance analysis and that most stars have fairly similar stellar parameters, a systematic shift of 100 K is likely to have a minimal effect on the final differential abundances.
| ID | log | [Fe/H] | [/Fe] | Classa | ||
|---|---|---|---|---|---|---|
| (K) | (cgs) | (km s-1) | ||||
| CD -45 3283 | 5597 | 4.55 | 1.0 | 0.91 | 0.12 | low- |
| CD -61 0282 | 5759 | 4.31 | 1.3 | 1.23 | 0.22 | low- |
| G 16-20 | 5625 | 3.64 | 1.5 | 1.42 | 0.26 | (low-) |
| G 18-28 | 5372 | 4.41 | 1.0 | 0.83 | 0.31 | high- |
| G 18-39 | 6040 | 4.21 | 1.5 | 1.39 | 0.34 | high- |
| G 31-55 | 5638 | 4.30 | 1.4 | 1.10 | 0.29 | high- |
| G 56-30 | 5830 | 4.26 | 1.3 | 0.89 | 0.11 | low- |
| G 56-36 | 5933 | 4.28 | 1.4 | 0.94 | 0.20 | low- |
| G 66-22 | 5236 | 4.41 | 0.9 | 0.86 | 0.12 | low- |
| G 170-56 | 5994 | 4.12 | 1.5 | 0.92 | 0.17 | low- |
| HD 3567 | 6051 | 4.02 | 1.5 | 1.16 | 0.21 | low- |
| HD 22879 | 5759 | 4.25 | 1.3 | 0.85 | 0.31 | TD |
| HD 25704 | 5868 | 4.26 | 1.4 | 0.85 | 0.24 | TD |
| HD 76932 | 5877 | 4.13 | 1.4 | 0.87 | 0.29 | TD |
| HD 103723 | 5938 | 4.19 | 1.2 | 0.80 | 0.14 | low- |
| HD 105004 | 5754 | 4.30 | 1.2 | 0.82 | 0.14 | low- |
| HD 111980 | 5778 | 3.96 | 1.5 | 1.08 | 0.34 | high- |
| HD 120559 | 5412 | 4.50 | 1.1 | 0.89 | 0.30 | TD |
| HD 126681 | 5507 | 4.45 | 1.2 | 1.17 | 0.35 | TD |
| HD 179626 | 5850 | 4.13 | 1.6 | 1.00 | 0.32 | high- |
| HD 189558 | 5617 | 3.80 | 1.4 | 1.12 | 0.35 | TD |
| HD 193901 | 5650 | 4.36 | 1.2 | 1.07 | 0.17 | low- |
| HD 194598 | 5942 | 4.33 | 1.4 | 1.09 | 0.20 | low- |
| HD 199289 | 5810 | 4.28 | 1.3 | 1.04 | 0.30 | TD |
| HD 205650 | 5698 | 4.32 | 1.3 | 1.17 | 0.30 | TD |
| HD 219617 | 5862 | 4.28 | 1.5 | 1.45 | 0.28 | (low-) |
| HD 230409 | 5318 | 4.54 | 1.1 | 0.85 | 0.27 | high- |
aFor stars with [Fe/H] 1.4, the classification is uncertain (NS10).
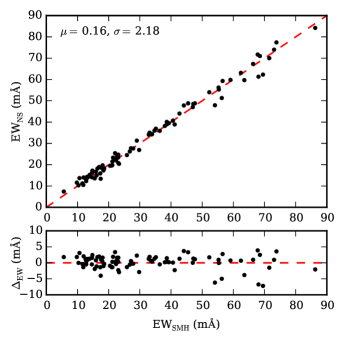
Elemental abundances for Zr, Ce, and Nd were derived from the analysis of equivalent widths (EWs) using smh. For lines with EW 60 mÅ, a Gaussian profile was fitted to the line. For lines with EW larger than 60 mÅ, a Voigt profile was used. Figure 1 presents a comparison of 85 EW measurements (excluding Fe I and Fe II) of NS10 and NS11 to the EWs measured using smh with the same line list for HD 22879. The mean EW difference between the two methods is 0.16 0.24 mÅ ( = 2.18 mÅ).
| ID | Zr II | Ce II | Ce II | Nd II |
|---|---|---|---|---|
| 4208.98 Å | 4562.36 Å | 4628.16 Å | 4706.54 Å | |
| CD -45 3283 | 21.3 | 7.6 | 5.3 | 7.0 |
| CD -61 0282 | 17.7 | 5.2 | 2.7 | 4.0 |
| G 16-20 | 22.1 | 6.6 | 4.1 | 4.0 |
| G 18-28 | 29.1 | 10.3 | … | 9.4 |
| G 18-39 | 17.3 | … | 2.0 | 3.0 |
| G 31-55 | 23.8 | 4.9 | 3.6 | 4.6 |
| G 56-30 | 23.1 | 6.6 | 7.2 | 2.9 |
| G 56-36 | 26.1 | 6.7 | 4.4 | 5.4 |
| G 66-22 | 26.2 | … | 8.9 | 10.6 |
| G 170-56 | 23.4 | 6.8 | 3.4 | 4.2 |
| HD 3567 | 21.3 | 4.9 | 5.3 | 4.0 |
| HD 22879 | 31.4 | 8.2 | 6.5 | 7.9 |
| HD 25704 | 22.4 | 6.5 | 6.1 | 7.1 |
| HD 76932 | 34.3 | 8.4 | 5.1 | 7.9 |
| HD 103723 | 27.5 | 9.4 | 7.4 | 7.7 |
| HD 105004 | 24.6 | … | 9.4 | 5.0 |
| HD 111980 | 37.4 | 10.6 | 6.5 | 6.6 |
| HD 120559 | 23.8 | … | 4.1 | 7.5 |
| HD 126681 | 28.9 | 7.4 | 5.4 | 5.0 |
| HD 179626 | 27.6 | 5.9 | 4.1 | 4.1 |
| HD 189558 | 39.3 | 10.9 | 8.9 | 7.1 |
| HD 193901 | 17.4 | 5.2 | … | 5.3 |
| HD 194598 | 15.8 | 3.6 | 3.2 | 2.9 |
| HD 199289 | 19.1 | 3.3 | 2.5 | 3.6 |
| HD 205650 | 19.1 | 4.6 | 3.4 | 3.0 |
| HD 219617 | 10.7 | … | 3.3 | 2.0a |
| HD 230409 | 26.2 | 8.2 | 5.8 | 10.5 |
a Upper limit
We use the atomic data compiled by Yong et al. (2005) for the measured absorption lines. The abundance of Zr is derived from the EW of the Zr II line at 4208.98 Å which is unblended with other lines, allowing for a reliable measurement. The Zr II line is detected in all stars with all EW measurements being greater than 10 mÅ (see Table 2). Ce abundances have been determined using the EWs of two Ce II lines at 4562.36 Å and 4628.16 Å. Seven stars only have one Ce II line available for measurement: five stars do not have a measurable 4562.36 Å line whereas two stars do not have a measurable 4628.16 Å line (see Table 2). For all but three Ce lines, the EW is less than 10 mÅ.
Nd abundances have been determined using the Nd II line at 4706.54 Å. The EW measurements are less than 10 mÅ except in two stars (G 66-22 and HD 230409). We arbitrarily set a minimum reliable EW measurement limit of 2 mÅ. One star, the most metal-poor in the sample (HD 219617), falls below our 2 mÅ limit and therefore we adopt an upper limit of 2 mÅ for the Nd EW.
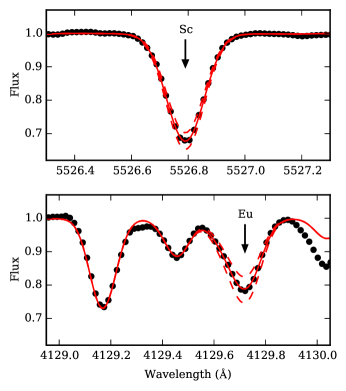
For Sc, La, and Eu, we fit synthetic spectra generated by the LTE spectrum synthesis program MOOG (v. 2013, Sneden, 1973) to determine abundances. These elements require the consideration of hyperfine splitting (HFS) and/or isotopic shifts. Figure 2 illustrates the fit of the synthetic spectrum to the observed spectrum for the Sc and Eu lines of HD 22879. The best fitting synthetic spectrum was determined using minimisation. For Sc, the log values of Nissen et al. (2000) were utilised for the 5526.81 Å absorption line. La was determined using one La II line at 4086.71 Å with log values from Lawler, Bonvallet & Sneden (2001). For the Eu II spectral line at 4129.72 Å we use the log values from Lawler et al. (2001) and solar isotope ratios from Lodders (2003).
We adopt solar elemental abundances from Asplund et al. (2009) as detailed in Table 3. Since we perform a differential analysis to measure abundances, the choice of solar abundance only shifts the stellar abundances up or down and does not affect the relative abundances. To reiterate, we are primarily interested in relative abundances, and therefore abundance differences, between the low- and high- populations. The abundances are given in Table 4.
| Element | Z | |
|---|---|---|
| Sca | 21 | 3.05 |
| Zr | 40 | 2.58 |
| La | 57 | 1.10 |
| Ce | 58 | 1.58 |
| Nd | 60 | 1.42 |
| Eu | 63 | 0.52 |
a Meteoritic value.
We estimated errors using the stellar parameter uncertainties from NS10 where the differential errors for and are and K, respectively. The 1- errors from NS10 for [Fe/H] and [/Fe] were 0.04 and 0.02 dex, respectively. We estimated the 1- errors in [Zr/Fe] and [Ce/Fe] to be 0.04. For [Sc/Fe], [La/Fe], and [Eu/Fe], the errors are 0.05. The error for [Nd/Fe] is 0.07.
| Star | [Fe/H] | [Sc/Fe] | [Zr/Fe] | [La/Fe] | [Ce/Fe] | [Nd/Fe] | [Eu/Fe] |
|---|---|---|---|---|---|---|---|
| CD -45 3283 | 0.91 | 0.11 | 0.07 | 0.00 | 0.01 | 0.36 | 0.31 |
| CD -61 0282 | 1.23 | 0.15 | 0.00 | 0.01 | 0.05 | 0.32 | 0.26 |
| G 16-20 | 1.42 | 0.11 | 0.00 | 0.02 | 0.04 | 0.17 | 0.32 |
| G 18-28 | 0.83 | 0.11 | 0.03 | 0.02 | 0.04 | 0.34 | 0.13 |
| G 18-39 | 1.39 | 0.00 | 0.21 | 0.07 | 0.03 | 0.47 | 0.26 |
| G 31-55 | 1.10 | 0.03 | 0.06 | 0.08 | 0.11 | 0.26 | 0.05 |
| G 56-30 | 0.89 | 0.22 | 0.12 | 0.06 | 0.04 | 0.09 | 0.09 |
| G 56-36 | 0.94 | 0.02 | 0.04 | 0.04 | 0.05 | 0.31 | 0.13 |
| G 66-22 | 0.86 | 0.16 | 0.08 | 0.04 | 0.02 | 0.34 | 0.30 |
| G 170-56 | 0.92 | 0.14 | 0.10 | 0.02 | 0.16 | 0.14 | 0.16 |
| HD 3567 | 1.16 | 0.04 | 0.05 | 0.16 | 0.07 | 0.33 | 0.39 |
| HD 22879 | 0.85 | 0.12 | 0.06 | 0.09 | 0.04 | 0.34 | 0.16 |
| HD 25704 | 0.85 | 0.09 | 0.16 | 0.02 | 0.09 | 0.33 | 0.15 |
| HD 76932 | 0.87 | 0.15 | 0.13 | 0.03 | 0.08 | 0.36 | 0.21 |
| HD 103723 | 0.80 | 0.03 | 0.05 | 0.03 | 0.01 | 0.33 | 0.17 |
| HD 105004 | 0.82 | 0.04 | 0.13 | 0.12 | 0.10 | 0.10 | 0.04 |
| HD 111980 | 1.08 | 0.00 | 0.25 | 0.13 | 0.09 | 0.33 | 0.14 |
| HD 120559 | 0.89 | 0.17 | 0.05 | 0.05 | 0.22 | 0.32 | 0.20 |
| HD 126681 | 1.17 | 0.00 | 0.28 | 0.14 | 0.13 | 0.34 | 0.20 |
| HD 179626 | 1.00 | 0.12 | 0.03 | 0.02 | 0.14 | 0.14 | 0.03 |
| HD 189558 | 1.12 | 0.09 | 0.24 | 0.07 | 0.08 | 0.24 | 0.17 |
| HD 193901 | 1.07 | 0.19 | 0.14 | 0.00 | 0.08 | 0.31 | 0.24 |
| HD 194598 | 1.09 | 0.07 | 0.11 | 0.03 | 0.11 | 0.17 | 0.27 |
| HD 199289 | 1.04 | 0.08 | 0.09 | 0.12 | 0.30 | 0.15 | 0.09 |
| HD 205650 | 1.17 | 0.01 | 0.01 | 0.03 | 0.07 | 0.14 | 0.19 |
| HD 219617 | 1.45 | 0.11 | 0.05 | 0.11 | 0.18 | 0.03a | 0.21 |
| HD 230409 | 0.85 | 0.05 | 0.03 | 0.00 | 0.07 | 0.43 | 0.27 |
a Upper limit
3.1 Zr
The neutron-capture element Zr is predominately produced by AGB stars and is a first -process peak element. The -process contribution to Zr in the Solar System is 80% (e.g., Simmerer et al., 2004; Sneden, Cowan & Gallino, 2008; Bisterzo et al., 2014). By determining the abundance of Zr, we expand on the measurements of Y, another first s-process peak element whose abundances were previously obtained by NS11.
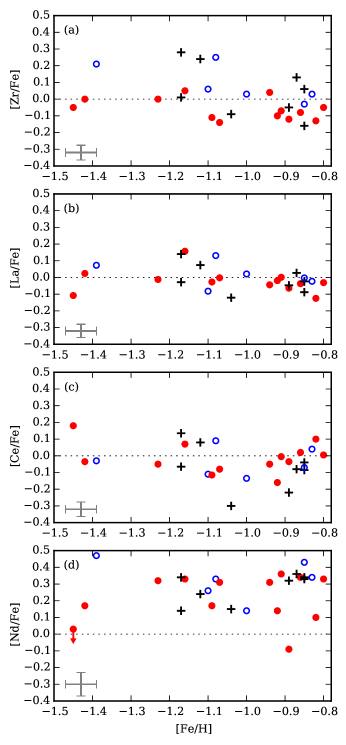
Figure 3(a) shows [Zr/Fe] as a function of [Fe/H]. The dispersion in [Zr/Fe] is dex which is larger than the error of 0.04 dex. When considering the two populations, the scatter in [Zr/Fe] is smaller for the low- stars with a dispersion of 0.06 dex compared to a dispersion of 0.13 dex when combining the high- and TD stars. In addition to the difference in the dispersion of [Zr/Fe], the low- stars have a systematically lower [Zr/Fe] abundance compared to the high- and TD stars.
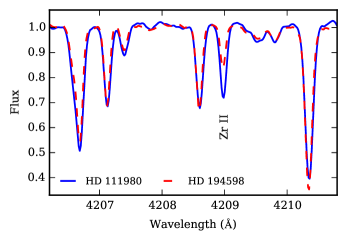
This possible separation in the high- and low- populations is in agreement with the slight separation in abundance measurements of [Y/Fe] for the two populations seen in NS11. As Zr and Y are both first-peak -process elements, they are expected to follow the same trend. Figure 4 demonstrates the difference in the Zr abundance for a low- star (HD 194598) and a high- star (HD 111980) at nearly the same metallicity (see Table 1). The low- star has a weaker Zr II line than the high- star. While the effective temperature differs between these two stars by approximately 150 K, all other lines in this region exhibit very similar strengths.
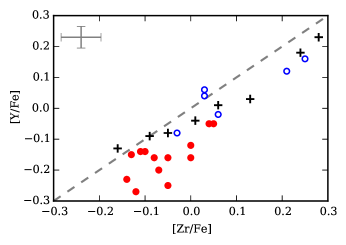
A comparison between [Y/Fe] as measured by NS11 and [Zr/Fe] is presented in Figure 5. The abundance of Zr follows the abundance of Y which is expected if Y and Zr have a common origin. While there is a systematic offset between [Y/Fe] and [Zr/Fe] which may be due to errors in the values of the lines, the important point is that the slope of the data is close to 1. The high- stars have a tighter correlation between [Y/Fe] and [Zr/Fe] compared to the low- stars.
3.2 La, Ce, and Nd
We extend upon the Ba measurements of NS11 by determining abundances for other elements belonging to the second -process peak, namely La, Ce, and Nd.
The -process contribution to La in the Solar System is 75% and there are a number of advantages with using La as an -process indicator compared to Ba (e.g., Simmerer et al. 2004; Winckler et al. 2006). While Ba consists of five stable isotopes and requires the consideration of isotope shifts, 99.91% of La is in the isotope 139La (Lodders, 2003; Asplund et al., 2009). Figure 3(b) presents [La/Fe] as a function of [Fe/H]. There is no clear difference in the La abundance between the low-, high-, and TD stars. The dispersion in the abundance of [La/Fe] is dex, the lowest of all the -process abundances measured here. The [La/Fe] ratio is almost constant with [Fe/H] and the mean abundance close to the solar value.
The -process contribution to Ce in the Solar System is 81% where 140Ce is the only stable isotope accessible by the -process (Sneden, Cowan & Gallino, 2008). Figure 3(c) presents the results for [Ce/Fe]. The majority of stars have a subsolar [Ce/Fe] abundance with a mean value of around 0.04 dex and no apparent separation between the low- and high- stars. The dispersions for the low- and high- stars are essentially the same (0.09 dex compared to 0.10 dex, respectively).
For Nd, 58% of the Solar System abundance is due to the -process (Sneden, Cowan & Gallino, 2008). Figure 3(d) presents the abundance of [Nd/Fe] against [Fe/H]. Due to the weak Nd II line for HD 219617, we provide an upper limit of [Nd/Fe] for this object based on an EW limit of 2 mÅ. There is no obvious difference in [Nd/Fe] between the two populations except for a few low- stars having a lower Nd abundance. This causes the dispersion to be higher for the low- stars relative to the high- stars, 0.14 dex compared 0.10 dex. The mean abundance of [Nd/Fe] is 0.26 dex and all but one star has a supersolar [Nd/Fe] abundance.
3.3 Eu
Eu is predominately an -process element with less than 2% of the Solar System abundance a result of -process nucleosynthesis (Sneden, Cowan & Gallino, 2008). We have included Eu in this study to investigate the contribution of -process nucleosynthesis to the low- and high- stars.
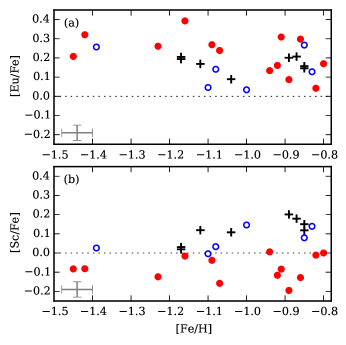
Figure 6(a) presents the [Eu/Fe] abundances where there is a potential separation between the two populations: the low- stars appear to show a higher [Eu/Fe] abundance compared to the high- stars. However, due to the lack of stars at lower metallicities, the separation is not as clear as what is found for other elements such as Zr. The low- group also shows a potential decrease in [Eu/Fe] with increasing metallicity. A larger sample of stars is needed to confirm these results.
3.4 Sc
There is only one stable isotope of Sc (45Sc) and it is mainly synthesised during carbon and neon burning in massive stars (Woosley, Heger & Weaver, 2002). It is also produced to a lesser extent in AGB stars (e.g., Fishlock et al., 2014). We measure Sc in order to verify the conclusions of Nissen et al. (2000) in which the low- stars have a lower [Sc/Fe] abundance compared to the high- stars.
Figure 6(b) reveals a clear separation in [Sc/Fe]. The low- stars have a subsolar [Sc/Fe] abundance with a mean value of 0.11 dex whereas the high- stars have a mostly supersolar abundance with a mean value of 0.07 dex. These results confirm the separation in [Sc/Fe] found in the earlier work by Nissen et al. (2000) between the low- and high- populations.
4 Analysis
As with the NS10 and NS11 studies, we combine the TD and high- halo stars into one high- group. Due to a smaller sample size compared to NS11, we do not remove the abundance dependence on [Fe/H] for the high- stars as it cannot be definitively determined. Given that our sample size is smaller than in NS10, we now seek to quantify this potential limitation by introducing our methodology on how we decide whether a given abundance ratio exhibits a difference (i.e., separation) between the low- and high- groups.
We first consider the NS10 measurements of Cr, a representative element for which NS10 found no significant separation between the low- and high- groups. Using a two sample Kolmogorov-Smirnov (KS) test between the low- and high- groups (without distinguishing TD stars), we find a -value of 0.07 when considering [Cr/Fe] for all stars in the NS10 sample with [Fe/H] .
In order to investigate how our smaller sample size affects our ability to identify abundance separations, we performed the following tests. We randomly select 13 low- and 14 high- stars from the full NS10 sample with [Fe/H] , apply the KS test and obtain the -value. We repeat this exercise 10,000 times and find that for approximately 25% of the realisations, the -value is below 0.07. If we arbitrarily define the threshold to be a -value of 0.03, roughly 10% of the random realisations result in a -value below 0.03.
We now examine [Ba/Y], an abundance ratio that was found to exhibit a significant separation between the low- and high- populations. For the full NS10 sample with [Fe/H] , we compute a -value of . We then seek to quantify the effect of having a smaller sample size. As above, we randomly select 13 low- and 14 high- stars from the full NS10 sample with [Fe/H] , apply the KS test and obtain the -value. We repeat the exercise 10,000 times. For a threshold -value of 0.03, about 99.7% of random realisations have a -value below this level, indicating that we are able to identify the separation in [Ba/Y] in all but 0.3% of cases.
Based on these tests, we choose a -value of 0.03 which ensures that there is at least a 90% chance that the abundance separation in our sample of 27 stars is genuine despite having a smaller number of stars than NS10 and NS11. We also confirm using a KS test that the high- population and TD stars have a significant probability of coming from the same population. In Table 5 we present the mean of each abundance ratio and its standard deviation for both low- and high- groups. We also present the -value of the two sample KS test between the low- and high- groups. The analyses of [Y/Fe], [Ba/Fe], and [Ba/Y] are included in Table 5 for comparison using the abundances measured by NS11 for our sample of 27 stars. For comparison, the mean -value calculated for [Mg/Fe] when randomly selecting 13 low- and 14 high- stars is .
| low- | high- | ||||||
|---|---|---|---|---|---|---|---|
| x̃ | x̃ | -value | |||||
| [Sc/Fe] | 0.107 | 0.062 | 0.067 | 0.063 | 0.000 | ||
| [Zr/Fe] | 0.058 | 0.061 | 0.069 | 0.131 | 0.017 | ||
| [La/Fe] | 0.022 | 0.065 | 0.004 | 0.076 | 0.589 | ||
| [Ce/Fe] | 0.012 | 0.087 | 0.058 | 0.114 | 0.340 | ||
| [Nd/Fe] | 0.217 | 0.137 | 0.299 | 0.098 | 0.614 | ||
| [Eu/Fe] | 0.222 | 0.097 | 0.161 | 0.068 | 0.173 | ||
| [La/Zr] | 0.037 | 0.061 | 0.066 | 0.084 | 0.005 | ||
| [/Fe] | 0.109 | 0.057 | 0.049 | 0.117 | 0.004 | ||
| [/Fe] | 0.005 | 0.056 | 0.038 | 0.084 | 0.303 | ||
| [/] | 0.114 | 0.046 | 0.010 | 0.065 | 0.000 | ||
| [Y/Eu] | 0.382 | 0.101 | 0.133 | 0.122 | 0.000 | ||
| [/Eu] | 0.332 | 0.092 | 0.112 | 0.126 | 0.001 | ||
| [Ba/Eu] | 0.387 | 0.122 | 0.253 | 0.122 | 0.024 | ||
| [La/Eu] | 0.244 | 0.064 | 0.157 | 0.082 | 0.173 | ||
| [/Eu] | 0.218 | 0.082 | 0.122 | 0.081 | 0.022 | ||
| [Y/Fe] | 0.160 | 0.064 | 0.028 | 0.107 | 0.000 | ||
| [Ba/Fe] | 0.165 | 0.070 | 0.092 | 0.115 | 0.303 | ||
| [Ba/Y] | 0.005 | 0.055 | 0.120 | 0.030 | 0.000 | ||
For abundances relative to Fe (e.g., [Zr/Fe]), Sc and Zr show a separation between the low- and high- groups. For both elements, the high- group has a higher [X/Fe] ratio than the low- group.
We find that the separation between the low- and high- groups is detected for [Y/Fe] despite having a smaller sample size than NS11. In contrast to the first -process peak elements Y and Zr, the abundance ratios for elements belonging to the second peak [La/Fe], [Ce/Fe], and [Nd/Fe] show no significant difference between the low- and high- groups. The second -process peak element Ba, measured by NS11, also shows no separation in [Ba/Fe] between the two groups.
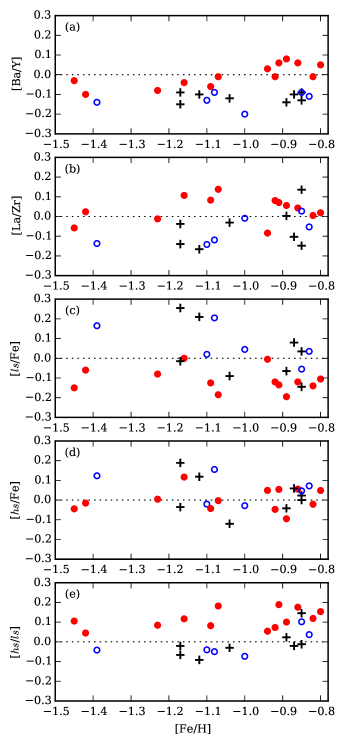
We confirm the separation in [Ba/Y] reported by NS11 (see Figure 7(a)). In Figure 7(b) we plot [La/Zr] and are able to reproduce the separation between a light- () element at the first -process peak and a heavy- () element at the second peak. The -value of 0.005 is lower than the individual -values for [Zr/Fe] (0.017) and [La/Fe] (0.589) demonstrating that a clear separation between the low- and high- populations can be seen when considering certain combinations of elements.
Assuming that the higher [La/Zr] ratios in the low- stars are due to enrichment from AGB stars, we use the model predictions of Fishlock et al. (2014) with [Fe/H] = to estimate the mass range of those AGB stars. Starting at lower masses (1 to 3 ), calculations predict [La/Zr] ratios above solar; for example, the 3 model predicts a final [La/Zr] ratio of 0.32 dex. Moving to the intermediate masses (3.25 to 7 ), calculations predict [La/Zr] ratios below solar; for example, the 6 model predicts a final [La/Zr] ratio of dex. Therefore, based on the [La/Zr] ratio, AGBs stars in the range 1 to 3 could be responsible for the abundance difference between the low- and high- groups.
For stars in the range [Fe/H] , there is a possible separation in [Eu/Fe] where the low- group has a higher [Eu/Fe] abundance compared to the high- group. However, higher metallicity stars show no difference between the two groups and the hint of a separation is not statistically significant with a -value of 0.173. We return to this intriguing possibility of a separation in Section 5.
The -process indicators are the average abundance of the elements at each of the two -process peaks. We include the Y and Ba results from NS11 and define [/Fe] and [/Fe]333As noted, the Solar System abundance of Nd has a 40% contribution from the -process. Had we excluded Nd from , as did Lugaro et al. (2012), our conclusions would be unchanged. to be:
| (1) |
and
| (2) |
The [/Fe] and [/Fe] ratios against [Fe/H] are presented in Figure 7(c) and 7(d). The low- stars have a lower [/Fe] ratio than the high- stars. For [/Fe], there is no apparent difference between the two populations.
Figure 7(e) shows there is a clear separation in the -process indicator [/] between the low- and high- groups. The low- population has a higher [/] ratio than the high- population with a mean [/] value of dex compared to dex for the high- population. All the low- stars have a supersolar [/] ratio and this would be expected if the stars were enriched by previous generations of low-mass AGB stars. For example, the low-mass models of Fishlock et al. (2014) end the AGB phase with [/] ratios of between 0.45 and 0.59 dex, excluding the 1 model which experiences minimal third dredge-up. In contrast, the intermediate-mass models have final [/] ratios between and dex. The differences between the low-mass and intermediate-mass models are a result of the different neutron sources (Lugaro et al., 2012).
The abundance ratio of -process elements to -process elements offers a powerful diagnostic for Galactic chemical evolution (Wheeler, Sneden & Truran, 1989; McWilliam, 1997). In Figure 8 we present the abundance ratios of [/Eu], [Y/Eu], [/Eu], and [La/Eu] against [Fe/H]. The low- stars have a lower [/Eu] ratio compared to the high- stars with the separation more evident at [Fe/H] . There is also an apparent increase in [/Eu] with increasing [Fe/H] for the low- group which is not seen in the high- group.
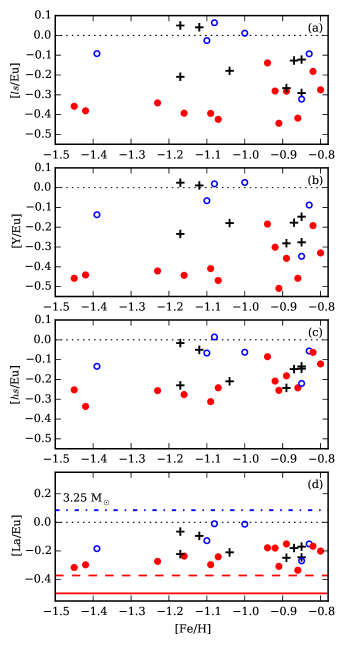
Figure 8(b) presents the abundance ratio of the element, Y, relative to Eu. The low- group has a lower abundance of [Y/Eu] compared to the high- group with a -value of . This -value is more significant than the [/Eu] separation. We also find that the [Y/Eu] abundance for the low- stars with [Fe/H] is almost constant at approximately dex with minimal scatter. Similar behaviour is also seen for [/Fe].
The separation in [/Eu] is not as clear as that of [/Eu], although it has a -value of 0.022, just below the chosen significance level. The low- group has a [/Eu] ratio that is closer to the -process contribution of the elements and Eu in the Solar System than the high- group. As with [/Fe], there is an apparent increase in [/Eu] with increasing [Fe/H] for the low- stars.
Figure 8(d) presents the abundance ratios of the element, La, relative to Eu where all the stars have a subsolar [La/Eu] ratio. Unlike the separation found for [/Eu], we do not find a separation in [La/Eu] between the two groups. We also show the -process contribution to the Solar System abundances of La and Eu (and its uncertainty) in Figure 8(d) as determined by Winckler et al. (2006). The theoretical prediction of an AGB stellar model with an initial mass of 3.25 at a metallicity of [Fe/H] = , from Fishlock et al. (2014) is also presented in Figure 8. Of all the models calculated by Fishlock et al. (2014), the lowest [La/Eu] ratio of 0.08 dex occurs for the 3.25 M⊙ model.
5 Discussion
We have studied chemical abundances in a subsample of low- and high- stars from NS10 in which the low- stars were likely accreted from satellite dwarf galaxies whereas the high- stars are representative of Galactic halo objects. We now seek to understand the abundance differences between these populations.
For Sc, we confirm and extend upon results from Nissen et al. (2000) in which the low- stars have a lower [Sc/Fe] ratio than the high- stars. That is, Sc appears to behave like an -capture element. The simplest explanation is that Sc is preferentially made in higher mass stars along with the elements and that Type Ia SNe have a negligible contribution to Sc (Iwamoto et al., 1999; Woosley & Weaver, 1995; Romano et al., 2010). Indeed, Nissen (2016) find that the [Sc/Fe] ratio exhibits a similar behaviour with age as [Mg/Fe] in their sample of solar twins. The low- stars have low [Sc/Fe] ratios due to the extra contribution of Fe from Type Ia SNe.
As noted in the introduction, there is another chemical signature besides [/Fe]444We note that there is some overlap in [/Fe] between dSph stars and Galactic halo stars with extreme retrograde orbits (Fulbright, 2002; Stephens & Boesgaard, 2002). Additionally, the most metal-poor stars in dSph appear to have halo-like [/Fe] ratios (Frebel et al., 2010; Norris et al., 2010; Venn et al., 2012). that distinguishes halo stars from their dSph counterparts, namely, the neutron-capture element abundance ratios. In dSph, roughly two-thirds of the stars show a higher [Ba/Y] ratio and a lower [Y/Eu] ratio compared to Galactic halo stars (Venn et al., 2004; Tolstoy, Hill & Tosi, 2009). McWilliam, Wallerstein & Mottini (2013) analysed three Sagittarius dSph stars and found low [/Fe], [Na/Fe], [Al/Fe], and [Cu/Fe] ratios along with a high [La/Y] ratio relative to the Galactic halo. The study of the Carina dSph by Venn et al. (2012) also found that the low-metallicity stars have slightly lower [Y/Eu] ratios (and slightly higher [Ba/Y] ratios) when compared to Galactic stars. The dSph of today are chemically different to the galaxies that merged early during the formation of the Galaxy.
The NS11 study found that the low- stars show a higher [Ba/Y] ratio than the high- stars. We also find differences for [Zr/Fe], [La/Zr], [/Fe], [/], [Y/Eu], [Ba/Eu], [/Eu], and [/Eu] between the two populations. These findings reveal that the low- population displays many chemical signatures also seen in dSph thereby supporting the accretion hypothesis from NS10.
We now turn our attention to the possible sources that could produce these abundance differences among the neutron-capture elements. Due to the slower rate of chemical evolution, it has been suggested that the dSph and low- population have been enriched from low-metallicity, low-mass AGB stars (NS11, Venn et al. 2012). Intermediate-mass AGB stars ( ) produce subsolar [Ba/Y] ratios (e.g., Karakas & Lattanzio, 2014), i.e., these objects cannot explain the behaviour of [Ba/Y] in the low- population. On the other hand, low-metallicity, low-mass AGB stars ( ) produce [Ba/Y] ratios above solar (e.g., Cristallo et al., 2011; Fishlock et al., 2014), and this is consistent with the low- population. The high [La/Zr] and [/] ratios for the low- population further support the hypothesis of enrichment from low-metallicity, low-mass AGBs in the low- populations as a result of the slower rate of chemical evolution (e.g., in low-mass AGBs, the first -process peak elements are bypassed in favour of second -process peak elements).
One issue with this scenario is that we would therefore expect the abundance of Y to be greater than (or equal to) Zr, i.e., [Y/Fe] [Zr/Fe] (e.g., Bisterzo et al. 2014; Trippella et al. 2016). The observations indicate otherwise, and this issue has also been identified in CEMP-s stars (Abate et al., 2015). The reason for the discrepancy between observations and theory is unknown. As noted in Section 3.1, while the abundances of Y and Zr follow each other, there may be a zero-point offset due to errors in the atomic data (e.g., values).
If low-metallicity, low-mass stars have contributed to chemical enrichment of the low- population, then we can place constraints on the enrichment timescales involved in the earliest dwarf galaxies. Models from Fishlock et al. (2014) predict that low-metallicity, low-mass ( ) stars have lifetimes between yr to yr.
We also present measurements of Eu; the -process is responsible for producing the majority of Eu in the Solar System (Sneden, Cowan & Gallino, 2008). The evolution of [Eu/Fe] for both Galactic stars and dSph stars generally follows [/Fe] (Venn et al., 2004; Tolstoy, Hill & Tosi, 2009) indicating a common origin between elements and Eu, most likely to be massive stars. If true, then we would expect the low- stars to have a lower [Eu/Fe] abundance than the high- stars at a given metallicity. However, there is some evidence that the low- stars have a higher [Eu/Fe] ratio than the high- stars, in contrast to our expectations. This separation is only observed at [Fe/H] and includes half the sample. When using the whole metallicity range, the KS test does not find a statistically significant separation between the two populations (see Table 5).
If the low- stars do have a higher Eu abundance than the high- stars at lower metallicities, it would suggest that the -process contributed more to the chemical evolution of the low- stars at a given metallicity. This is difficult to reconcile with chemical evolution models which support the idea that intense galactic winds remove Eu from a system (Lanfranchi, Matteucci & Cescutti, 2008). Another possibility is that the and Eu abundances are due to different initial mass functions rather than the addition of SNe Ia material (Ishimaru & Wanajo, 1999; Travaglio et al., 1999; Kobayashi et al., 2006). To determine if there is the possibility of a statistically significant separation, additional observations of Eu for the NS10 sample are required, particularly for stars with [Fe/H] .
We observe constant [Y/Eu] abundances ( dex) in the lower metallicity low- stars ( [Fe/H] ) suggesting that Y and Eu have a common origin or timescale for enrichment, most likely to be the -process, at these metallicities. The dSph chemical evolution models of Lanfranchi, Matteucci & Cescutti (2008) show constant [Y/Eu] ratios up to a [Fe/H] ratio of approximately . The ratio of [Y/Eu] then increases at higher metallicities due to the production of Y by AGB stars.
We observe lower [Y/Eu], [/Eu], and [/Eu] ratios in the low- stars compared to the high- stars with the separation becoming more noticeable at lower metallicities. The study of the Carina dSph by Venn et al. (2012) also found that the low-metallicity stars have slightly lower [Y/Eu] ratios (and slightly higher [Ba/Y] ratios) when compared to Galactic stars. Venn et al. (2012) concluded that these differences are a result of metal-poor AGB stars contributing to the chemical enrichment of Carina, and this may also apply to the low- population.
6 Conclusions
We found that the low- and high- populations of NS10 separate when using the abundance ratios of [Sc/Fe], [Zr/Fe], [La/Zr], [/Fe], [/], [Y/Eu], [Ba/Eu], [/Eu], and [/Eu]. These differences in chemical abundance ratios have only been detected using a differential analysis relative to a reference star with comparable stellar parameters to minimise the errors in abundance measurements. The separation observed in [La/Zr] between the low- and high- groups confirms the results of NS11 who find a separation in [Ba/Y], where Zr and Y are first -process peak elements and La and Ba are second -process peak elements.
The low abundance of [Y/Eu] found in the low- population compared to the high- population matches one of the chemical signatures of present-day dSph. Venn et al. (2004) discard the possibility that the Galactic halo could consist of low-mass dwarf galaxies that have continuously merged with the Galaxy as high [Ba/Y] and low [Y/Eu] ratios are not observed in Galactic halo stars. The idea of more massive mergers with the Galaxy was not ruled out by Venn et al. (2004). In addition, models of AGB stars are unable to explain the lower [/Eu] ratios observed in the low- stars compared to the high- stars.
The results presented here offer new and important observational evidence regarding the nature of the Galactic halo. It is apparent from the study of NS10 and NS11 that there are at least two populations in the Galactic halo, one that formed in-situ as well as one accreted from dwarf galaxies. The low [Y/Eu] abundances in dSph have been attributed to the contribution of metal-poor AGB stars (Venn et al., 2004). Low-metallicity AGB stars could also be responsible for the high [Ba/Y] abundances. Only with detailed chemical evolution models, along with measurements of additional -process elements beyond Eu, will there be a better understanding of the chemical enrichment of the earliest dwarf galaxies that merged with the Galactic halo. In particular, through a better understanding of the -process, we will be able to provide constraints on the formation site(s) of the -process.
7 Acknowledgements
We thank the referee, Maurizio Busso, for helpful comments. This work has been supported by the Australian Research Council (grants FT110100475 and FT140100554) and the European Union FP7 programme through ERC grant number 320360. JM thanks support by FAPESP (2012/24392-2 and 2014/18100-4). Funding for the Stellar Astrophysics Centre is provided by The Danish National Research Foundation (Grant DNRF106). Australian access to the Magellan Telescopes was supported through the National Collaborative Research Infrastructure Strategy of the Australian Federal Government.
References
- Abate et al. (2015) Abate C., Pols O. R., Izzard R. G., Karakas A. I., 2015, A&A, 581, A22
- Asplund et al. (2009) Asplund M., Grevesse N., Sauval A. J., Scott P., 2009, ARA&A, 47, 481
- Belokurov et al. (2006) Belokurov V. et al., 2006, ApJ, 642, L137
- Bernstein et al. (2003) Bernstein R., Shectman S. A., Gunnels S. M., Mochnacki S., Athey A. E., 2003, in Proc. SPIE, Vol. 4841, Instrument Design and Performance for Optical/Infrared Ground-based Telescopes, Iye M., Moorwood A. F. M., eds., pp. 1694–1704
- Bisterzo et al. (2014) Bisterzo S., Travaglio C., Gallino R., Wiescher M., Käppeler F., 2014, ApJ, 787, 10
- Bullock & Johnston (2005) Bullock J. S., Johnston K. V., 2005, ApJ, 635, 931
- Busso et al. (2001) Busso M., Gallino R., Lambert D. L., Travaglio C., Smith V. V., 2001, ApJ, 557, 802
- Busso, Gallino & Wasserburg (1999) Busso M., Gallino R., Wasserburg G. J., 1999, ARA&A, 37, 239
- Carney et al. (1997) Carney B. W., Wright J. S., Sneden C., Laird J. B., Aguilar L. A., Latham D. W., 1997, AJ, 114, 363
- Casey (2014) Casey A. R., 2014, PhD thesis, Australian National University
- Casey et al. (2014) Casey A. R. et al., 2014, MNRAS, 443, 828
- Castelli & Kurucz (2003) Castelli F., Kurucz R. L., 2003, in IAU Symposium, Vol. 210, Modelling of Stellar Atmospheres, Piskunov N., Weiss W. W., Gray D. F., eds., p. 20P
- Cristallo et al. (2011) Cristallo S. et al., 2011, ApJS, 197, 17
- Eggen, Lynden-Bell & Sandage (1962) Eggen O. J., Lynden-Bell D., Sandage A. R., 1962, ApJ, 136, 748
- Fishlock et al. (2014) Fishlock C. K., Karakas A. I., Lugaro M., Yong D., 2014, ApJ, 797, 44
- Frebel & Norris (2015) Frebel A., Norris J. E., 2015, ARA&A, 53, 631
- Frebel et al. (2010) Frebel A., Simon J. D., Geha M., Willman B., 2010, ApJ, 708, 560
- Fulbright (2002) Fulbright J. P., 2002, AJ, 123, 404
- Herwig (2005) Herwig F., 2005, ARA&A, 43, 435
- Ibata, Gilmore & Irwin (1994) Ibata R. A., Gilmore G., Irwin M. J., 1994, Nature, 370, 194
- Ishimaru & Wanajo (1999) Ishimaru Y., Wanajo S., 1999, ApJ, 511, L33
- Ivans et al. (2003) Ivans I. I., Sneden C., James C. R., Preston G. W., Fulbright J. P., Höflich P. A., Carney B. W., Wheeler J. C., 2003, ApJ, 592, 906
- Iwamoto et al. (1999) Iwamoto K., Brachwitz F., Nomoto K., Kishimoto N., Umeda H., Hix W. R., Thielemann F.-K., 1999, ApJS, 125, 439
- Karakas & Lattanzio (2014) Karakas A. I., Lattanzio J. C., 2014, PASA, 31, e030
- King (1997) King J. R., 1997, AJ, 113, 2302
- Kobayashi et al. (2006) Kobayashi C., Umeda H., Nomoto K., Tominaga N., Ohkubo T., 2006, ApJ, 653, 1145
- Lanfranchi, Matteucci & Cescutti (2008) Lanfranchi G. A., Matteucci F., Cescutti G., 2008, A&A, 481, 635
- Lawler, Bonvallet & Sneden (2001) Lawler J. E., Bonvallet G., Sneden C., 2001, ApJ, 556, 452
- Lawler et al. (2001) Lawler J. E., Wickliffe M. E., den Hartog E. A., Sneden C., 2001, ApJ, 563, 1075
- Lodders (2003) Lodders K., 2003, ApJ, 591, 1220
- Lugaro et al. (2012) Lugaro M., Karakas A. I., Stancliffe R. J., Rijs C., 2012, ApJ, 747, 2
- Matteucci & Greggio (1986) Matteucci F., Greggio L., 1986, A&A, 154, 279
- McWilliam (1997) McWilliam A., 1997, ARA&A, 35, 503
- McWilliam, Wallerstein & Mottini (2013) McWilliam A., Wallerstein G., Mottini M., 2013, ApJ, 778, 149
- Nissen (2013) Nissen P. E., 2013, Chemical Abundances as Population Tracers in Planets, Stars and Stellar Systems: Volume 5, Oswalt T. D., Gilmore G., eds., Springer Netherlands, Dordrecht, pp. 21–54
- Nissen (2016) Nissen P. E., 2016, A&A, 593, A65
- Nissen et al. (2000) Nissen P. E., Chen Y. Q., Schuster W. J., Zhao G., 2000, A&A, 353, 722
- Nissen & Schuster (2010) Nissen P. E., Schuster W. J., 2010, A&A, 511, L10
- Nissen & Schuster (2011) Nissen P. E., Schuster W. J., 2011, A&A, 530, A15
- Nomoto, Kobayashi & Tominaga (2013) Nomoto K., Kobayashi C., Tominaga N., 2013, ARA&A, 51, 457
- Norris et al. (2010) Norris J. E., Yong D., Gilmore G., Wyse R. F. G., 2010, ApJ, 711, 350
- Pillepich et al. (2014) Pillepich A. et al., 2014, MNRAS, 444, 237
- Preston & Sneden (2000) Preston G. W., Sneden C., 2000, AJ, 120, 1014
- Ramírez, Meléndez & Chanamé (2012) Ramírez I., Meléndez J., Chanamé J., 2012, ApJ, 757, 164
- Romano et al. (2010) Romano D., Karakas A. I., Tosi M., Matteucci F., 2010, A&A, 522, A32
- Searle & Zinn (1978) Searle L., Zinn R., 1978, ApJ, 225, 357
- Shetrone, Côté & Sargent (2001) Shetrone M. D., Côté P., Sargent W. L. W., 2001, ApJ, 548, 592
- Simmerer et al. (2004) Simmerer J., Sneden C., Cowan J. J., Collier J., Woolf V. M., Lawler J. E., 2004, ApJ, 617, 1091
- Sneden (1973) Sneden C., 1973, ApJ, 184, 839
- Sneden, Cowan & Gallino (2008) Sneden C., Cowan J. J., Gallino R., 2008, ARA&A, 46, 241
- Stephens & Boesgaard (2002) Stephens A., Boesgaard A. M., 2002, AJ, 123, 1647
- Tinsley (1979) Tinsley B. M., 1979, ApJ, 229, 1046
- Tolstoy, Hill & Tosi (2009) Tolstoy E., Hill V., Tosi M., 2009, ARA&A, 47, 371
- Tolstoy et al. (2003) Tolstoy E., Venn K. A., Shetrone M., Primas F., Hill V., Kaufer A., Szeifert T., 2003, AJ, 125, 707
- Travaglio et al. (1999) Travaglio C., Galli D., Gallino R., Busso M., Ferrini F., Straniero O., 1999, ApJ, 521, 691
- Trippella et al. (2016) Trippella O., Busso M., Palmerini S., Maiorca E., Nucci M. C., 2016, ApJ, 818, 125
- Venn et al. (2004) Venn K. A., Irwin M., Shetrone M. D., Tout C. A., Hill V., Tolstoy E., 2004, AJ, 128, 1177
- Venn et al. (2012) Venn K. A. et al., 2012, ApJ, 751, 102
- Wallerstein et al. (1997) Wallerstein G. et al., 1997, Reviews of Modern Physics, 69, 995
- Wheeler, Sneden & Truran (1989) Wheeler J. C., Sneden C., Truran, Jr. J. W., 1989, ARA&A, 27, 279
- Winckler et al. (2006) Winckler N., Dababneh S., Heil M., Käppeler F., Gallino R., Pignatari M., 2006, ApJ, 647, 685
- Woosley, Heger & Weaver (2002) Woosley S. E., Heger A., Weaver T. A., 2002, Reviews of Modern Physics, 74, 1015
- Woosley & Weaver (1995) Woosley S. E., Weaver T. A., 1995, ApJS, 101, 181
- Yong et al. (2005) Yong D., Grundahl F., Nissen P. E., Jensen H. R., Lambert D. L., 2005, A&A, 438, 875