Present Address: ]Department of Physics and Astronomy, Texas A&M University, College Station, TX 77840-4242, USA
Present Address: ]Helmholtz-Zentrum Berlin für Materialien und Energie GmbH, Hahn-Meitner Platz 1, D-14109 Berlin, Germany
Suppression of magnetic order in CaCo1.86As2 with Fe substitution: Magnetization, neutron diffraction, and x-ray diffraction studies of Ca(Co1-xFex)yAs2
Abstract
Magnetization, neutron diffraction, and high-energy x-ray diffraction results for Sn-flux grown single-crystal samples of Ca(Co1-xFex)yAs2, , , are presented and reveal that A-type antiferromagnetic order, with ordered moments lying along the axis, persists for . The antiferromagnetic order is smoothly suppressed with increasing , with both the ordered moment and Néel temperature linearly decreasing. Stripe-type antiferromagnetic order does not occur for , nor does ferromagnetic order for up to at least , and a smooth crossover from the collapsed-tetragonal (cT) phase of CaCo1.86As2 to the tetragonal (T) phase of CaFe2As2 occurs. These results suggest that hole doping CaCo1.86As2 has a less dramatic effect on the magnetism and structure than steric effects due to substituting Sr for Ca.
pacs:
74.70.Xa, 75.25.-j, 75.30.Kz, 61.50.KsI INTRODUCTION
Certain compounds with the ThCr2Si2-type body-centered-tetragonal structure are ideal systems for studying the interplay between structural, electronic, and magnetic degrees of freedom, and the occurrence of superconductivity Johnston_2010 ; Stewart_2011 . The parent compounds of the -Fe-pnictide superconductors [Fe2As2 ( Ca, Sr, Ba)] are prominent examples, which, upon cooling, undergo coupled structural and magnetic phase transitions from a paramagnetic tetragonal phase to an antiferromagnetic (AFM) phase with collinear stripe-type magnetic order and an orthorhombic lattice Canfield_2010 ; Lynn_2009 ; Paglione_2010 . The stripe-type AFM order is itinerant, with an ordered Fe moment of and an AFM propagation vector , which angle-resolved photoemission spectroscopy and band structure calculations show is consistent with nesting between hole- and electron-type Fermi-surface pockets Johnston_2010 ; Stewart_2011 ; Canfield_2010 ; Lynn_2009 ; Paglione_2010 . Studies on compounds in which Fe is substituted by other transition metals, such as Co Sefat_2008 ; Ni_2008 , Ni Li_2009 , or Cu Canfield_2009 , show that the structural and magnetic phase transitions become suppressed at high enough levels of doping, and that superconductivity occurs over a limited range of doping.
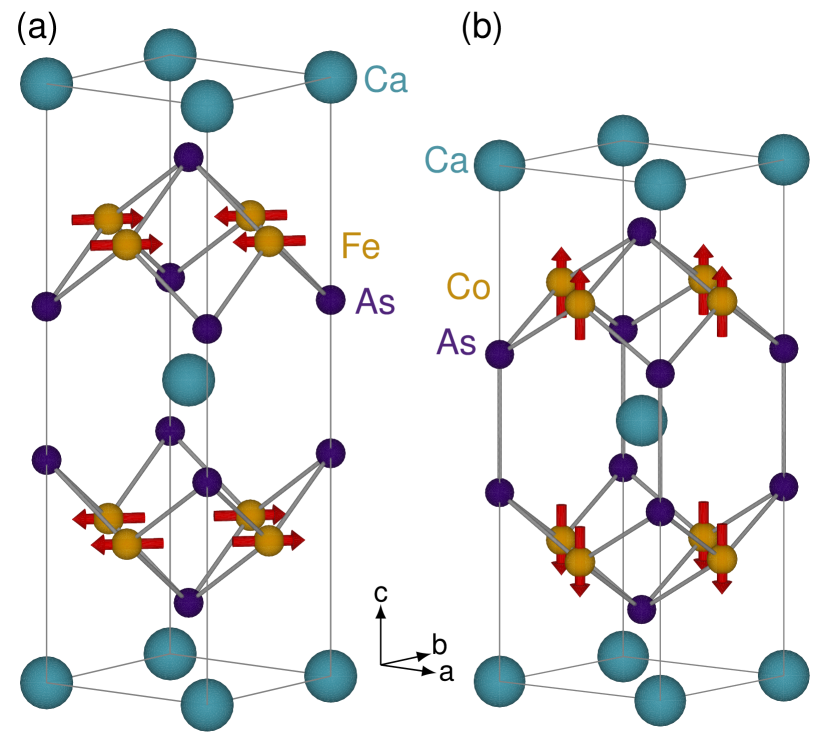
The parent -compound CaFe2As2 undergoes a first-order transition from its paramagnetic tetragonal phase to its stripe-type AFM orthorhombic phase at a Néel temperature of K [see Fig. 1(a)] Goldman_2008 . Data for samples synthesized using Sn flux show that to Co substitution for Fe suppresses the magnetic and structural transitions, to Co substitution causes superconductivity to first occur, and to Co substitution subsequently suppresses superconductivity Harnagea_2011 ; Hu_2012 . The variation in values for the level of Co substitution necessary for the various phase transitions is likely due to uncertainty in the exact amount of Co in the compounds Hu_2012 , and the various amounts of strain induced by different synthesis procedures Ran_2012 ; Budko_2013 ; Ran_2014 .
Under modest applied pressure ( GPa at K), CaFe2As2 undergoes a first-order structural phase transition from its ambient-pressure tetragonal (T) or orthorhombic phase to a collapsed-tetragonal (cT) phase characterized by an reduction in the ratio of its lattice parameters , a reduction in , and a decrease in its unit-cell volume Kreyssig_2008 ; Goldman_2009 . In addition, the transition quenches the Fe magnetic moment, and data show no evidence for magnetic order or AFM spin fluctuations occurring in the cT phase Pratt_2009 ; Soh_2013 . The quenching of the Fe moment is understood in terms of the effective valence of Fe changing from Fe+2 to Fe+1 due to As-As bonds present in the cT phase Anand_2014 ; Quirinale_2013 ; Hoffman_1985 ; Reehuis_1990 ; Reehuis_1998 ; Anand_2012 .
CaCo1.86As2 is the complementary version of CaFe2As2 in which Fe is replaced by Co. The compound has the same tetragonal ThCr2Si2 structure as CaFe2As2, but exists away from the ideal stoichiometry due to a vacancy of the Co sites Quirinale_2013 ; Anand_2014 . The ratio of its lattice parameters is Pfisterer_1980 ; Pfisterer_1983 , which is comparable to the value for CaFe2As2 in the cT phase, Kreyssig_2008 and indicates that CaCo1.86As2 exists in the cT phase at ambient pressure Quirinale_2013 ; Anand_2014 . Data from neutron diffraction experiments on Sn-flux grown single-crystal samples show that the compound has A-type collinear itinerant AFM order below K with the ordered moments lying along the axis Quirinale_2013 . On the other hand, thermodynamic and resistance data for CoAs-flux grown samples indicate that the AFM phase transition occurs at either K Cheng_2012 or K Ying_2012 . Figure 1(b) shows the A-type AFM structure, which consists of Co spins ordered ferromagnetically (FM) within the plane and aligned AFM along . Magnetization results estimate that the size of the ordered moment in Sn-flux grown samples is Co Anand_2014 , which is consistent with previous neutron diffraction results that place an upper limit of Co on the ordered moment Quirinale_2013 .
Based on the cT structure of CaCo1.86As2, and the presence of magnetic Co+1, it is, perhaps, not surprising that the compound has magnetic order at low temperature Anand_2014 . On the other hand, both BaCo2As2 and SrCo2As2 have T structures at ambient pressure and do not magnetically order down to at least K. Rather, their magnetic susceptibilities have been described as Stoner-enhanced paramagnetism lying proximate to a quantum-critical point Sefat_2009 ; Pandey_2013 , however, studies of K-doped BaCo2As2 do not support this scenario Anand_2014b . Additionally, inelastic neutron scattering data for SrCo2As2 show the presence of AFM spin fluctuations peaked at wavevectors corresponding to the stripe-type AFM order present in Fe2As2 ( Ca, Sr, Ba) Jayasekara_2013 , and nuclear magnetic resonance experiments find that AFM and FM spin correlations coexist in the compound Wiecki_2015 . Thus, it is prudent to study how the lattice and magnetism change in CaCo1.86As2 as either Fe is substituted for Co, or Sr/Ba is substituted for Ca.
Here, we report results from magnetization, neutron diffraction, and x-ray diffraction experiments on the series of compounds Ca(Co1-xFex)yAs2, , , that elucidate changes to the magnetic order and lattice as is increased. We find that A-type AFM order, with the ordered moments lying along the axis, persists for , and that both and the ordered moment are linearly suppressed with increasing . No dramatic changes to the lattice parameters are observed at , and a smooth crossover from the cT to T phase occurs at higher . We compare our results with those for other compounds related to the -Fe-pnictide superconductors, and discuss the relationship between changes in the lattice and magnetic order.
II EXPERIMENT
Shiny plate-like single crystals of Ca(Co1-xFex)yAs2 (, ) were synthesized by Sn-flux solution growth using Ca (), Co (), Fe () and As () from Alfa Aesar. Growth was initiated with stoichiometric Ca(Co1-xFex)2As2 (, , , , , , , , , , , , ) and Sn in a sample to flux molar ratio. Starting materials were placed in alumina crucibles and sealed in quartz tubes under atm of Ar. After prereaction at °C for hours, the materials were heated to °C at a rate of °Chour, held there for 20 hours, and then cooled to °C at °Chour. Crystals were separated from the flux by decanting with a centrifuge at °C. Some single crystals were powdered for in-house x-ray diffraction measurements, and all of the samples were found to have the same body-centered tetragonal space group () as the parent compound Quirinale_2013 .
The magnetization was measured down to K and under applied magnetic fields of to T using a Quantum Design, Inc., Magnetic Property Measurement System in order to screen for a magnetic transition and determine any ordering temperatures. Neutron diffraction experiments were subsequently carried out on selected samples using the HB-1A Fixed-Incident-Energy Triple-Axis Spectrometer at the High Flux Isotope Reactor, Oak Ridge National Laboratory. Measurements were made using a fixed incident neutron energy of meV, and collimators with divergences of --- were inserted before the pyrolytic graphite (PG) monochromator, between the monochromator and sample, between the sample and PG analyzer, and between the analyzer and detector, respectively. Two PG filters were placed before the sample to suppress higher order harmonics present in the incident beam. The samples were mounted with their reciprocal-lattice planes coincident with the scattering plane, and were cooled down using either a He closed-cycle or an orange-type cryostat. The masses of the samples range from to mg. In this paper, momentum transfers are expressed in reciprocal-lattice units.
High-energy x-ray diffraction (HE-XRD) experiments were performed at end station -ID-D at the Advanced Photon Source, Argonne National Laboratory, using an x-ray energy of keV. Single-crystal samples were mounted on the cold finger of a He closed-cycle cryostat and cooled down to K, and He exchange gas was used to ensure thermal equilibrium. The cryostat was mounted to the sample stage of a -circle diffractometer, and either a MAR or a Pixirad- area detector was used to measure the diffracted x-rays transmitted through the sample. The MAR image plate was positioned with its center aligned to the incident beam and was determined to be set back from the sample position by m through measurement of a CeO2 standard from the National Institute of Standards and Technology. In this configuration, the MAR recorded a diffraction pattern spanning a scattering angle of . The detector was operated with a pixel size of , and diffraction patterns of the reciprocal-lattice plane were recorded using a incident beam while tilting the sample along two rocking angles. Detailed studies of the temperature dependencies of the and Bragg reflections were recorded using the Pixirad-. For these measurements, the sample was rocked around an axis perpendicular to the incoming beam. The detection element of the Pixirad- is comprised of a hexagonal array of pixels with a spacing of m, and the incoming beam had a size of .
III Results
III.1 Composition Analysis
Previous x-ray diffraction, neutron diffraction, and wavelength-dispersive x-ray spectroscopy (WDS) results for Sn-flux grown single-crystal samples of CaCo2As2 show that of the Co sites are vacant, resulting in a stoichiometry of CaCo1.86(2)As2 Quirinale_2013 . To determine the chemical compositions of our Ca(Co1-xFex)yAs2 samples, we performed either energy-dispersive x-ray spectroscopy (EDS) or WDS measurements. Table 1 lists the results, and from here on we will refer to samples by their values for .
III.2 Magnetic Susceptibility
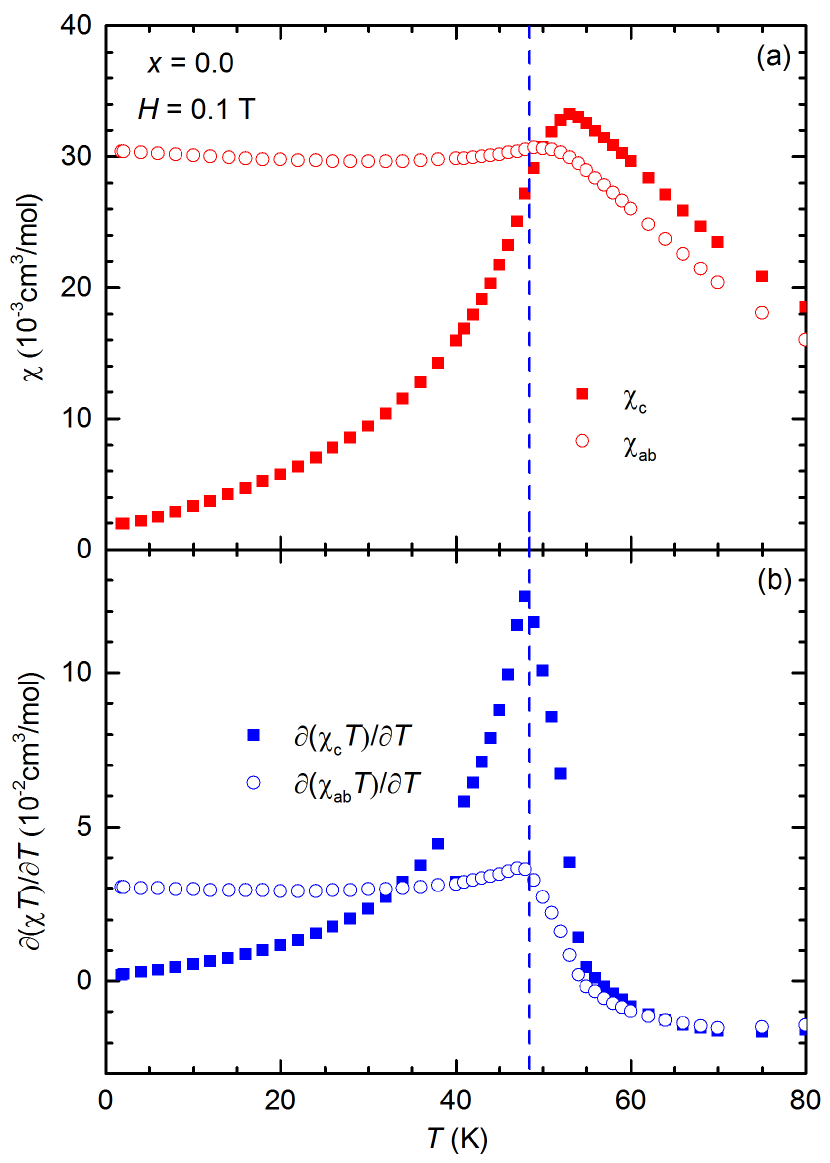
Figure 2(a) shows the magnetic susceptibility versus temperature for , from measurements made in the basal plane () and along c (). Figure 2(b) shows plots of and . From these plots, we use Fisher’s method Fisher_1962 and determine that K for , which is slightly lower than the value of K determined from previous neutron diffraction data Quirinale_2013 . Note that may be readily determined using either or .
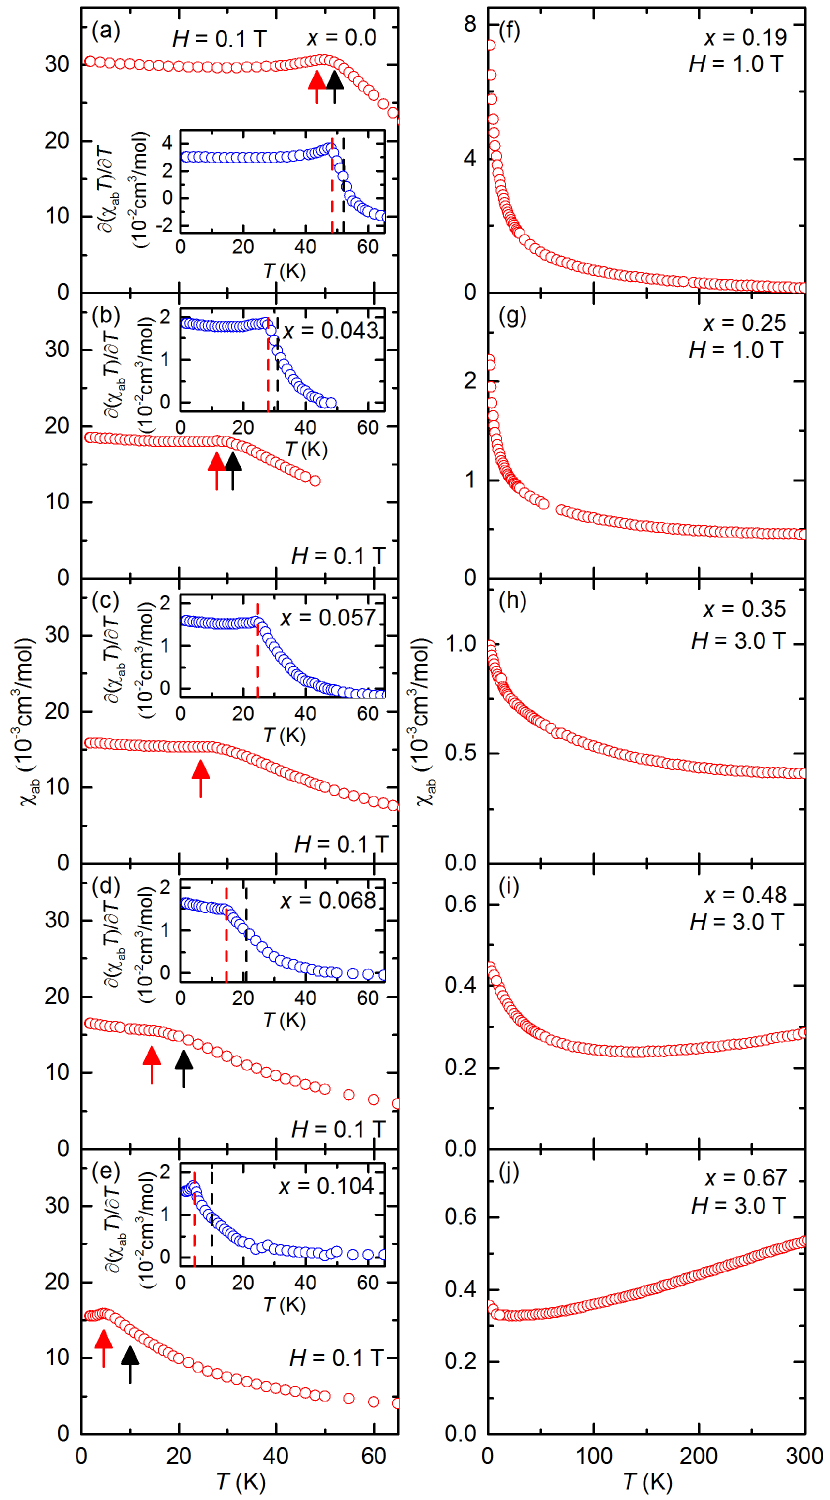
Figure 3 shows for the , , , , , , , , and single-crystal samples, and the insets show corresponding plots of for samples which have an AFM transition. The red arrows in Figs. 3(a)–3(e) denote the values of determined from using Fisher’s method, whereas the black arrows indicate the the values determined from the neutron diffraction data presented below. Figures 3(f)–3(j) reveal no features corresponding to a magnetic phase transition, but do show an upturn in at low temperature. It is currently unclear if the upturn is due to magnetic impurities or intrinsic, and future investigations of the upturn are warranted Jia_2010 ; Jia_2011 . Finally, none of the panels in Fig. 3 show signs of diamagnetic behavior indicative of bulk superconductivity.
III.3 Neutron Diffraction
Neutron diffraction measurements were performed on single-crystal samples with , , , , , and in order to determine the microscopic details of any magnetic order present at low temperature. For a crystal possessing the body-centered-tetragonal space group , and oriented with its plane coincident with the scattering plane, the relevant reflection conditions for Bragg peaks due to the chemical lattice are , even. The A-type AFM order in the compound breaks the body-centered symmetry, yielding additional Bragg peaks at , odd, and is characterized by an AFM propagation vector Quirinale_2013 . The direction of the ordered moment is found by using the fact that neutron scattering is insensitive to a moment lying along the scattering vector Q. Hence, since the ordered moment for the compound lies along the axis, magnetic Bragg peaks at , odd, reciprocal-lattice positions are absent.

Figures 4(a) and 4(b) show data for the sample from and - scans (i.e. approximately transverse and longitudinal scans), respectively, through the Bragg peak at K. Figures 4(c) and 4(d) show similar data for the Bragg peak. The smooth, sharp peaks in Figs. 4(a) and 4(c) have full widths at half maximum (FWHM), determined from fits to Gaussian line shapes, of ° and °, respectively. In Figs. 4(b) and 4(d), the FWHM of the peaks are ° and °, respectively, and the sharp peaks illustrate the quality of the single-crystal samples, since, presumably, the values of the lattice parameters should change with . The FWHM values listed above are typical for all of the samples used for the neutron diffraction measurements.
Figures 4(e) and 4(f) show data from and - scans, respectively, through the magnetic Bragg peak, and Figs. 4(g) and 4(h) show similar data for the magnetic Bragg peak. Both of these peaks are due to the previously determined A-type AFM order Quirinale_2013 . We determine a value for the ordered moment by comparing the integrated intensities of the , , and magnetic Bragg peaks and their calculated structure factors to the corresponding values for the , , , , , and structural Bragg peaks. We find that the ordered moment is Co at K, which is consistent with the value of Co from magnetization measurements Anand_2014 and the upper limit of Co from previous neutron diffraction results Quirinale_2013 . (The data for this calculation along with those for other are shown in Fig. 12.)
Next, we present results from experiments on an sample, and give in detail the procedures used to obtain the data and perform the analysis. The methodology presented is the same one used for the rest of the samples measured by neutron diffraction.
Figures 5(a) and 5(b) show data for from - scans through the and Bragg peaks at K. The peaks have FWHM of ° and °, respectively. The widths are likely resolution limited, since the tightest collimator placed in the neutron beam has a divergence of . Figures 5(c) and 5(d) show data from and - scans through the position and Figs. 5(e) and 5(f) show data from similar scans through the position at K. Analogous to the compound, Bragg peaks are present at the and reciprocal-lattice positions, which indicates that the body-centered symmetry present at room temperature is broken at low temperature. The FWHM of the peaks in Figs. 5(d) and 5(f) are ° and °, respectively, which are comparable to the values found for the and Bragg peaks, and indicate that the peaks are due to long-range order.
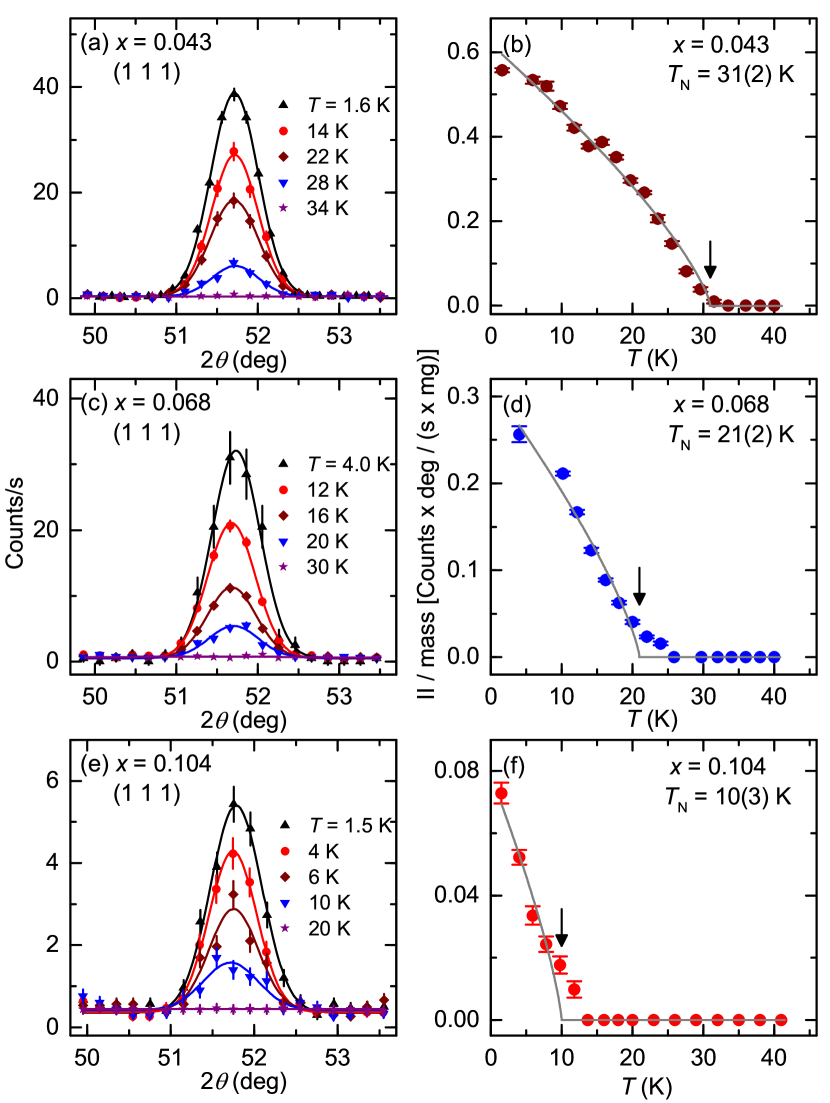
Data for from - scans through the Bragg peak at different temperatures are plotted in Fig. 6(c), and Fig. 6(d) shows the temperature evolution of the peak’s integrated intensity, which is determined by fitting the peaks in Fig. 6(c) to Gaussian line shapes. The values for the integrated intensity have been normalized by the sample mass. Upon cooling, the peak appears below K, which is similar to the temperature at which deviates from its high-temperature behavior [see Fig. 3(d)]. Hence, we associate the appearance of the peak with the development of magnetic order. The integrated intensity versus temperature curve has a high-temperature tail, which is likely due to short-range magnetic correlations associated with the phase transition, but compositional disorder within the samples may also contribute. Similar shaped curves are observed for other compounds related to the Fe-pnictide superconductors, such as Ba(Fe1-xMnx)2As2 Kim_2010 . By extrapolating the expected behavior of the magnetic order parameter from low temperature, we determine that K. Figures 6(a), 6(b), 6(e), and 6(f) show similar data for and , which will be discussed later.

Whereas measurements of many Bragg peaks are necessary to uniquely determine a magnetic structure, the presence of both the and Bragg peaks for suggests that the magnetic structure is similar to the A-type AFM order in . To test this, we made various diffraction measurements: () to determine if other magnetic Bragg peaks consistent with A-type AFM order exist, () to determine if the ordered moment lies solely along the axis, and () to search for scattering consistent with the development of the stripe-type AFM order in CaFe2As2 Goldman_2009 ; Kreyssig_2008 and other compounds related to the Fe-pnictide superconductors Johnston_2010 ; Canfield_2010 ; Lynn_2009 ; Paglione_2010 . Total-energy calculations for SrCo2As2 also indicate that a FM ground state lies in close proximity to stripe-type AFM, A-type AFM, and nonmagnetic ground states Jayasekara_2015 . Therefore, we also looked for evidence indicating that FM order develops with increasing . Regarding point (), a Bragg peak also occurs at the position at K, which is another position consistent with the A-type order in . The peak is absent at K.
In regards to point (), data for from longitudinal scans through the and positions are shown in Figs. 7(a) and 7(b), respectively. Whereas the tail of the peak is visible in Fig. 7(a) at both and K, there is no evidence of a Bragg peak at . Similarly, no Bragg peak is seen in Fig. 7(b) at K for the position. The existence of these peaks would be consistent with a component of the ordered magnetic moment lying in the plane. Hence, since the peaks are absent, the ordered moment lies along the axis.
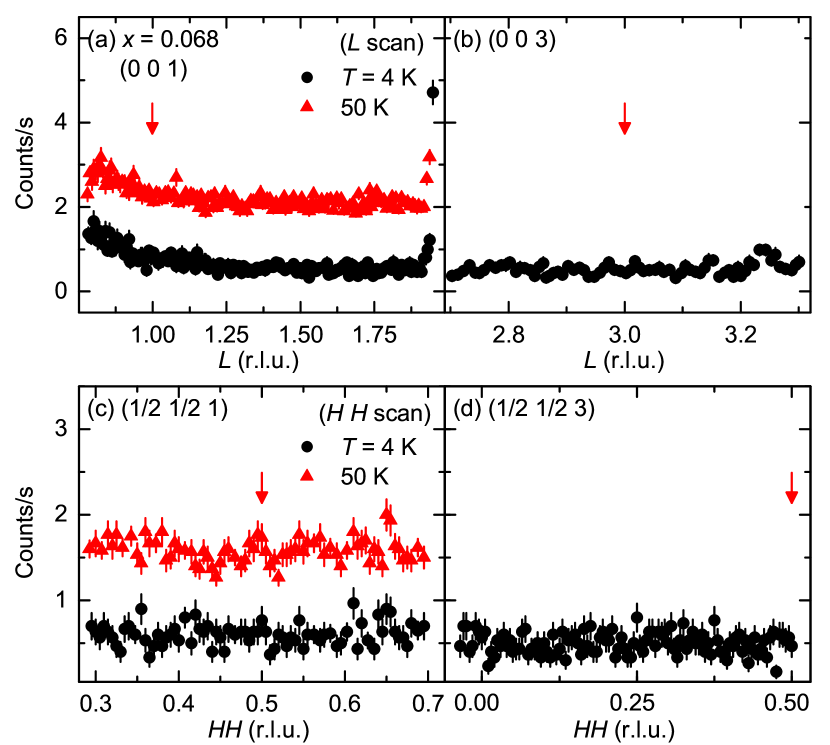
Addressing point (3), Figs. 7(c) and 7(d) show data for from scans through the and reciprocal-lattice positions, respectively, which correspond to . Magnetic Bragg peaks do not occur at either position, which indicates that stripe-type AFM order similar to that in CaFe2As2 does not occur at K. In addition, the absence of any magnetic Bragg peaks in Fig. 7 rules out the existence of incommensurate long-range magnetic order with a propagation vector consistent with the investigated values of Q.
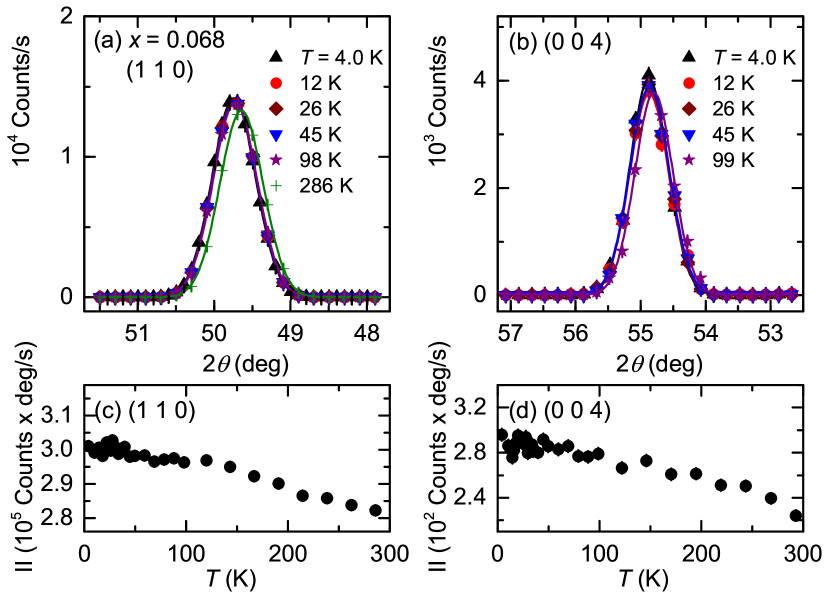
Finally, for , we examine the temperature dependence of certain Bragg peaks with indices , even, in order to look for evidence of FM order. Figure 8 shows data from - scans through the [Fig. 8(a)] and [Fig. 8(b)] Bragg peaks at various temperatures. Due to the reciprocal-lattice positions of the peaks, and the fact that neutron diffraction is sensitive to a magnetic moment’s component perpendicular to Q, the measurements cover the possible development of an ordered FM moment with components in either the plane or along the axis. The temperature evolution of the integrated intensities of the and Bragg peaks are shown in Figs. 8(c) and 8(d), respectively. Both datasets vary smoothly with , and slightly increase with decreasing temperature, likely due to the temperature dependence of their Debye-Waller factors. Nevertheless, there are no sharp changes to the shapes nor in the integrated intensities of both Bragg peaks as is lowered, and we find no significant indication for the development of FM order down to K.
Similar data to those presented in Figs. 4–8 were recorded for the and samples, and the salient data are shown in Figs. 9 and 10. Figures 9(a) and 9(b) show data from - scans through the reciprocal-lattice positions for and , respectively, and illustrate that peaks are found for both samples which are consistent with A-type AFM order. The FWHM of the peaks are ° and ° for and , respectively, which indicate that the peaks correspond to long-range magnetic order. Figure 9(c) shows data from a longitudinal scan through the position for the sample and Fig. 9(d) shows data through the position for . The absence of Bragg peaks in these data means that the ordered moment lies along the axis for both values of . Finally, Figs. 9(e) and 9(f) show data from scans through the positions for and , respectively. No peak is seen for either value of , which illustrates that the stripe-type AFM order present in CaFe2As2 does not occur in these samples. Similarly, Fig. 10 shows that the and Bragg peaks do not change between K and base temperature, which indicates that there is also no significant evidence for the development of FM order in these samples.
The temperature evolution of the magnetic Bragg peaks and the magnetic order parameters for the and samples are shown in Figs. 6(a), 6(b), 6(e), and 6(f). Using the same procedure described above to determine for , we find that K for and K for . These values are similar to those indicated by the red arrows in Figs. 3(b) and 3(e), and we conclude that decreases with increasing . In addition, since the ordinates of Figs. 6(b), 6(d), and 6(f) give the integrated intensity of the peak normalized by the sample mass, and since the integrated intensity is proportional to the square of the ordered magnetic moment, the decrease in the base temperature values of the normalized integrated intensity with increasing indicates that the ordered moment is suppressed as Fe is substituted for Co. We will return to these points with a subsequent figure.
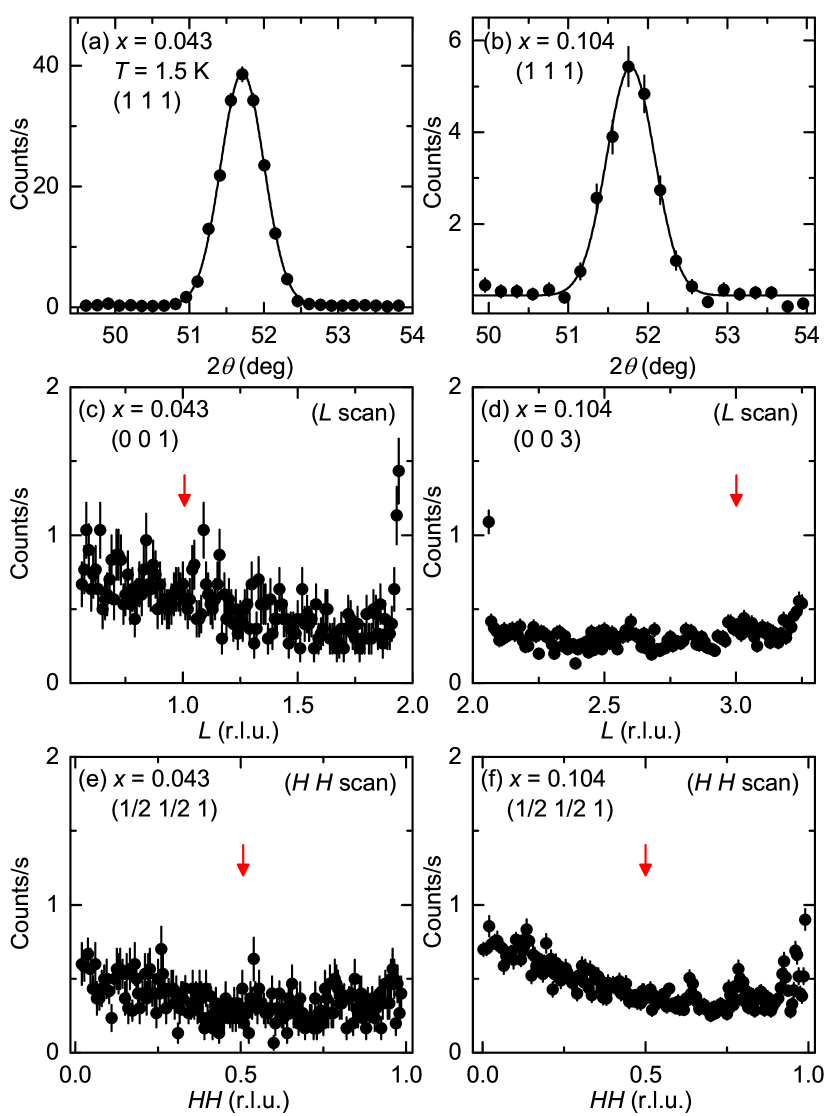
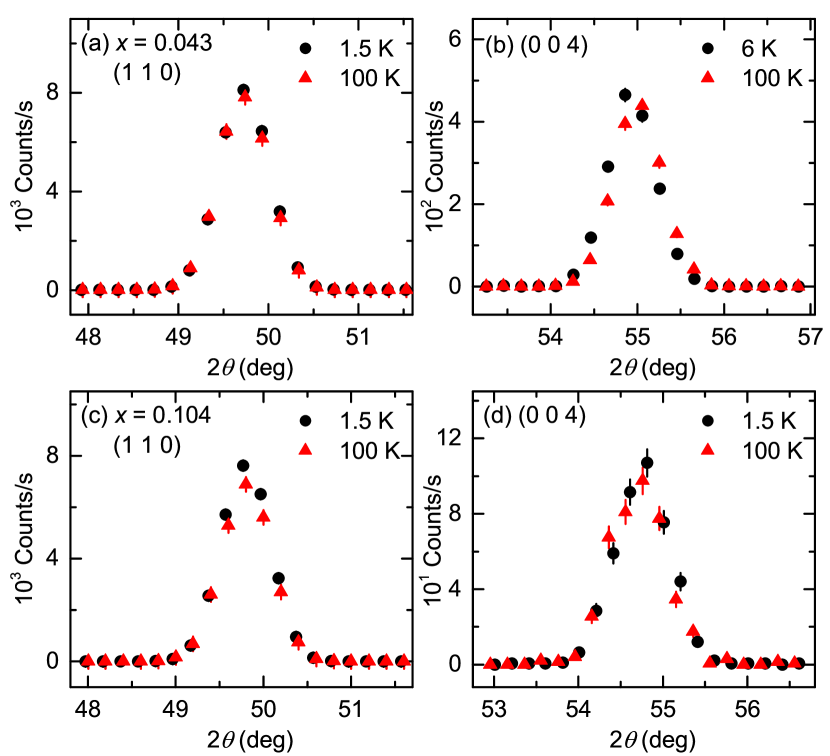
Figure 11 shows data for and from scans performed at K through reciprocal-lattice positions corresponding either to A-type or stripe-type order. Data for the position are shown in Fig. 11(a) for , and in Fig. 11(b) for . No magnetic Bragg peaks occur in these data. Similarly, Figs. 11(c) and 11(d) show that the peak is absent for both values of . This indicates that the A-type AFM order found for lower values of is absent, at least within the sensitivity of our measurement. Next, Figs. 11(e) and 11(f) show data for the position for and , respectively, and Figs. 11(g) and 11(h) show data for the position for and , respectively. No Bragg peak is found in any of these figures, which indicates that the stripe-type AFM order present for is absent for and . We can roughly estimate the minimum ordered moment detectable by our measurements by using the data for , from which we find that an ordered moment of Co corresponds to a height of the magnetic Bragg peak of counts/s. Thus, a peak with a height of countss, which is an estimate for the ability to distinguish a peak in the data in Fig. 11, would correspond to an ordered moment of Co.

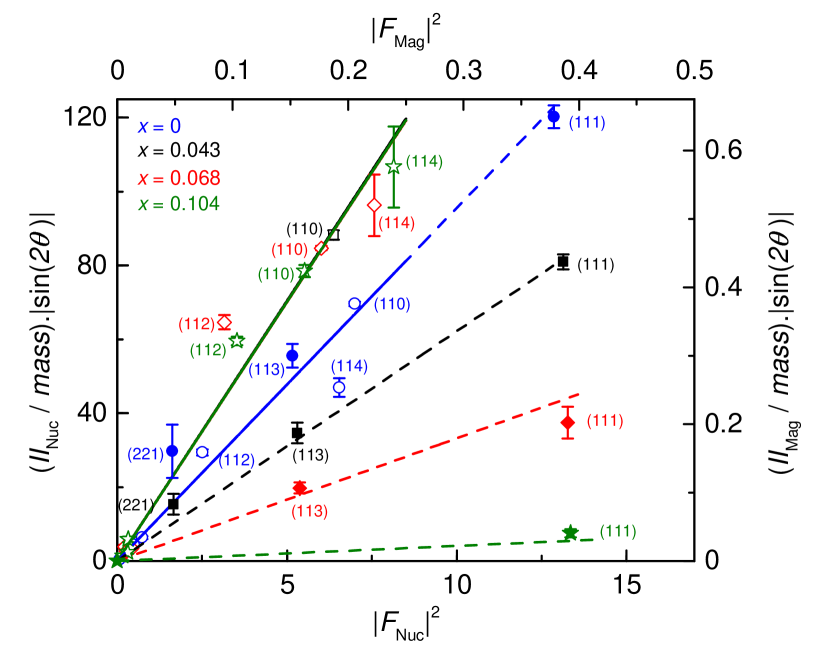
The integrated intensities of the measured structural and magnetic Bragg peaks normalized by the appropriate sample mass and Lorentz factor are plotted versus the squares of their respective structure factors for , , , and in Fig. 12. For the magnetic structure factor calculation, it has been assumed that A-type AFM order occurs with moments of lying along the axis. The solid and dashed lines show linear fits to the structural and magnetic data, respectively. For a given sample, the ratio of the slope of the line for the magnetic data to the slope of the line for the structural data equals the square of the ordered moment. Thus, the decrease in slope with increasing for the magnetic data illustrates the decrease in with increasing . Note that there are several points at for the magnetic data which correspond to the magnetic structure factors for the and positions. Despite the few number of magnetic Bragg peaks measured for each sample, the fits show that the data are consistent with A-type AFM order with the ordered moments lying along c. The rise in slope of the fits to the structural data between and simply reflects the fact that the neutron scattering length for Fe is larger than the scattering length for Co.
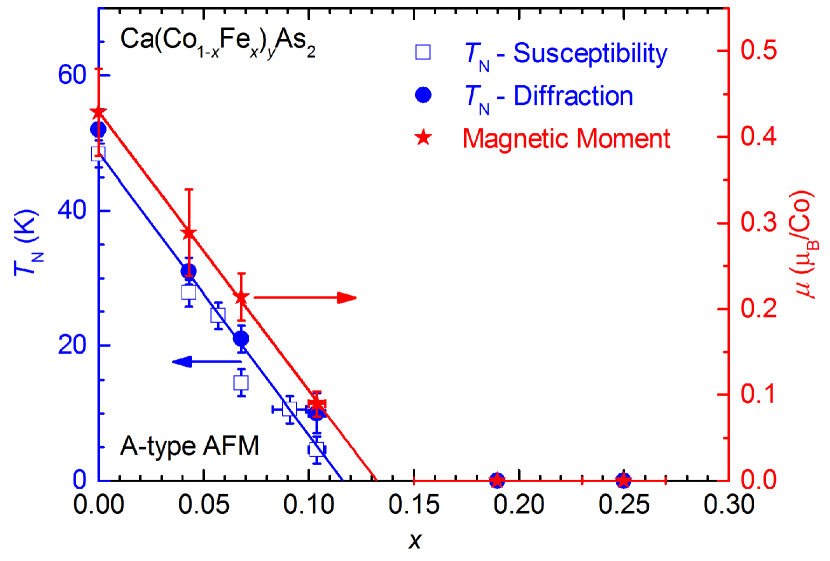
Figure 13 summarizes the results from the neutron diffraction and magnetic susceptibility experiments. The left ordinate gives , and the right ordinate gives the value for . Both and decrease with increasing in similar fashions. A linear fit to the non-zero values for determined from both the neutron diffraction and susceptibility data gives a slope of K and an intercept of . A similar fit to yields Co and an intercept of . The fits are shown in Fig. 13 as blue and red lines, respectively. From the mean of the horizontal intercepts, we find that the A-type order is completely suppressed at .
III.4 X-ray Diffraction
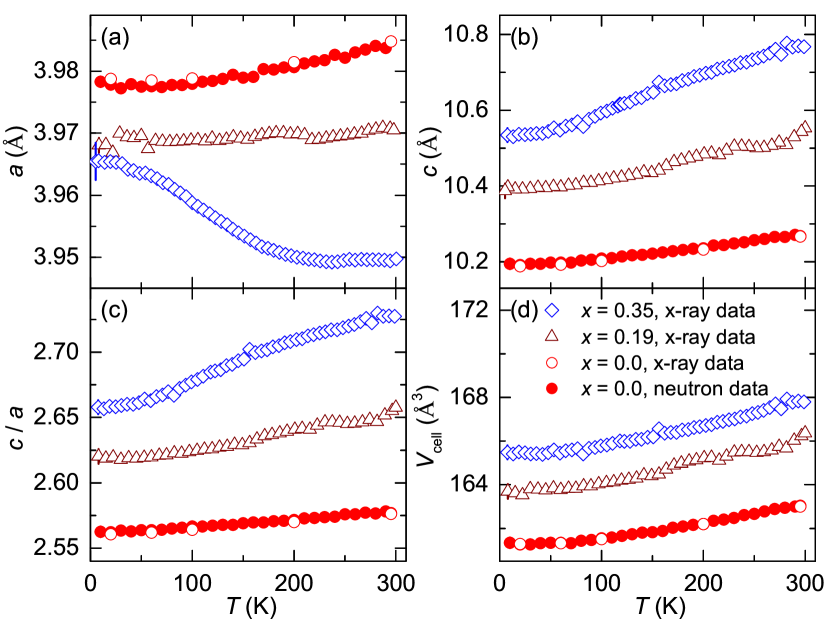
Figure 14 shows the temperature dependence of the lattice parameters for samples with , , and . In Fig. 14(a), increases between and K by only for , remains virtually unchanged for , and decreases by for . On the other hand, Fig. 14(b) shows that increases with increasing for all three samples: for , for , and for . The concomitant changes of and with increasing temperature are shown in Figs. 14(c) and 14(d), respectively. Both quantities increase with increasing due to the much larger change in than .
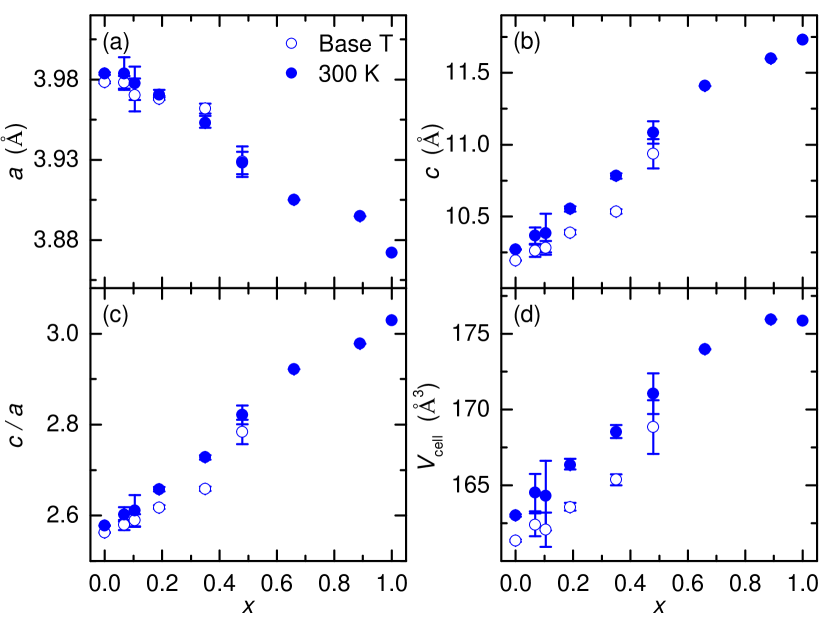
Figure 15 shows , , , and at K and base temperature ( K) for , and at K for . For each temperature, monotonically decreases with increasing whereas , , and smoothly increase. The limited data taken at base temperature may show a sharp change in between and , but a firm conclusion cannot be drawn from the data. Nevertheless, there is no obvious feature at base-temperature which would corresponds to the disappearance of A-type AFM order at , and a smooth crossover between the cT and T phases occurs with increasing . This is somewhat surprising considering that a pressure-induced first-order transition between the T and cT phases occurs in CaFe2As2 Kreyssig_2008 ; Goldman_2008 . On the other hand, substituting Fe for Co changes not only the chemical structure of the compound, but also the electronic band structure. We further discuss this point below.
IV Discussion
The substitution of Fe for Co in CaCo1.86As2 dopes holes in to the compound, whereas the substitution of Co for Fe in CaFe2As2 dopes electrons. In a rigid-band approximation, such doping shifts the Fermi energy and changes the partial density of states (DOS) at the Fermi level of the bands of the transition metals, potentially affecting the magnetism. For BaFe2As2 this scheme has been ruled out, because data for Ba(Fe)2As2, in which Co, Ni, Cu, or Co/Cu mixtures were systematically substituted for Fe, show that the positions of both the orthorhombic and AFM phase lines scale with , not the number of electrons added via doping Canfield_2010 ; Canfield_2009 . On the other hand, for up to at least , changes with the number of extra electrons added per transition metal site in a similar manner for each type of transition metal used. For Ba(Fe1-xCox)2As2, ARPES data also rule out a strict rigid-band approximation scenario, since the Fermi-surface hole pockets present for values of corresponding to AFM order vanish at a Lifshitz transition tied to the value of for which superconductivity first occurs Liu_2010 .
The changes between the T and cT phases for compounds such as CaFe2As2, with general formula and the ThCr2Si2 structure, may be described in terms of the valence and spacing of the and layers Hoffman_1985 . In such a description, compounds in the T phase have layers with valence assignments of and ()-2, and the distance separating two layers in a unit cell is great enough that essentially no bonding occurs between them. In the cT phase, the interlayer spacing decreases to an amount comparable to the distance necessary for a covalent bond to form between two anions. This results in interlayer bonds developing along between anions in adjacent layers. The formation of the interlayer - bonds has a dramatic effect on the DOS and position of the Fermi level. In terms of the formal charge associated with the anions, the - bond results in a [-]-4 polyanion, as opposed to the separate anions existing in the T phase Hoffman_1985 . For the compounds Co2P2 ( Ca, Sr, La, Ce, Pr, Nd, Sm, or Eu), which have the ThCr2Si2 structure, the distance between interlayer P cations correlates with the effective valence of the Co cations, and the valence of the Co cations affects both the structure of any magnetic order present at low temperatures and the value of the magnetic moment Reehuis_1998 .
The formation of bonds between layers can explain the quenching of the Fe moment in the cT phase of CaFe2As2 Goldman_2008 ; Yildrim_2009 , the consequences of modifications to the Fermi-surface of BaFe2As2 due to structural distortions Kimber_2009 , as well as the magnetic phase diagrams for Sr1-xCaxCo2P2 Jia_2009 and Ca1-xSrxCo2As2 Ying_2013 . For the case of CaFe2As2, the pressure-induced T-cT transition decreases the distance between Fe2As2 layers to a value consistent with the formation of an As-As bond, and band structure calculations for the cT phase show that a dramatically lower DOS at the Fermi level occurs along with a shift in the Fe and bands to lower energies. The calculated generalized magnetic susceptibility indicates that the Fe DOS at the Fermi level in the cT phase is insufficient to induce magnetic order Goldman_2009 .
We next compare our results to those for Ca1-xSrxCo2As2, in which substitution of Sr for Ca is performed. Though such doping is isoelectronic, Sr has a larger radius than Ca, which may induce steric effects. For this series of compounds, several magnetic states occur: the expected A-type order for , FM order with the ordered moments along the axis for , another AFM order phase with A-type order and the moments lying in the plane for , and no magnetic order for Ying_2013 . A deviation in at , from its smooth increase with increasing , correlates with the disappearance of magnetic order and is assigned as the value at which the cT-T transition occurs Ying_2013 . A study of the compounds Ca1-xSrxCo2P2 gives a similar phase diagram, consisting of multiple magnetic states, and a T-cT phase transition at . In this case, the T-cT transition changes both the Co-Co and Co-P-Co bond lengths and also correlates with a transition from a nearly-ferromagnetic Fermi liquid to AFM order Jia_2009 . For both compounds, transitions between the magnetically ordered ground states are also tied to changes in the lattice parameters Ying_2013 ; Jia_2009 .
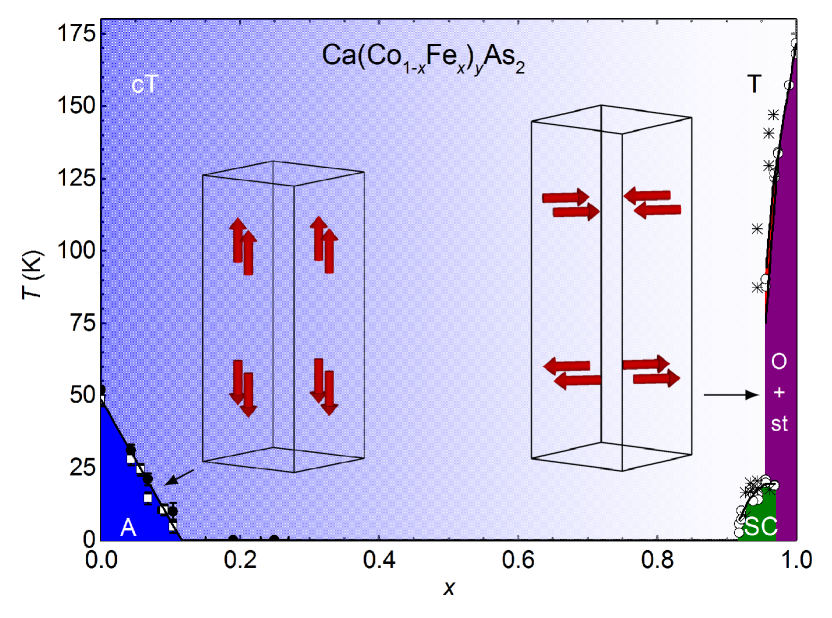
Figure 16 shows the phase diagram for Ca(Co1-xFex)yAs2 determined from this work and from data given in Refs. Harnagea_2011, and Hu_2012, . In contrast to the results for Ca1-xSrxCo2As2 and Ca1-xSrxCo2P2, which show that substitution of Sr for Ca causes multiple magnetic ground states and a clear cT-T transition accompanied by the suppression of magnetic order, our results show a monotonic suppression of A-type AFM order and a smooth crossover from the cT to the T phases. This suggests that hole doping CaCo1.86As2 has a less dramatic effect than any steric effects due to doping Sr for Ca, and that it suppresses the A-type magnetic order in the absence of sharp changes to the lattice parameters or an abrupt cT-T phase transition.
In addition to the effects of hole doping, the consequences of decreasing the vacancy of the Co site with increasing need to be considered. This is especially important in light of the facts that samples synthesized using CoAs self flux have been reported as being either almost stoichiometric Ying_2013 or possessing vacancy of the Co site Zhang_2015 . Results from previous electronic structure calculations for CaCo1.88As2 and CaCo2As2 show that the stoichiometric compound has a higher total energy for the A-type AFM ground state, with a decrease of the Co DOS and an decrease in the total DOS at Anand_2014 . They also indicate that the total energies of the A-type AFM and FM states are similar for both compositions, which points to competition between the two states, regardless of the presence of a vacancy. Based on these results and the posited A-type AFM order for CaCo2As2, albeit occurring with a higher Cheng_2012 ; Ying_2013 ; Zhang_2015 , it is difficult to conclude what if any effect finite vacancy of the Co site has on the AFM structure of the ground state. Nevertheless, the precise effects on the crossover from the cT to T structure warrants further studies, which, ideally, should be preformed by varying the amount of vacancy of the Co site without chemical substitution or charge doping. Lastly, we point out that the larger uncertainty in the measured values of for the and samples indicates that the amount of disorder within these compounds is larger than that for other values of . Such disorder may obscure the observation of a sharp phase transition, potentially leading to the experimentally observed crossover from the cT to T phase.
Finally, we compare the suppression of the A-type AFM order in Ca(Co1-xFex)yAs2 with the sensitivity of Ca(Fe1-xCox)2As2 to low levels of strain. For FeAs-flux grown Ca(Fe1-xCox)2As2, single crystals annealed and then quenched at temperatures between °C exhibit the low-temperature AFM and orthorhombic, and superconducting phases seen for samples grown using Sn flux, whereas as-grown crystals quenched from °C enter the nonmagnetic cT phase upon cooling at ambient pressure Ran_2012 ; Ran_2011 . Additionally, the first-order structural phase transition between the high-temperature T and low-temperature cT phases becomes less severe, or rather more continuous, with increasing Co concentration, and it is suggested that a critical end point exists, past which a continuous thermal contraction occurs rather than a dramatic first-order transition Ran_2012 . The occurrence of a continuous T-cT phase transition with increasing Co concentration appears qualitatively similar to the smooth evolution with increasing from the cT to T phase for Ca(Co1-xFex)yAs2.
V CONCLUSION
We have shown that A-type AFM order exists in Ca(Co1-xFex)yAs2 for with the moments lying along the axis. We determine an ordered moment of Co at K for , which agrees with previous estimates Anand_2014 ; Quirinale_2013 , and find that both and decrease with increasing with rates of K and Co, respectively. In addition, our neutron diffraction experiments find no evidence for the development of stripe-type AFM order for up to at least nor the development of FM order up to at least . X-ray diffraction data show a smooth evolution with increasing from the cT phase of CaCo1.86As2 to the T phase of CaFe2As2. Our results suggest that hole doping suppresses the A-type magnetic order without the occurrence of an abrupt cT-T phase transition, nor any other sharp changes to the lattice parameters, but do not fully address whether a finite amount of vacancy of the Co site or disorder smear out an inherently sharp cT-T transition. To answer this question, systematic studies on the effects of partial vacancy of the magnetic site and chemical and structural disorder are necessary, and, in general, should lend more insight into the coupling between lattice, electronic, and magnetic degrees of freedom in CaCo1.86As2 and related compounds.
Acknowledgements.
We are grateful for assistance from D. Robinson with performing the high-energy x-ray diffraction experiments. Work at the Ames Laboratory was supported by the U. S. Department of Energy (DOE), Basic Energy Sciences, Division of Materials Sciences & Engineering, under Contract No. DE-AC-CH. A portion of this research used resources at the High Flux Isotope Reactor, a U. S. DOE Office of Science User Facility operated by the Oak Ridge National Laboratory. This research used resources of the Advanced Photon Source, a U. S. DOE Office of Science User Facility operated for the U. S. DOE Office of Science by Argonne National Laboratory under Contract No. DE-AC-CH.References
- (1) D. C. Johnston, Adv. Phys. 59, 803 (2010).
- (2) G. R. Stewart, Rev. Mod. Phys. 83, 1589 (2011).
- (3) P. C. Canfield and S. L. Bud’ko, Annu. Rev. Condens. Matter Phys. 1, 27 (2010).
- (4) J. W. Lynn and P. Dai, Physica C 469, 469 (2009).
- (5) J. Paglione and R. L. Greene, Nat. Phys. 6, 645 (2010).
- (6) A. S. Sefat, R. Jin, M. A. McGuire, B. C. Sales, D. J. Singh, and D. Mandrus, Phys. Rev. Lett. 101, 117004 (2008).
- (7) N. Ni, M. E. Tillman, J.-Q. Yan, A. Kracher, S. T. Hannahs, S. L. Bud’ko, and P. C. Canfield, Phys. Rev. B 78, 214515 (2008).
- (8) L. J. Li, Y. K. Luo, Q. B. Wang, H. Chen, Z. Ren, Q. Tao, Y. K. Li, X. Lin, M. He, Z. W. Zhu, G. H. Cao, and Z. A. Xu, New J. Phys. 11, 025008 (2009).
- (9) P. C. Canfield, S. L. Bud’ko, Ni Ni, J. Q. Yan, and A. Kracher, Phys. Rev. B 80, 060501 (2009).
- (10) A. I. Goldman, D. N. Argyriou, B. Ouladdiaf, T. Chatterji, A. Kreyssig, S. Nandi, N. Ni, S. L. Bud’ko, P. C. Canfield, and R. J. McQueeney, Phys. Rev. B 78, 100506 (2008).
- (11) L. Harnagea, S. Singh, G. Friemel, N. Leps, D. Bombor, M. Abdel-Hafiez, A. U. B. Wolter, C. Hess, R. Klingeler, G. Behr, S. Wurmehl, and B. Büchner, Phys. Rev. B 83, 094523 (2011).
- (12) R. Hu, S. Ran, W. E. Straszheim, S. L. Bud’ko, and P. C. Canfield, Phil. Mag. 92, 3113 (2012).
- (13) S. Ran, S. L. Bud’ko, W. E. Straszheim, J. Soh, M. G. Kim, A. Kreyssig, A. I. Goldman, and P. C. Canfield, Phys. Rev. B 85, 224528 (2012).
- (14) S. L. Bud’ko, S. Ran, and P. C. Canfield, Phys. Rev. B 88, 064513 (2013).
- (15) S. Ran, S. L. Bud’ko, W. E. Straszheim, and P. C. Canfield, Phys. Rev. B 90, 054501 (2014).
- (16) K. Momma and F. Izumi, J. Appl. Crystallogr., 44, 1272 (2011).
- (17) A. Kreyssig, M. A. Green, Y. Lee, G. D. Samolyuk, P. Zajdel, J. W. Lynn, S. L. Bud’ko, M. S. Torikachvili, N. Ni, S. Nandi, J. B. Leao, S. J. Poulton, D. N. Argyriou, B. N. Harmon, R. J. McQueeney, P. C. Canfield, and A. I. Goldman, Phys. Rev. B 78, 184517 (2008).
- (18) A. I. Goldman, A. Kreyssig, K. Prokeš, D. K. Pratt, D. N. Argyriou, J. W. Lynn, S. Nandi, S. A. J. Kimber, Y. Chen, Y. B. Lee, G. Samolyuk, J. B. Leão, S. J. Poulton, S. L. Bud’ko, N. Ni, P. C. Canfield, B. N. Harmon, and R. J. McQueeney, Phys. Rev. B 79, 024513 (2009).
- (19) D. K. Pratt, Y. Zhao, S. A. J. Kimber, A. Hiess, D. N. Argyriou, C. Broholm, A. Kreyssig, S. Nandi, S. L. Bud’ko, N. Ni, P. C. Canfield, R. J. McQueeney, and A. I. Goldman, Phys. Rev. B 79, 060510 (2009).
- (20) J. H. Soh, G. S. Tucker, D. K. Pratt, D. L. Abernathy, M. B. Stone, S. Ran, S. L. Bud’ko, P. C. Canfield, A. Kreyssig, R. J. McQueeney, and A. I. Goldman, Phys. Rev. Lett. 111, 227002 (2013).
- (21) D. G. Quirinale, V. K. Anand, M. G. Kim, A. Pandey, A. Huq, P. W. Stephens, T. W. Heitmann, A Kreyssig, R. J. McQueeney, D. C. Johnston, and A. I. Goldman, Phys. Rev. B 88, 174420 (2013).
- (22) V. K. Anand, R. S. Dhaka, Y. Lee, B. N. Harmon, A. Kaminski, and D. C. Johnston, Phys. Rev. B 89, 214409 (2014).
- (23) R. Hoffman and C. Zheng, J. Phys. Chem. 89, 4175 (1985).
- (24) M. Reehuis and W. Jeitschko, J. Phys. Chem. Solids 51, 961 (1990).
- (25) M. Reehuis, W. Jeitschko, G. Kotzyba, B. Zimmer, and X. Hu, J. Alloys Compd. 266, 54 (1998).
- (26) V. K. Anand, P. K. Perera, A. Pandey, R. J. Goetsch, A. Kreyssig, and D. C. Johnston, Phys. Rev. B 85, 214523 (2012).
- (27) M. Pfisterer and G. Nagorsen, Z. Naturforsch. 35b, 703 (1980).
- (28) M. Pfisterer and G. Nagorsen, Z. Naturforsch. 38b, 811 (1983).
- (29) B. Cheng, B. F. Hu, R. H. Yuan, T. Dong, A. F. Fang, Z. G. Chen, G. Xu, Y. G. Shi, P. Zheng, J. L. Luo, and N. L. Wang, Phys. Rev. B 85, 144426 (2012).
- (30) J. J. Ying, Y. J. Yan, A. F. Wang, Z. J. Xiang, P. Cheng, G. J. Ye, and X. H. Chen, Phys. Rev. B 85, 214414 (2012).
- (31) A. S. Sefat, D. J. Singh, R. Jin, M. A. McGuire, B. C. Sales, and D. Mandrus, Phys. Rev. B 79,024512 (2009).
- (32) A. Pandey, D. G. Quirinale, W. Jayasekara, A. Sapkota, M. G. Kim, R. S. Dhaka, Y. Lee, T. W. Heitmann, P. W. Stephens, V. Ogloblichev, A. Kreyssig, R. J. McQueeney, A. I. Goldman, A. Kaminski, B. N. Harmon, Y. Furukawa and D. C. Johnston, Phys. Rev. B 88, 014526 (2013).
- (33) V. K. Anand, D. G. Quirinale, Y. Lee, B. N. Harmon, Y. Furukawa, V. V. Ogloblichev, A. Huq, D. L. Abernathy, P. W. Stephens, R. J. McQueeney, A. Kreyssig, A. I. Goldman, and D. C. Johnston, Phys. Rev. B 90, 064517 (2014).
- (34) W. Jayasekara, Y. Lee, A. Pandey, G. S. Tucker, A. Sapkota, J. Lamsal, S. Calder, D. L. Abernathy, J. L. Niedziela, B. N. Harmon, A. Kreyssig, D. Vaknin, D. C. Johnston, A. I. Goldman, and R. J. McQueeney, Phys. Rev. Lett. 111, 157001 (2013).
- (35) P. Wiecki, V. Ogloblichev, A. Pandey, D. C. Johnston, and Y. Furukawa, Phys. Rev. B 91, 220406 (2015).
- (36) M. E. Fisher, Philos. Mag. 7, 1731 (1962).
- (37) Shuang Jia, Songxue Chi, J. W. Lynn, and R. J. Cava, Phys. Rev B 81, 214446 (2010).
- (38) Shuang Jia, Pawina Jiramongkolchai, M. R. Suchomel, B. H. Toby, J. G. Checkelsky, N. P. Ong, and R. J. Cava, Nat. Phys. 7, 207 (2011).
- (39) M. G. Kim, A. Kreyssig, A. Thaler, D. K. Pratt, W. Tian, J. L. Zarestky, M. A. Green, S. L. Bud’ko, P. C. Canfield, R. J. McQueeney, and A. I. Goldman, Phys. Rev. B 82, 220503 (2010).
- (40) W. T. Jayasekara, U. S. Kaluarachchi, B. G. Ueland, A. Pandey, Y. B. Lee, V. Taufour, A. Sapkota, K. Kothapalli, N. S. Sangeetha, G. Fabbris, L. S. I. Veiga, Yejun Feng, A. M. dos Santos, S. L. Bud’ko, B. N. Harmon, P. C. Canfield, D. C. Johnston, A. Kreyssig, and A. I. Goldman, Phys. Rev. B 92, 224103 (2015).
- (41) C. Liu, T. Kondo, R. M. Fernandes, A. D. Palczewski, E. D. Mun, N. Ni, A. N. Thaler, A. Bostwick, E. Rotenberg, J. Schmalian, S. L. Bud’ko, P. C. Canfield, and A. Kaminski, Nat. Phys. 6, 419 (2010).
- (42) T. Yildirim, Phys. Rev. Lett. 102, 037003 (2009).
- (43) S. A. J. Kimber, A. Kreyssig, Y.-A. Zhang, H. O. Jeschke, R. Valenti, F. Yokaichiya, E. Colombier, J. Yan, T. C. Hansen, T. Chatterji, R. J. McQueeney, P. C. Canfield, A. I. Goldman, and D. N. Argyriou, Nat. Mater. 8, 471 (2009).
- (44) S. Jia, A. J. Williams, P. W. Stephens, and R. J. Cava, Phys. Rev. B 80, 165107 (2009).
- (45) J. J. Ying, J. C. Liang, X. G. Luo, Y. J. Yan, A. F. Wang, P. Cheng, G. J. Ye, J. Q. Ma, and X. H. Chen, Europhys. Lett. 104, 67005 (2013).
- (46) W. Zhang, K. Nadeem, H. Xiao, R. Yang, B. Xu, H. Yang, and X. G. Qiu, Phys. Rev. B 92, 144416 (2015).
- (47) S. Ran, S. L. Bud’ko, D. K. Pratt, A. Kreyssig, M. G. Kim, M. J. Kramer, D. H. Ryan, W. N. Rowan-Weetaluktuk, Y. Furukawa, B. Roy, A. I. Goldman, and P. C. Canfield, Phys. Rev. B 83, 144517 (2011).