AGB and SAGB stars: modelling dust production at solar metallicity
Abstract
We present dust yields for asymptotic giant branch (AGB) and super–asymptotic giant branch (SAGB) stars of solar metallicity. Stars with initial mass reach the carbon star stage during the AGB phase and produce mainly solid carbon and SiC. The size and the amount of the carbon particles formed follows a positive trend with the mass of the star; the carbon grains with the largest size (m) are produced by AGB stars with , as these stars are those achieving the largest enrichment of carbon in the surface regions. The size of SiC grains, being sensitive to the surface silicon abundance, keeps around m. The mass of carbonaceous dust formed is in the range , whereas the amount of SiC produced is . Massive AGB/SAGB stars with experience HBB, that inhibits formation of carbon stars. The most relevant dust species formed in these stars are silicates and alumina dust, with grain sizes in the range m and m, respectively. The mass of silicates produced spans the interval and increases with the initial mass of the star.
keywords:
Stars: abundances – Stars: AGB and post-AGB. ISM: abundances, dust1 Introduction
The recent years have witnessed a growing interest towards the post core helium-burning evolution of low- and intermediate-mass stars (). These late evolutionary phases, the AGB or SAGB (for initial masses , which develop a O-Ne core), despite representing only a few percent of the overall stellar life, are of fundamental importance to understand the feedback of these objects on the host environment. This is because AGB and SAGB stars are characterised by strong mass-loss rates, which favour the loss of the whole external envelope, before the beginning of the planetary nebula and white dwarf evolution.
During the AGB phase the stars eject gas with a chemical composition altered by internal nucleosynthesis processes, thus enriching the interstellar medium. Several theoretical studies have presented mass- and metallicity-dependent AGB stellar yields (see, among others, Cristallo et al. 2009, 2015; Doherty et al. 2014; Karakas 2010, 2014; Karakas & Lattanzio 2014; Karakas & Lugaro 2016; Ventura et al. 2013, 2014; Di Criscienzo et al. 2016). These works outlined several similarities but also significant differences in the predicted yields. These are mostly due to the different description of convection, both in terms of the efficiency of convective transport and of the treatment of the convective/radiative interface.
A strong interest towards AGB stars is also motivated by the thermodynamical structure of the circumstellar envelope, which proves to be an environment extremely favourable to the condensation of gaseous molecules into dust particles. The surface layers of these stars are sufficiently cool (K) to allow dust formation at typical distances of 3–10 stellar radii from the surface, where the densities are large enough (, Gail & Sedlmayr, 1985) to allow the formation of meaningful quantities of dust.
The pioneering investigations by the Heidelberg group (Ferrarotti & Gail, 2001, 2002, 2006) set up the framework to model dust formation in the circumstellar envelope of AGB stars: the schematisation adopted is based on the assumption that the wind expands isotropically from the stellar surface, under the push of radiation pressure, acting on the newly formed dust grains. While interesting improvements to this basic treatment, accounting for the effects of shocks coupled to the AGB evolution are in progress (Marigo et al., 2016), this approach is at present the only way to allow the description of dust formation in the winds of stars of different mass and chemical composition, extended over the whole AGB phase. Indeed, different research groups have modelled the formation and growth of solid particles in the wind of low-metallicity AGB stars, calculating the dust yields from this class of objects (Ventura et al., 2012a, b, 2014; Di Criscienzo et al., 2013; Nanni et al., 2013, 2014). These models have been successfully used to interpret the near- and mid-infrared observations (mainly obtained with the Spitzer Space Telescope) of evolved stars in the Magellanic Clouds (Dell’Agli et al., 2014b, 2015a, 2015b; Nanni et al., 2016) and in the Local Group (LG) galaxy IC 1613 (Dell’Agli et al., 2016). An important outcome of these investigations was the characterization of the individual sources observed, in terms of mass, formation epoch and chemical composition of their progenitors. Furthermore, these studies allowed to infer important information on the past history of the host galaxy (particularly the star formation history and the mass-metallicity relationship) and provided valuable constraints on the physical mechanisms relevant to understand the main evolutionary properties of AGB stars.
As we have mentioned above, these works have been so far based on low-metallicity extra-galactic AGB stars. This is partly due to the fact that the distances to Galactic sources are basically unknown or very uncertain, so that interpreting the observations is quite difficult. This limitation will be largely overcome by the results of the Gaia mission, because the parallaxes - so the distances and luminosities - will be measured with high accuracy for an important fraction of Galactic AGB stars, including those exhibiting a large degree of obscuration. This will open new frontiers in the AGB field, because the sample of Galactic AGB stars is much larger and extends to a wider metallicity range than the AGB population of the Magellanic Clouds and other LG galaxies.
In order to be ready for the Gaia challenge, we have recently extended the AGB models, so far limited to metallicities , to solar metallicity (Di Criscienzo et al. 2016, hereinafter DC16). In DC16 we presented the main evolutionary properties of the solar metallicity AGB models as well as the chemistry of the gas ejected in the interstellar medium. Here we focus on the dust formation properties and present new dust yields based on a self-consistent coupling of the wind description with the DC16 AGB evolutionary models. In addition, these solar-metallicity AGB dust models will be essential to interpret the rich dataset of IR photometric observations (e.g., from space missions like MSX, AKARI and WISE) of Galactic sources as well as the already available Spitzer photometric observations of evolved stars in nearby high-metallicity galaxies such as M 31 (Mould et al., 2008), M 33 (McQuinn et al., 2007; Javadi et al., 2011a, b, 2015) and M 32 (e.g. Jones et al., 2015). The results presented here and in our previous papers of this series (Ventura et al., 2012a, b; Di Criscienzo et al., 2013; Ventura et al., 2014), complemented by a new grid of mass- and metallicity-dependent SN dust grid (Marassi et al. 2014, 2015; Bocchio et al. 2016, Marassi et al. in prep) will allow to fully assess the role of AGB stars as cosmic dust polluters, in present-day galaxies (Schneider et al., 2014) as well as at very high redshifts (Valiante et al., 2009, 2011; Mancini et al., 2015, 2016).
2 Dust formation model
We describe the growth of dust particles in the circumstellar envelope of AGB stars by means of the schematisation introduced by the Heidelberg group (Ferrarotti & Gail, 2001, 2002, 2006). We provide here a short description of the basic concepts upon which the modelling of the wind dynamics and of the dust formation process is based; we address the interested reader to the previous works on this argument (Ventura et al., 2012a, b; Di Criscienzo et al., 2013; Ventura et al., 2014; Dell’Agli et al., 2014a), which include the full set of equations used and a more exhaustive discussion on this argument.
The wind is assumed to expand isotropically from the surface of the star. Dust formation occurs once the growth rate of solid grains exceeds the rate of destruction (hereafter the decomposition rate). The first is determined by the deposition efficiency of gaseous molecules on the already formed solid particles. For each dust species, the decomposition rate is found via the evaluation of the vapour pressures of individual molecular species involved, under thermodynamic equilibrium conditions (Gail & Sedlmayr, 1999).
The description of the wind is self-consistently coupled to the results of stellar evolution: the input parameters entering dust formation, namely the mass (), luminosity (), effective temperature (), radius (), mass loss rate () and surface chemical composition of the star, are the natural output of AGB evolutionary modelling.
The kind of particles formed in the circumstellar envelope depends on the surface chemical composition of the star, mainly on the surface carbon-to-oxygen (C/O) ratio. This is because the CO molecule is extremely stable (Sharp & Huebner, 1990), thus the least abundant element between carbon and oxygen is locked into CO molecules. Based on stability arguments, we assume that in carbon–rich environments the species of dust formed are solid carbon, solid iron and silicon carbide, whereas in M stars the formation of silicates (olivine, pyroxene and quartz), solid iron and alumina dust is accounted for (Sharp & Huebner, 1990; Ferrarotti & Gail, 2006). For each dust species it is possible to identify the key element, which is the least abundant among the various chemical species required to form the solid particles: such key–element is extremely important, as it determines the largest amount of a specific kind of dust particles which is possible to form. A list of the dust species considered here, with the reactions of formation, the key–elements and the sticking coefficients adopted, is shown in Table 1 of Ventura et al. (2014)111After the analysis published in Dell’Agli et al. (2014a) where different value of the sticking coefficient for the alumina dust has been explored, we adopted the value 0.1 which is consistent with the recent laboratory measurements by Takigawa et al. (2015)..
3 Solar metallicity AGB stars
The AGB evolutionary models calculated with the code ATON (Canuto & Mazzitelli, 1991) and used in the present work have been recently published by DC16. The models span the range of initial masses . The upper limit is determined by the core collapse via electron capture experienced by stars. During the AGB phase the stars evolve on a degenerate core composed of carbon and oxygen with the exception of the stars with mass above , which form a core composed of oxygen and neon (the so-called SAGB stars), owing to an off-center ignition of carbon in conditions of partial degeneracy (García-Berro & Iben, 1994; García-Berro et al., 1997; Siess, 2006, 2007, 2009, 2010). The interested reader is referred to DC16 for an exhaustive discussion on the evolutionary properties of these stars. Here we only provide a brief summary of the physical and chemical evolutionary aspects most relevant to the dust formation process in their winds.
The stars of initial mass , to which we will refer as “massive AGB/SAGB stars”, experience hot bottom burning (hereinafter HBB) at the base of the outer convective envelope (Renzini & Voli, 1981). The activation of proton-capture nucleosynthesis at the bottom of the external mantle leads to a considerable increase in the luminosity of the star (Blöcker & Schöenberner, 1991), with significant deviations from the classic core mass - luminosity relation (Paczynski, 1970). The largest luminosities reached range from , for , to , for . The temperatures at which the bottom of the surface convective zone is exposed, which affect the degree of nucleosynthesis experienced, span the range MK (see Fig. 1 in DC16).
On the chemical side, massive AGB/SAGB stars never reach the C-star stage, because the surface carbon is destroyed at the base of the convective envelope by proton capture reactions, which prevent the achievement of the C/O condition. Due to the ignition of CN cycling, the ejecta from these stars are nitrogen-rich (with an overall N increase slightly below a factor of 10 with respect to the initial abundance) and carbon-poor, with the carbon content being one order of magnitude smaller than the original gas out of which the stars formed. Unlike lower metallicity AGB stars, in this case the HBB temperatures are below MK, which reflects into a modest (below ) depletion of oxygen and magnesium and a negligible production of aluminium. Sodium is produced in significant quantities, with an average sodium increase in the ejecta by a factor of (see Figs. 8 and 9 in DC16).
The evolution of AGB models with , to which we will refer to as “low-mass AGB stars”, is very different from that of their higher mass counterparts. This is because the core mass is , too small to activate HBB (Ventura et al. 2013). In this case, the only physical mechanism able to alter the surface chemical composition is the third dredge-up (TDU), which produces a gradual increase in the surface carbon and, eventually, the formation of a carbon star (C/O1).
On the physical side, the achievement of the C-star stage causes a considerable
increase in the surface molecular opacities that favours a general cooling and
a considerable expansion of the external regions (Marigo, 2002; Ventura & Marigo, 2009, 2010).
The stellar effective temperature () decreases down to 1900 K, in
conjunction with the maximum surface carbon abundance. Consequently, the
outermost regions of the star become less and less gravitationally bound and
the mass-loss rate increases. After the
C-star stage is reached, the evolutionary times become short and the relative duration of the C-star phase is below
respect to the entire AGB phase (see Table 1 in DC16).
The surface chemical composition of low-mass AGB stars is entirely dominated by the effects of TDU. The gas lost by these stars is enriched in carbon, with a maximum increase by a factor of achieved in the model. The final surface carbon abundances range from for , to for . The enrichment in carbon increases with because more massive stars are exposed to a higher number of TDU events before the envelope is completely lost.
4 Dust production
As discussed in Section 2, the kind of dust grains (i.e., their specific chemical composition) formed in the wind of AGB stars is mainly determined by the surface C/O ratio: oxygen-rich stars produce silicates and alumina (Al2O3) dust grains, carbon-stars produce solid carbon and silicon carbide (SiC) grains.
The surface chemical composition of solar metallicity, AGB stars is extremely sensitive to the initial mass (see Section 3): stars with become carbon stars222As discussed in DC16, stars of mass below never reach the C-star stage, because they loose the whole external mantle before the surface carbon exceeds oxygen., while their higher mass counterparts evolve as M-stars for the whole AGB phase. This dichotomy reflects into the dust composition, which is dominated by silicates in massive AGB/SAGB stars and by solid carbon in the low-mass domain. In the following, we analyse these two groups separately. We do not discuss stars with , because they produce only a negligible amount of silicates during their life.
4.1 Dust production in massive AGB/SAGB stars
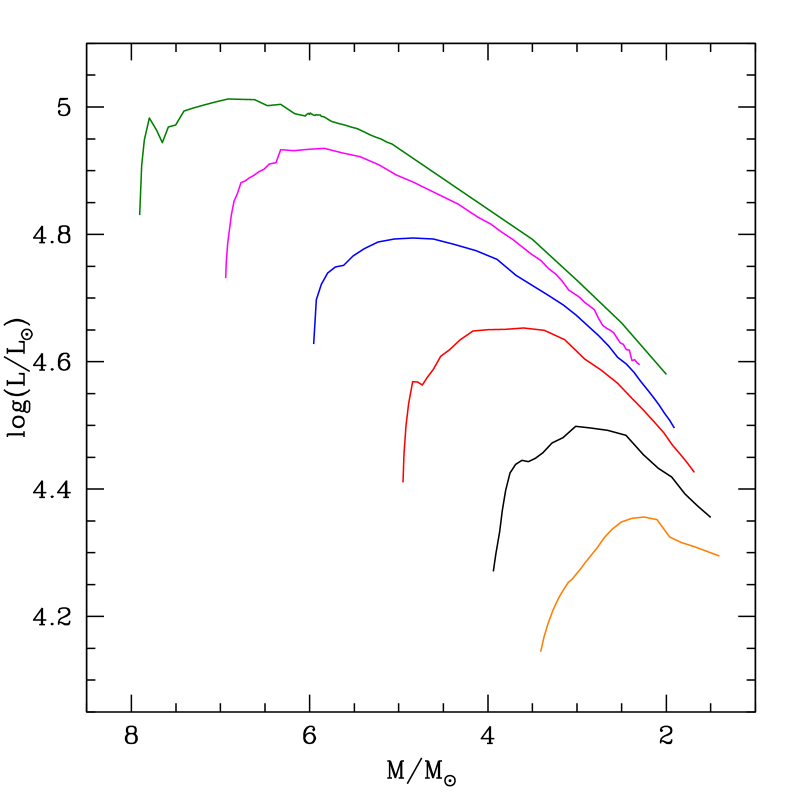
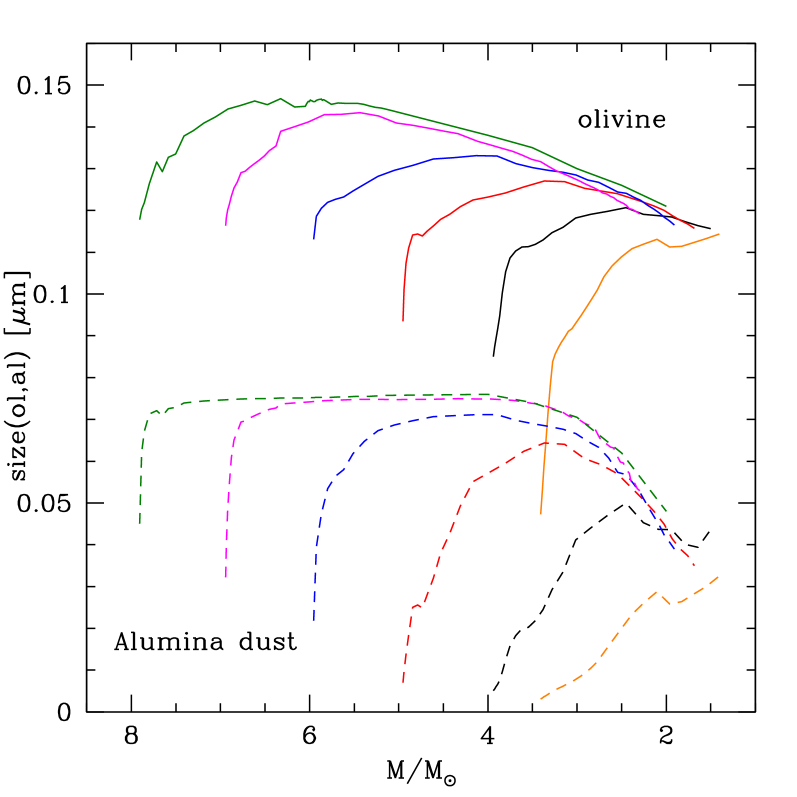
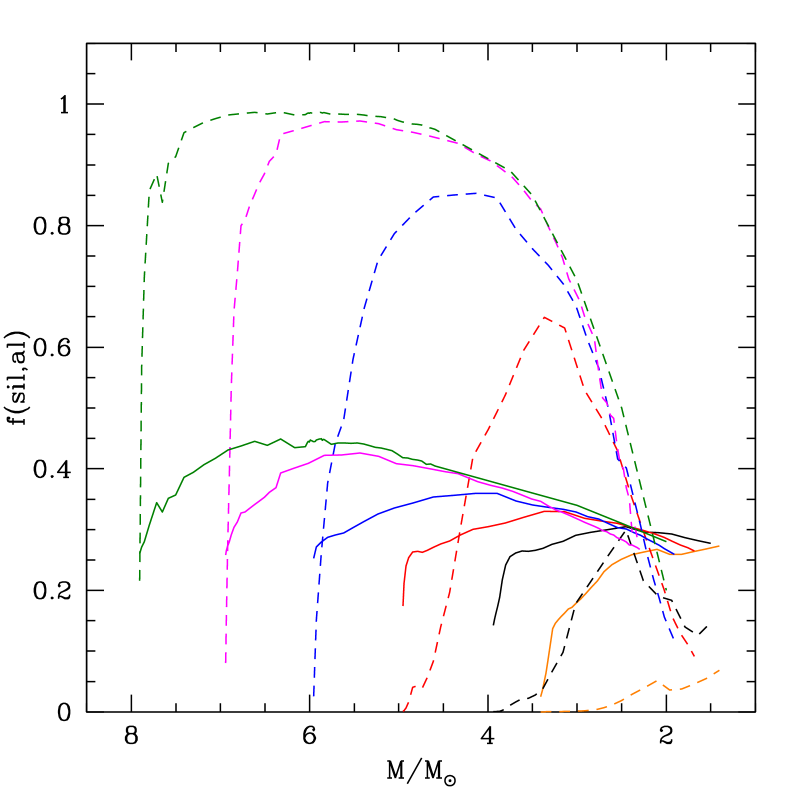
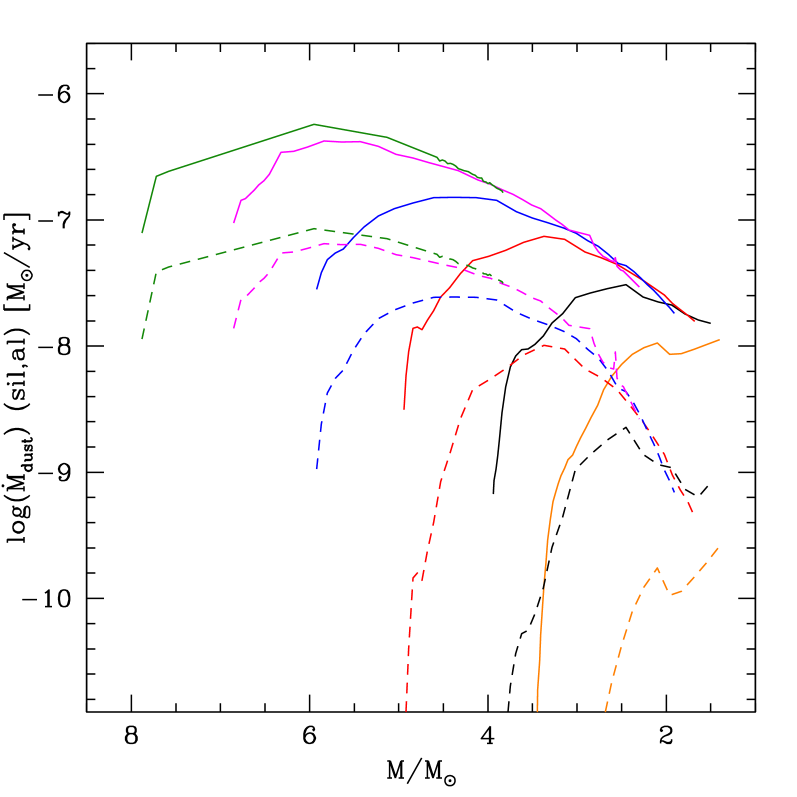
Fig. 1 shows the variation of the luminosity, the size of the dust particles formed in the wind, the fraction of the key-species (silicon and aluminium) condensed into dust and the dust mass-loss rate (splitted into the silicates and the alumina dust contributions), for massive AGB/SAGB stars.
For these objects the production of dust is modulated by the luminosity (Ventura et al., 2012a, b). The larger is , the larger is the mass-loss rate, the higher is the density of the gas (see eq. 2 in Ventura et al. (2014)). This favours dust production, due to the larger number of gaseous molecules available to form dust.
| 1.5 | 5.11e-04 | 8.45e-05 | 2.95e-05 | 9.40e-06 | 4.42e-08 | 1.16e-04 | 5.61e-05 | 2.08e-04 |
| 1.75 | 7.17e-04 | 2.81e-05 | 1.18e-05 | 7.67e-06 | 1.72e-08 | 2.74e-04 | 2.82e-04 | 1.05e-04 |
| 2.0 | 2.34e-03 | 6.36e-06 | 2.36e-06 | 8.71e-07 | 2.18e-09 | 1.28e-03 | 9.41e-04 | 1.10e-04 |
| 2.25 | 3.23e-03 | 1.81e-06 | 7.05e-07 | 4.31e-07 | 1.31e-09 | 9.69e-05 | 2.53e-03 | 6.01e-04 |
| 2.5 | 4.19e-03 | 1.62e-07 | 6.06e-08 | 2.35e-08 | 2.29e-10 | 2.29e-05 | 3.27e-03 | 8.93e-04 |
| 3.0 | 6.05e-03 | 5.24e-07 | 2.08e-07 | 8.84e-08 | 5.04e-10 | 2.07e-05 | 5.09e-03 | 9.40e-04 |
| 3.5 | 2.37e-03 | 1.53e-03 | 4.44e-04 | 5.35e-05 | 2.96e-05 | 2.96e-04 | - | - |
| 4.0 | 3.20e-03 | 2.33e-03 | 6.00e-04 | 3.96e-05 | 1.15e-04 | 1.09e-04 | - | - |
| 4.5 | 3.74e-03 | 2.75e-03 | 6.74e-04 | 3.63e-05 | 1.95e-04 | 8.11e-05 | - | - |
| 5.0 | 4.48e-03 | 3.31e-03 | 7.70e-04 | 3.28e-05 | 3.07e-04 | 6.19e-05 | - | - |
| 5.5 | 5.34e-03 | 3.91e-03 | 8.70e-04 | 2.95e-05 | 4.75e-04 | 5.08e-05 | - | - |
| 6.0 | 6.16e-03 | 4.47e-03 | 9.61e-04 | 2.92e-05 | 6.43e-04 | 5.08e-05 | - | - |
| 6.5 | 7.72e-03 | 5.60e-03 | 1.12e-03 | 2.61e-05 | 9.15e-04 | 5.74e-05 | - | - |
| 7.0 | 8.20e-03 | 5.92e-03 | 1.16e-03 | 2.62e-05 | 1.04e-03 | 5.82e-05 | - | - |
| 7.5 | 1.05e-02 | 7.51e-03 | 1.36e-03 | 2.20e-05 | 1.51e-03 | 7.98e-05 | - | - |
| 8.0 | 1.14e-02 | 8.22e-03 | 1.43e-03 | 2.07e-05 | 1.65e-03 | 8.41e-05 | - | - |
As shown in the top-left panel of Fig. 1, the luminosity increases during the initial AGB phases due to the increase in the core mass. This trend is reversed at a given stage during the AGB evolution because of the progressive consumption of the external mantle, which favours the general cooling of the whole external structure. This behaviour reflects into the amount and the size of the dust grains produced during the AGB life. The silicates grains with the largest size are formed during the highest luminosity phases (see the top-right panel in Fig. 1)333For clarity sake, we show only the dominant silicate species, i.e. olivine. We discuss the properties of the other dust species in the text. This is the phase where we expect massive AGB/SAGB stars to show the strongest IR emission, as this is sensitive to the amount of dust in the circumstellar envelope.
Because higher mass stars evolve at larger luminosities, olivine grains with the largest size, m, are produced by AGB stars with initial mass close to the threshold to undergo core collapse, i.e. . Generally speaking, most of the olivine grains formed in the wind of massive AGB/SAGB stars have dimensions in the range mm, while pyroxene and quartz grains can be as small as m and m, respectively.
The fraction of silicon condensing into solid particles (see the bottom-left panel in
Fig. 1) is . In the case of stars with initial mass these percentages are significantly smaller compared
to the alumina dust case, during almost the entire AGB phase. This is because of the large extinction coefficient of silicates, which
favours a significant acceleration of the wind as soon as silicate particles
begin to form. Under these conditions, mass continuity
leads to a sudden drop in the density of the gas, which prevents further
formation of dust.
Massive AGB/SAGB stars, particularly during the highest luminosity phases, eject great quantities of silicates into the interstellar medium (see bottom-right panel of Fig. 1). The rate at which silicate dust is ejected is in the range .
The behaviour of alumina dust is different from silicates. Al2O3 is more thermodynamically stable (Sharp & Huebner, 1990), thus it forms closer to the stellar surface (Dell’Agli et al., 2014a). This compound is rather transparent to the electromagnetic radiation, so no significant acceleration of the gas occurs when alumina dust is formed. Therefore, it is possible that high fractions of the aluminium available condense into dust. This is shown in the bottom-left panel of Fig. 1, where it can be seen that during the largest luminosity phases of SAGB stars () more than of aluminium is condensing into dust. The largest size of alumina dust particles, m (see top-right panel in Fig. 1) are reached during the phases when all the aluminium available is locked into Al2O3 grains. The alumina dust contribution to the total dust production rate is approximately one order of magnitude smaller than the silicates, with Al2O3 mass-loss rates of in all cases (see the bottom-right panel in Fig. 1).
When comparing the formation process of silicates and alumina dust, it is important to remark that the main limiting factor to the growth of silicates is the large wind acceleration caused by radiation pressure, that leads to a sudden drop of the gas density. Conversely, the main limiting factor to the growth of alumina grains is the amount of aluminium present in the surface regions of the star.
Alumina dust starts to condense at distances below from the stellar surface
whereas silicates particles form in a region between 4 and 9 . The
location of the condensation zone of silicates is sensitive to the initial mass
of the star, being closer to the stellar surface the lower is . In
SAGB stars, the formation of alumina dust in an internal zone of
the circumstellar envelope, despite not sufficient to accelerate the wind,
produces a steep gradient of the optical depth (see eq. 4 in Ventura et al. (2014)). This
increases the gas temperature (eq. 3 in Ventura et al. (2014)), moving the silicates dust
condensation zone to more external regions (between and from the stellar surface). This effect is negligible in massive AGB stars with
and the silicates dust formation takes place in a more
internal region (between 4 and 6 ).
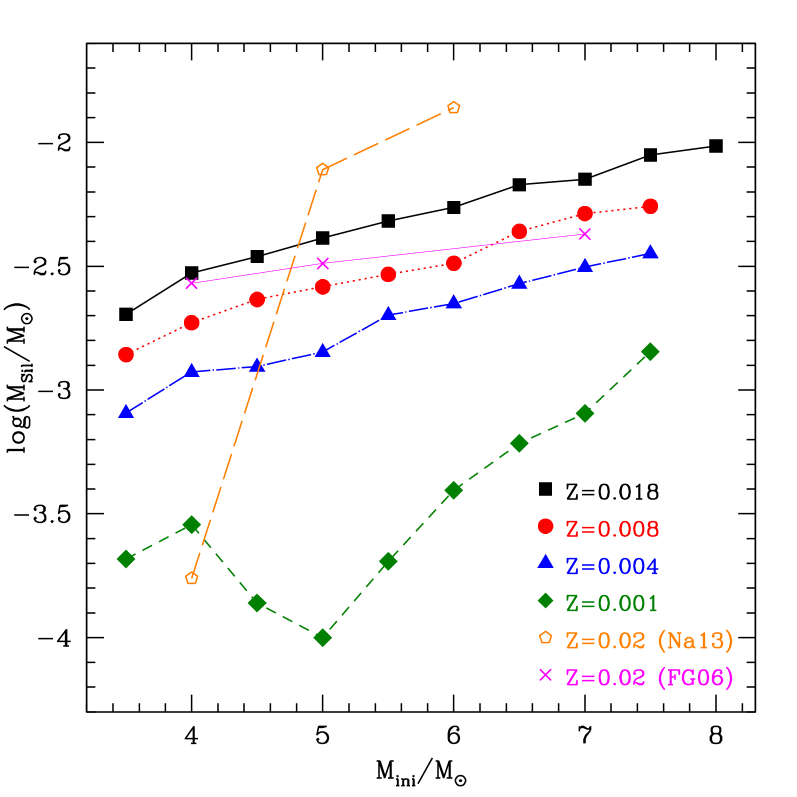
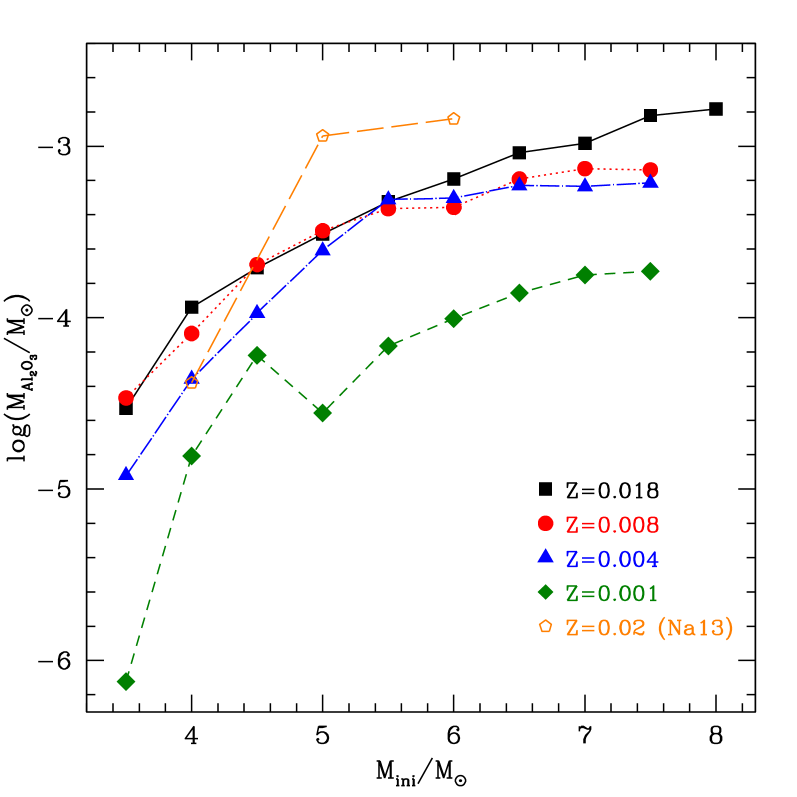
The masses of silicates and alumina dust produced by solar metallicity AGB stars are listed in Table 2. In Fig. 2 they are compared with results from lower- AGB models (Ventura et al., 2012a, b; Di Criscienzo et al., 2013; Ventura et al., 2014). We find that the amount of silicates and alumina dust increases with the initial mass of the star. The mass of produced silicates dust ranges from () to (). The amount of formed alumina dust spans the mass interval . Considering both dust contributions (alumina and silicates), we find for the present models a dust-to-gas ratio () of . As discussed earlier in this section, the mass-loss rate is the key parameter determining the overall dust production in massive AGB/SAGB stars. This is the reason why turns out to be only mildly dependent on .
The left panel of Fig. 2 shows that the mass of silicates scales almost linearly with . This is caused by the larger amount of silicon available in higher metallicity stars. The trend of the alumina dust mass with metallicity is still positive but less straightforward, the results being less sensitive to . The higher efficiency of HBB in lower metallicity models favours alumina dust production (i.e., more gaseous Al is available to form Al-based dust grains) and partially compensates the effect of the lower metallicity. On the other hand, the exhaustion of the gaseous aluminium available for the condensation into dust sets an upper limit to the amount of Al2O3 formed.
The present results indicate that massive AGB stars experiencing HBB are the main manufacturers of alumina dust and silicates. This is nice agreement with the recent findings by Lugaro et al. (2017): comparing the isotopic ratio in presolar grains with the new proton-capture rate, they found that massive AGB stars experiencing HBB are the most likely responsible of Al-rich oxides and silicates grains formation.
4.2 Dust production in low-mass AGB stars
Low-mass AGB stars produce negligible quantities of silicates and alumina dust grains during the initial part of their AGB evolution, before becoming carbon stars. This is due to the low mass-loss rate and luminosity experienced. The dust formed in the circumstellar envelope of these stars is mainly produced during the C-rich phase and is composed of solid carbon and SiC.
While luminosity is the main factor affecting dust formation in massive AGB/SAGB stars, the formation of dust in low-mass stars is guided by the amount of carbon available in the envelope. Therefore, the quantity of dust formed increases during the C-star phase, as more and more carbon is transported to the stellar surface, owing to the effects of repeated TDU episodes. The increase in the surface carbon is accompanied by an increased cooling of the external regions, which leads to a significant decrease in the effective temperature and to an increase in the mass-loss rate (Marigo, 2002; Ventura & Marigo, 2009, 2010). This additional factor, for the reasons outlined in the previous sections, further favours the formation and growth of C-based dust particles.
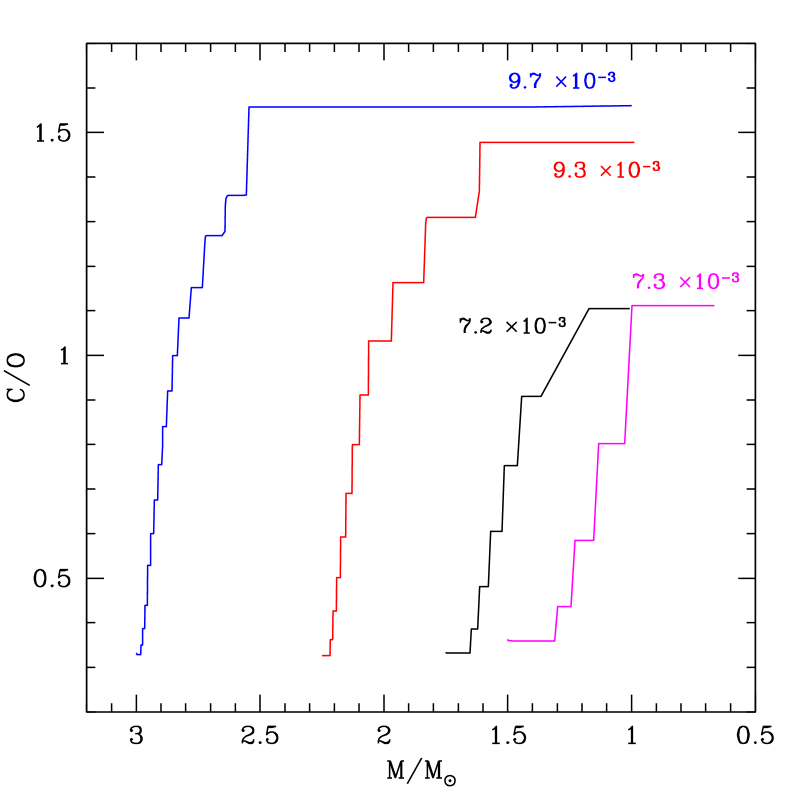
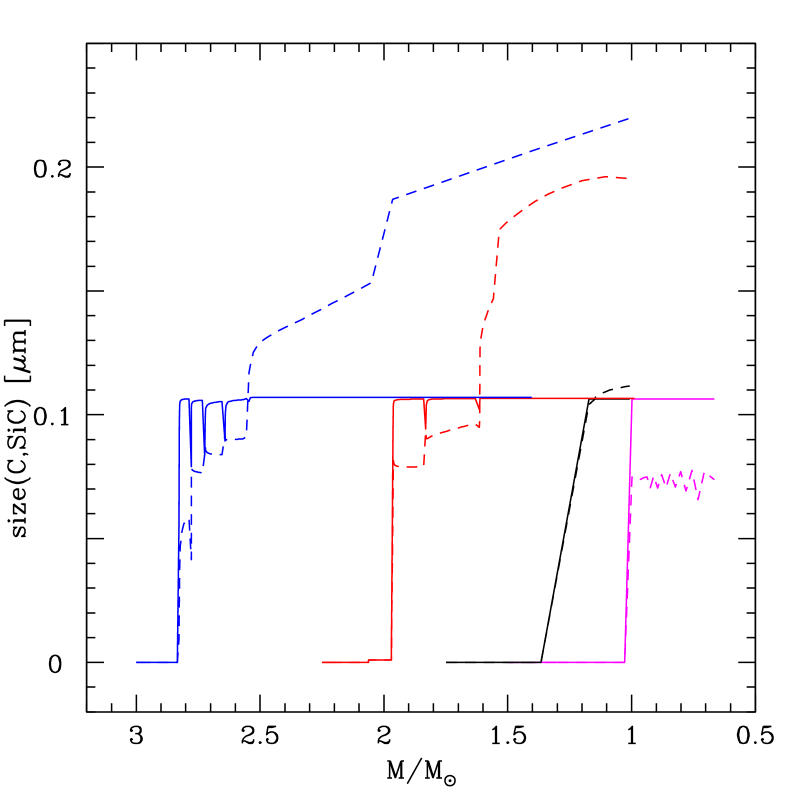
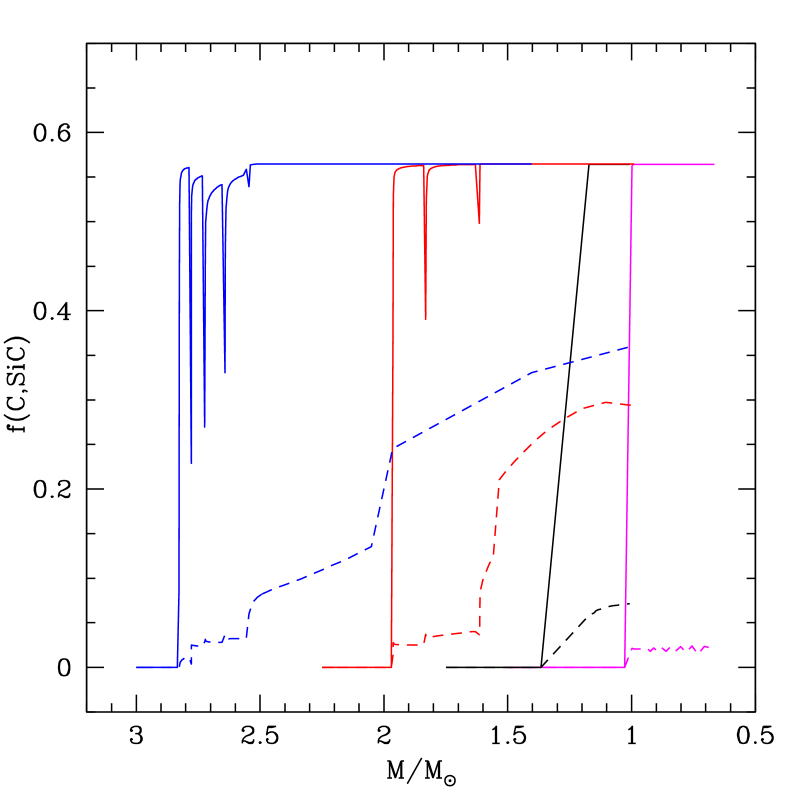
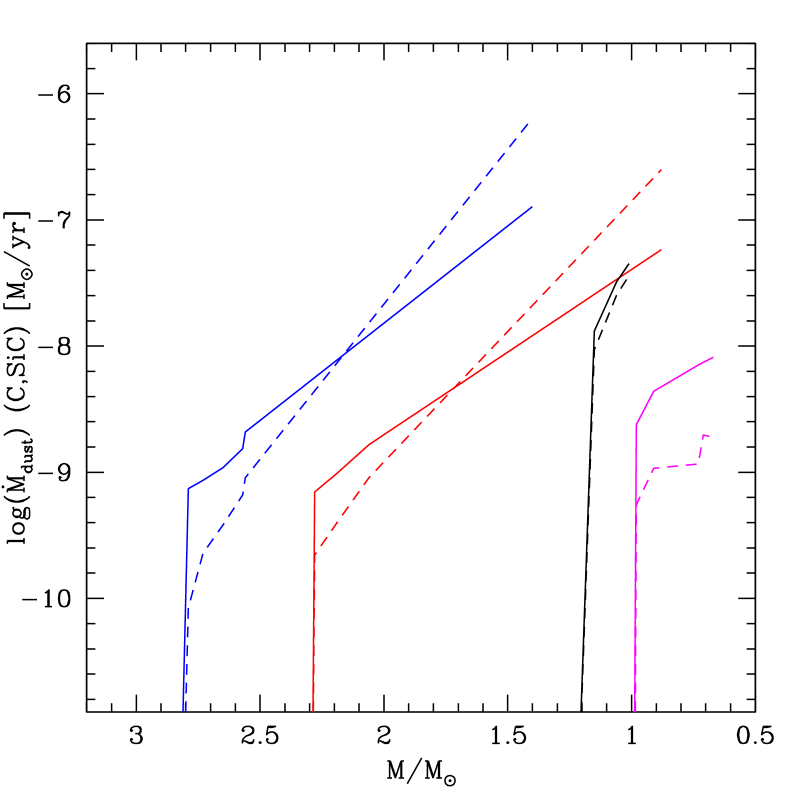
Fig. 3 shows the variation of the surface C/O ratio, the size of carbon and SiC dust grains formed, the fraction of carbon and silicon condensed into dust, and the mass loss rate of carbon and SiC dust, during the AGB phase of stars with initial mass .
The size of the carbon dust grains increases during the AGB phase (see top-right panel) as a consequence of the increase in the surface carbon abundance (top-left panel). Therefore, carbon grains with the largest size form during the final AGB phases, when the surface carbon mass fraction reaches the maximum value. The typical size of carbon grains is in the range mm, and it increases with the initial stellar mass, because stars of higher mass experience a higher number of TDU episodes, accumulating a higher abundance of carbon in the external layers (DC16). This is clear from Fig. 3 (top-right panel) where models with , whose surface C/O barely exceeds unity, form smaller dust grains than their more massive counterparts.
The fraction of gaseous carbon condensed into dust, shown in the botton-left panel of Fig. 3, ranges from to . The upper limit is motivated by the large values of the carbon dust extinction coefficients, which favour a rapid acceleration of the wind once carbon grains begin to form. This is similar to the effect on the dynamics of the wind triggered by the formation of silicates in the circumstellar envelope of massive AGB/SAGB stars.
A different behaviour is found for SiC. Although SiC is more stable and it is formed in more internal circumstellar regions (with higher density), the growth of SiC particles never exceeds the threshold value of m (see the top-right panel in Fig. 3), which corresponds to the situation where of gaseous silicon is condensed into dust (see bottom-left panel in Fig. 3). This is the largest amount of silicon available to form dust, because of the high stability of the SiS molecule, which makes of the total silicon in the envelope to be locked into gaseous SiS (Ferrarotti & Gail, 2006).
The region where SiC forms is from the surface of the star, to be compared
with the larger distances, , of the carbon condensation zone.
Similarly to what
found for oxygen-rich stars, the formation of the most stable
dust species, i.e. SiC, favours the increase in the optical depth, so that solid carbon condensation
takes place in a more external region of the wind. This effects gets more
and more important as the stars evolves through the AGB, because the density of the
wind increases towards the final evolutionary phases.
In stars with initial mass , which achieve only a modest C/O
during the AGB evolution, the residual gaseous carbon in the wind
after SiC formation in the internal regions of the circumstellar envelope
is such that the size of the carbon grains formed is barely equal or even smaller than
the SiC grains.
The rates at which carbon and SiC dust are ejected into the interstellar medium increase during the AGB evolution. The largest values, attained in the final evolutionary phases, are of the order of for carbon dust and for SiC (see the bottom-right in Fig. 3).
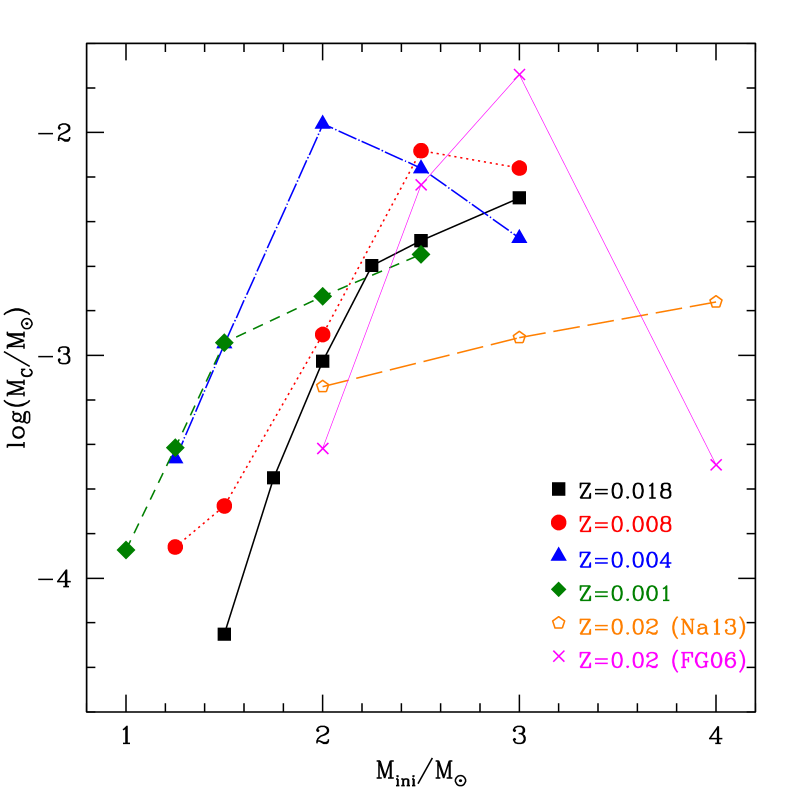
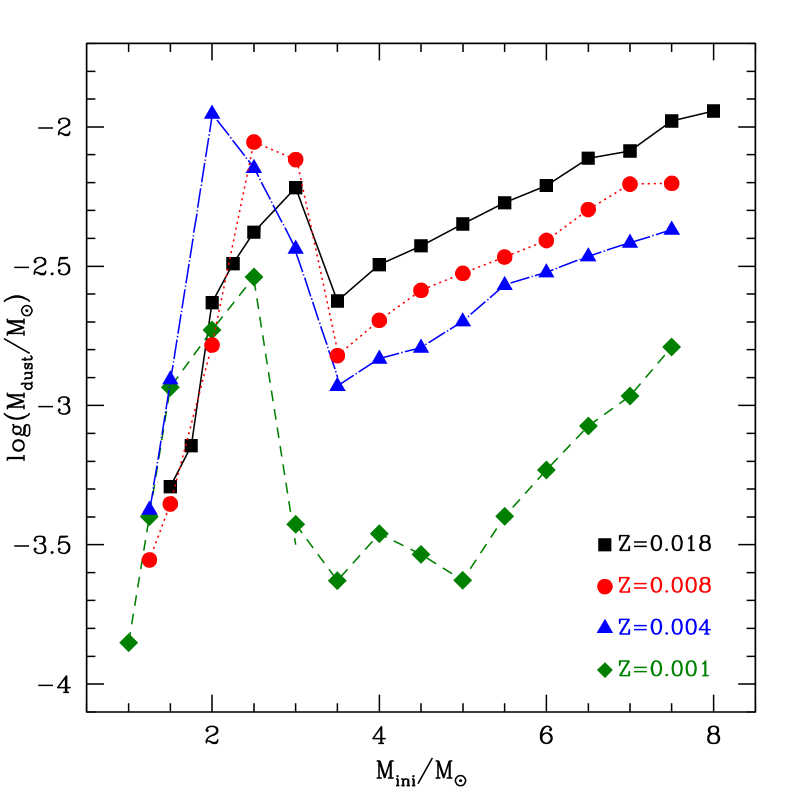
The masses of carbon and SiC dust produced by solar metallicity low-mass AGB stars are shown in Fig. 4 and compared with the corresponding dust masses from lower-metallicity stars. The mass of carbon dust is in the range . The trend with is positive, as expected (see the reasons discussed above). The trend with metallicity, however, is not trivial. For stars with , the amount of carbon dust produced by solar metallicity models is smaller than what found at lower . Because of the higher initial oxygen, the C-star stage is attained in a more advanced AGB phase and the carbon excess with respect to oxygen is generally smaller. For stars with , this is compensated by the larger temperatures at the base of the envelope attained by lower metallicity stars of the same mass, which favours the ignition of a soft HBB, preventing the accumulation of high quantities of carbon in the surface regions.
The dust-to-gas ratio of carbon-stars ranges from , at the beginning of the carbon-rich phase, up , achieved during the final phases of AGB stars with .
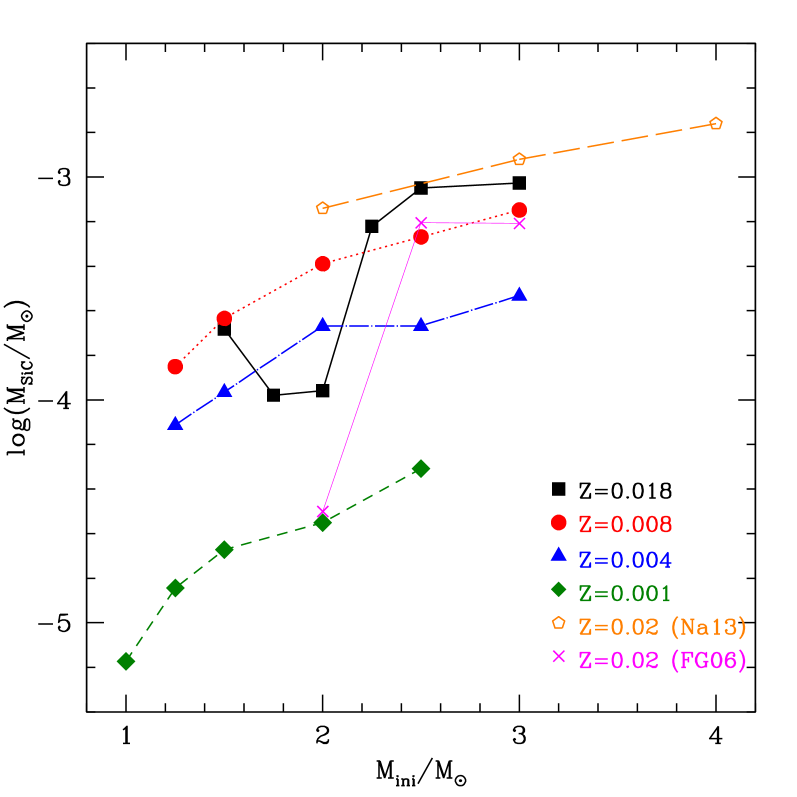
The mass of SiC produced is in the range . Although the abundance of the key species (silicon in this case) results to be proportional to the metallicity, this is not the case for . For , is comparable to what is found for the models, whereas for higher masses the SiC dust mass for is slightly larger than for lower- AGB stars. The reasons for this behaviour are the same as those illustrated above to explain the trend of carbon dust with metallicity. In addition, a significant fraction of the mass of the envelope is lost when the stars are still oxygen-rich, thus the mass lost by the star during the phase when SiC dust is formed is smaller. This effect partly counterbalances the higher silicon abundance present in the star.
For what concerns the relative contributions of solid carbon and SiC to the overall dust production by low-mass AGB stars, we find that the individual contributions of the two species are sensitive to the initial mass of the star. Stars with become carbon stars only in the very final AGB phases, with a surface C/O only slightly above unity (DC16; see also the top-left panel of Fig. 3). In these conditions, the excess of carbon with respect to oxygen is so small, that the masses of SiC and solid carbon are very similar. On the other hand, in stars with , we find that C/O and the amount of carbon not locked into CO molecules is sufficiently large to allow the formation of solid carbon in excess of SiC.
4.3 Comparison with other AGB dust yields
In this section we focus our attention on the comparison with different results on the AGB dust yields (i.e., the mass of the various dust species produced), obtained using the same methodology for the dust formation model but a different AGB phase description.
As stated previously, we use the same approach introduced for the first time by Ferrarotti & Gail (2006, hereinafter FG06) to describe the wind dynamics and dust production. FG06 base their modelling on a synthetic description of the AGB phase. The metallicity used by FG06 () is slightly higher than the value adopted here () but the difference is sufficiently small to allow a straight comparison of the results.
In Figs. 2 and 4 we show FG06’s dust yields, to allow a direct comparison with our results. The different parametrisation adopted to describe the TDU efficiency is likely the reason for the difference in the minimum mass reaching the C-star stage, which is 2 in FG06, compared to 1.5, found in the present work, for models of solar metallicity. A common behaviour of both sets of models is the increase in the amount of solid carbon and SiC produced with the initial mass. In the FG06 case larger quantities of solid carbon are found in the range of mass close to the lower threshold required to activate HBB; this is probably due to the larger number of thermal pulses experienced in the FG06 models, resulting in a larger surface carbon available to form carbon dust. Stars with initial masses lower than do not become carbon stars, and are responsible for production of silicates dust in the range .
For what concerns the massive star domain, FG06 assume that the HBB is active for . While the production of silicates is comparable with our results in the lower limit of this range of masses, for the most massive AGB stars the amount of silicates formed is a factor smaller that in the present models: this is due to the higher efficiency of the HBB process, in turn determined by the larger efficiency of the convective models adopted here. An additional difference between the present results and FG06 in the dust budget of massive stars is that in the latter models some carbonaceous dust is produced at the end of the AGB phase, owing to the effects of some late TDU events, after HBB is extinguished.
The same methodology introduce by FG06, and used in the present work, was used also by Nanni et al. (2013, hereafter Na13), to calculate the dust yields by AGB stars with solar chemistry. For the sake of clarity, we compare silicates total dust production to the low condensation temperature case (i.e. chemical sputtering case) adopted by Na13, which is the same approximation considered in the present work. Yet, Na13 state that low and high condensation temperature approaches reach approximately the same condensation degrees during the phase that dominate the total dust production.
The dust yields predicted by Na13 are shown in
Figs. 2 and 4.
An obvious difference is the threshold mass
that separates stars producing mainly carbonaceous dust from those producing
silicates and alumina dust. This mass limit is in the present
computation, while it is in Na13.
This dissimilarity stems from the different convection modelling. Our AGB computations are based on the Full Spectrum of Turbulence (FST) convective model (Canuto & Mazzitelli, 1991). As shown by Ventura & D’Antona (2005), the use of the FST modelling leads to very efficient HBB conditions, i.e. the minimum mass required to experience HBB in the FST model is significantly lower than for other AGB models in the literature (e.g., Karakas & Lugaro 2016).
For massive AGB stars with in the range , the amounts of alumina and silicates dust predicted by Na13 are approximately a factor of 2 higher than in our AGB models (see Fig. 2). This difference is mainly due to the different duration of the largest luminosity phase that is coupled with the maximum dust production phase. In Na13, this phase is a factor of longer than in our AGB models. In the case of alumina dust, the choice of the sticking coefficients also affect this difference. We use , while Na13 adopted a much higher value of .
For low-mass AGB stars, the mass of SiC is similar in the two studies, while the amount of carbon dust produced by our models is approximately a factor 2 larger than Na13. This is likely due to the different choice adopted for the fraction of seed nuclei with respect to the number density of hydrogen molecules (). We follow (Ferrarotti & Gail, 2006) and assume that , while Na13 assume that the number of seed particles relevant for the formation of carbon grains scales with C/O.
4.4 The total dust production from solar metallicity AGB stars
Fig. 5 shows the total dust mass produced by AGB stars of solar metallicity. In order to better understand the trend of the dust mass with metallicity, we also show the results from our previous works focused on lower- AGB stars (Ventura et al., 2012a, b; Di Criscienzo et al., 2013; Ventura et al., 2014).
The dependence of the dust mass produced on the initial stellar mass can be understood on the basis of the arguments presented earlier in this section and can be summarised as follows:
-
1.
In low-mass AGB stars, the total amount of dust produced (), composed of solid carbon and SiC, increases with the initial stellar mass. We find for , up to for . The reason for this is that the number of TDU events experienced increases with . Consequently, higher mass stars accumulate more carbon in the external regions, which favours the formation of carbon dust.
-
2.
For what concerns the dust composition, we find that for increasing the ratio between the mass of solid carbon and the mass of SiC becomes larger. This is because the amount of SiC formed, unlike carbon, is rather independent of the surface chemical composition, as the most relevant species for the formation of SiC is silicon.
-
3.
The AGB model forming the minimum amount of silicate dust, , has an initial mass . This is the lowest mass experiencing HBB, which destroys surface carbon, thus preventing the formation of carbonaceous dust. On the other hand, the production of silicates is small, because this star experiences a soft HBB during the AGB phase and the luminosity is below .
-
4.
For massive AGB/SAGB stars, the mass of dust formed increases with , ranging from the quantity given in the previous point to , for the most massive SAGB star with . This is because higher mass stars experience a stronger HBB, thus evolving at larger luminosities and mass-loss rates.
-
5.
For massive AGB/SAGB stars the majority of the dust formed is composed of silicates, with of alumina dust.
The dependence of dust production on the initial metallicity of massive AGB/SAGB stars is rather straightforward. Dust production increases with , because the initial mass fractions of the key elements relevant to the formation of silicates and alumina dust (i.e. silicon and aluminium, respectively) increase almost linearly with , and their abundance does not change during the AGB evolution. The trend of the dust mass with is not completely linear though, because lower- AGB stars experience a more efficient HBB, which, for the reasons given above, favours a more efficient formation of silicates and of .
For low-mass AGB stars, the dependence of dust production on the initial stellar metallicity is more tricky. In these stars most of the dust formed is composed of solid carbon, which is sensitive to the amount of carbon accumulated in the surface regions, as a consequence of repeated TDU episodes. Solar metallicity AGB stars produce, on average, a smaller quantity of dust compared to their lower metallicity counterparts. The reasons for this are twofold: a) the C-star stage is reached later in the AGB evolution, when a significant fraction of the envelope has been lost; b) the initial oxygen in the star is larger, thus a smaller quantity of carbon (in excess of oxygen) is available to form dust.
5 Conclusions
In this paper, we have completed the grid of ATON dust yields for AGB/SAGB stars
extending our previous calculations to solar metallicity stars. Our main results can
be summarised as follows.
The kind of dust
produced reflects a dichotomy (C-rich vs. O-rich) in the evolution of the
surface chemical composition, which depends on the initial stellar mass, .
In low-mass AGB stars, with , the surface chemical composition is altered by the several TDU episodes that eventually lead to the formation of a carbon star (C/O1). The formation of solid carbon and SiC grains takes place in the circumstellar envelope of these stars. The size of SiC grains formed keeps around m for the whole AGB life. However, the size of carbon grains increases with the increasing amount of carbon being accumulated in the surface regions. The carbon dust particles with the largest sizes, m, are formed in the very final evolutionary phases of AGB stars with . The mass of carbonaceous dust formed increases with the mass of the star, ranging from a few for , to for . In the lowest mass stars the dominant dust component is SiC, while in their more massive counterparts most of the dust produced is under the form of solid carbon.
Massive AGB/SAGB stars with experience HBB. In this case the formation of carbon stars is inhibited by the destruction of surface carbon via proton-capture reactions at the base of the convective envelope. The most relevant dust species formed in these stars are silicates and alumina dust. The latter is more stable than silicates, but the amount of dust that can be produced is severely limited by the scarcity of aluminium. Alumina grains grow until reaching dimensions of the order of m. Most of the dust produced by massive AGB/SAGB stars is under the form of silicates. The size reached by the dominant silicates grains, i.e. olivine, are in the range m. The mass of dust produced increases with because higher mass stars evolve on more massive degenerate cores and are exposed to stronger HBB conditions. We find for , up to a maximum of for . Silicates are the largely dominant dust species in all cases.
Previously computed ATON AGB models with dust formation have been able to explain and interpret photometric observations of evolved stars in several low-metallicity galaxies of the Local Group. The results of the present study will allow to extend these studies to evolved stellar populations in our Galaxy and another high-metallicity LG galaxies. In addition, the complete grid of dust and metal yields based ATON AGB/SAGB models with metallicity and initial mass will be a valuable tool for chemical evolution studies, allowing to estimate the contribution of intermediate mass stars to metal and dust enrichment on timescales Myr. In a more general context, the solar metallicity AGB dust yields will allow to compare the relative role of AGB and supernovae (SN) as stellar sources of dust over a wide range of metallicity, and to assess the contribution of AGB stars to the existing dust mass of the Milky Way, complementing the work that has already been done on the Magellanic Clouds.
Acknowledgments
DAGH was funded by the Ramón y Cajal fellowship number RYC201314182. DAGH and FDA acknowledge support provided by the Spanish Ministry of Economy and Competitiveness (MINECO) under grant AYA201458082-P. RS and RV acknowledge funding from the European Research Council under the European Unions Seventh Framework Programme (FP/2007-2013)/ERC Grant Agreement no. 306476. MDC acknowledges the contribution of the FP7 SPACE project ASTRODEEP (Ref. No. 312725), supported by the European Commission
References
- Bladh (2012) Bladh S., Höfner S.,2012, A&A, 546, A76
- Blöcker (1995) Blöcker T., 1995, A&A, 297, 727
- Blöcker & Schöenberner (1991) Blöcker T., Schöenberner D., 1991, A&A, 244, L43
- Bocchio et al. (2016) Bocchio M., Marassi S., Schneider R., Bianchi S., Limongi M., Chieffi A. 2016, A&A, 587, A157
- Bruno et al. (2016) Bruno, C. G. et al., 2016, Phys. Rev. Lett. 117, 142502
- Canuto & Mazzitelli (1991) Canuto V. M. C., Mazzitelli I., 1991, ApJ, 370, 295
- Cristallo et al. (2009) Cristallo S., Straniero O., Gallino R., Piersanti L., Dominguez I., Lederer M. T. 2009, ApJ, 696, 797
- Cristallo et al. (2015) Cristallo S., Straniero O., Piersanti L., Gobrecht D. 2015, ApJS, 219, 40
- Dell’Agli et al. (2014a) Dell’Agli F., García Hernández D. A., Rossi C., Ventura P., Di Criscienzo M., Schneider R. 2014a, MNRAS, 441, 1115
- Dell’Agli et al. (2014b) Dell’Agli F., Ventura P., García Hernández D. A., Schneider R., Di Criscienzo M., Brocato E., D’Antona F., Rossi C. 2014b, MNRAS, 442, L38
- Dell’Agli et al. (2015a) Dell’Agli F., Ventura P., Schneider R., Di Criscienzo M., García-Hernández D. A., Rossi C., Brocato E. 2015a, MNRAS, 447, 2992
- Dell’Agli et al. (2015b) Dell’Agli F., García-Hernández D. A., Ventura P., Schneider R., Di Criscienzo M., Rossi, C. 2015b, MNRAS, 454, 4235
- Dell’Agli et al. (2016) Dell’Agli F., Di Criscienzo M., Boyer M. L., García-Hernández D. A. 2016, MNRAS, 460, 4230
- Di Criscienzo et al. (2013) Di Criscienzo M., Dell’Agli F., Ventura P., Schneider R., Valiante R., La Franca F., Rossi C., Gallerani S., Maiolino, R., 2013, MNRAS, 433, 313
- Di Criscienzo et al. (2016) Di Criscienzo M., Ventura P., García-Hernández D. A., et al. 2016, MNRAS, 462, 395
- Doherty et al. (2014) Doherty C. L., Gil-Pons P., Lau H. H. B., Lattanzio J. C., Siess L. 2014, MNRAS, 437, 195
- Ferrarotti & Gail (2001) Ferrarotti A.D., Gail H.P., 2001, A&A, 371, 133
- Ferrarotti & Gail (2002) Ferrarotti A.D., Gail H.P., 2002, A&A, 382, 256
- Ferrarotti & Gail (2006) Ferrarotti A.D., Gail H.P., 2006, A&A, 553, 576
- Gail & Sedlmayr (1985) Gail H. P., Sedlmayr E., 1985, A&A, 148, 183
- Gail & Sedlmayr (1998) Gail H.P., Sedlmayr E., 1998, Faraday Discussions, 109, 303
- Gail & Sedlmayr (1999) Gail H. P., Sedlmayr E., 1999, A&A, 347, 594
- García-Berro & Iben (1994) García-Berro E., Iben I.J., 1994, ApJ, 434, 306
- García-Berro et al. (1997) García-Berro E., Ritossa C., Iben I.J., 1997, ApJ, 485, 765
- Grevesse & Sauval (1998) Grevesse N., Sauval A. J, 1998, SSrv, 85, 161
- Groenewegen (2004) Groenewegen M. A. T., 2004, A&A, 425, 595
- Groenewegen et al. (1998) Groenewegen M. A. T., Whiteloak P. A., Smith C. H., Kerschbaum F., 1998, MNRAS, 293, 18
- Herwig (2000) Herwig F., 2000, A&A, 360, 952
- Javadi et al. (2011a) Javadi A., van Loon J. Th., Mirtorabi M. T., 2011a, MNRAS, 411, 263
- Javadi et al. (2011b) Javadi A., van Loon J. Th., Mirtorabi M. T., 2011b, MNRAS, 414, 3394
- Javadi et al. (2015) Javadi, A., van Loon, J. Th., Khosroshahi, H., Mirtorabi, M. T. 2015, MNRAS, 432, 2824
- Jones et al. (2015) Jones, O. C., McDonald, I., Rich, R. M., Kemper, F., Boyer, M. L., Zijlstra, A. A., Bendo, G. J. 2015, MNRAS, 446, 1584
- Karakas (2010) Karakas A. I. 2010, MNRAS, 403, 1413
- Karakas (2014) Karakas A. I. 2014, MNRAS, 445, 347
- Karakas & Lattanzio (2014) Karakas A. I., Lattanzio J. C. 2014, PASA, 31, e030
- Karakas & Lugaro (2016) Karakas A. I., Lugaro M. 2016, 825, 26
- Knapp (1985) Knapp G. R. 1985, ApJ, 293, 273
- Lugaro et al. (2017) Lugaro et al., 2017, Nature Astronomy, 1, 0027
- McQuinn et al. (2007) McQuinn K. B. W. et al., 2007, ApJ, 664, 850
- Mancini et al. (2015) Mancini M., Schneider R., Graziani L., Valiante R., Dayal P., Maio U., Ciardi B., Hunt L. K. 2015, MNRAS, 451, L70
- Mancini et al. (2016) Mancini M., Schneider R., Graziani L., Valiante R., Dayal P., Maio U., Ciardi B. 2016, MNRAS, 462, 3130
- Marassi et al. (2014) Marassi S., Chiaki G., Schneider R., Limongi M., Omukai K., Nozawa T., Chieffi A., Yoshida N. 2014, ApJ, 794, 100
- Marassi et al. (2015) Marassi S., Schneider R., Limongi M., Chieffi A., Bocchio M., Bianchi S. 2015, MNRAS, 454, 4250
- Marigo (2002) Marigo P., 2002, A&A, 387, 507
- Marigo & Aringer (2009) Marigo P., Aringer B., 2009, A&A, 508, 1538
- Marigo et al. (2016) Marigo P., Ripamonti E., Nanni A., Bressan A., Girardi L. 2016, MNRAS, 456, 23
- Mattsson et al. (2010) Mattsson L., Wahlin R., Höfner S., Eriksson K., 2010, A&A, 509, 14
- Mould et al. (2008) Mould, J., Barmby, P., Gordon, K., Willner, S. P., Ashby, M. L. N., Gehrz, R. D., Humphreys, R., Woodward, C. E. 2008, ApJ, 687, 230
- Nanni et al. (2013) Nanni A., Bressan A., Marigo P., Girardi L., 2013, MNRAS, 434, 2390
- Nanni et al. (2014) Nanni A., Bressan A., Marigo P., Girardi L. 2014, MNRAS, 438, 2328
- Nanni et al. (2016) Nanni A., Marigo P., Groenewegen M. A. T., Aringer B., Girardi L., Pastorelli G., Bressan A., Bladh S. 2016, MNRAS, 462, 1215
- Paczynski (1970) Paczynski B., 1970, Acta Astron., 20, 47
- Renzini & Voli (1981) Renzini A., Voli M., 1981, A&A, 94, 175
- Schneider et al. (2014) Schneider R., Valiante R., Ventura P., dell’Agli F., Di Criscienzo M., Hirashita H., Kemper F. 2014, MNRAS, 442, 1440
- Sharp & Huebner (1990) Sharp C. M., Huebner W. F., 1990, ApJS, 72, 417
- Siess (2006) Siess, L., 2006, A&A, 448, 717
- Siess (2007) Siess, L., 2007, A&A, 476, 893
- Siess (2009) Siess, L., 2009, A&A, 497, 463
- Siess (2010) Siess, L., 2010, A&A, 512, A10
- Takigawa et al. (2015) Takigawa A., Tachibana S., Nagahara H. and Ozawa K., 2015, ApJS., 218, 1
- Valiante et al. (2009) Valiante R., Schneider R., Bianchi S., Andersen A. C. 2009, MNRAS, 397, 1661
- Valiante et al. (2011) Valiante R., Schneider R., Salvadori S., Bianchi S., 2011, MNRAS, 416, 1916
- Ventura & D’Antona (2005) Ventura P., D’Antona F., 2005, A&A, 431, 279
- Ventura & D’Antona (2009) Ventura P., D’Antona F., 2009, MNRAS, 499, 835
- Ventura & D’Antona (2011) Ventura P., D’Antona F., 2011, MNRAS, 410, 2760
- Ventura et al. (2012a) Ventura P., Di Criscienzo M., Schneider R., Carini R., Valiante R., D’Antona F., Gallerani S., Maiolino R., Tornambé A., 2012, MNRAS, 420, 1442
- Ventura et al. (2012b) Ventura P., Di Criscienzo M., Schneider R., Carini R., Valiante R., D’Antona F., Gallerani S., Maiolino R., Tornambé A., 2012, MNRAS, 424, 2345
- Ventura & Marigo (2009) Ventura P., Marigo P., 2009, MNRAS, 399, L54
- Ventura & Marigo (2010) Ventura P., Marigo P., 2010, MNRAS, 408, 2476
- Ventura et al. (2000) Ventura P., D’Antona F., Mazzitelli I., 2000, A&A, 363, 605
- Ventura et al. (1998) Ventura P., Zeppieri A., Mazzitelli I., D’Antona F., 1998, A&A, 334, 953
- Ventura et al. (2013) Ventura P., Di Criscienzo M., Carini R., D’Antona F., 2013, MNRAS, 431, 3642
- Ventura et al. (2014) Ventura P., Dell’Agli F., Schneider R., Di Criscienzo M., Rossi C., La Franca F., Gallerani S., Valiante R. 2014, MNRAS, 439, 977
- Wachter et al. (2002) Wachter A., Schröder K. P., Winters J. M., Arndt T. U., Sedlmayr E., 2002, A&A, 384, 452
- Wachter et al. (2008) Wachter A., Winters J. M., Schröder K. P., Sedlmayr E., 2008, A&A, 486, 497
- Wallerstein & Knapp (1998) Wallerstein G., Knapp G. R., 1998, ARA&A, 36, 369