Ab-initio prediction of the high-pressure phase diagram of BaBiO3
Abstract
BaBiO3 is a well-known example of a 3D charge density wave (CDW) compound, in which the CDW behavior is induced by charge disproportionation at the Bi site. At ambient pressure, this compound is a charge-ordered insulator, but little is known about its high-pressure behavior. In this work, we study from first-principles the high-pressure phase diagram of BaBiO3 using phonon modes analysis and evolutionary crystal structure prediction. We show that charge disproportionation is very robust in this compound and persists up to 100 GPa. This causes the system to remain insulating up to the highest pressure we studied.
pacs:
62.50.-p, 71.20.Be, 71.30.+h, 71.45.LrI Introduction


Transition metal oxide perovskites are currently a subject of intense study, since they exhibit many interesting properties which makes them attractive for both fundamental and applied research. Ferroelectricity Cohen (1992), high-Tc superconductivity, charge ordering, colossal magnetoresistance Raveau et al. (1998) are some of the most intriguing examples. One of the most distinctive materials of this family is BaBiO3Cox and Sleight (1976); Sleight (2015), which is a charge-ordered insulator and becomes superconducting upon dopingUchida et al. (1987); Cava et al. (1988). Recent studies have shown that also at reduced dimensionality BaBiO3 exhibits several remarkable properties: experimental investigation of suppression of structural distortion in thin films Inumaru et al. (2008) and suppression of the charge density wave (CDW) in the BaBiO3 films Kim et al. (2015), as well as theoretical predictions of topological phasesYan et al. (2013) and 2D electron gas at the surface Vildosola et al. (2013) were recently reported in the literature.
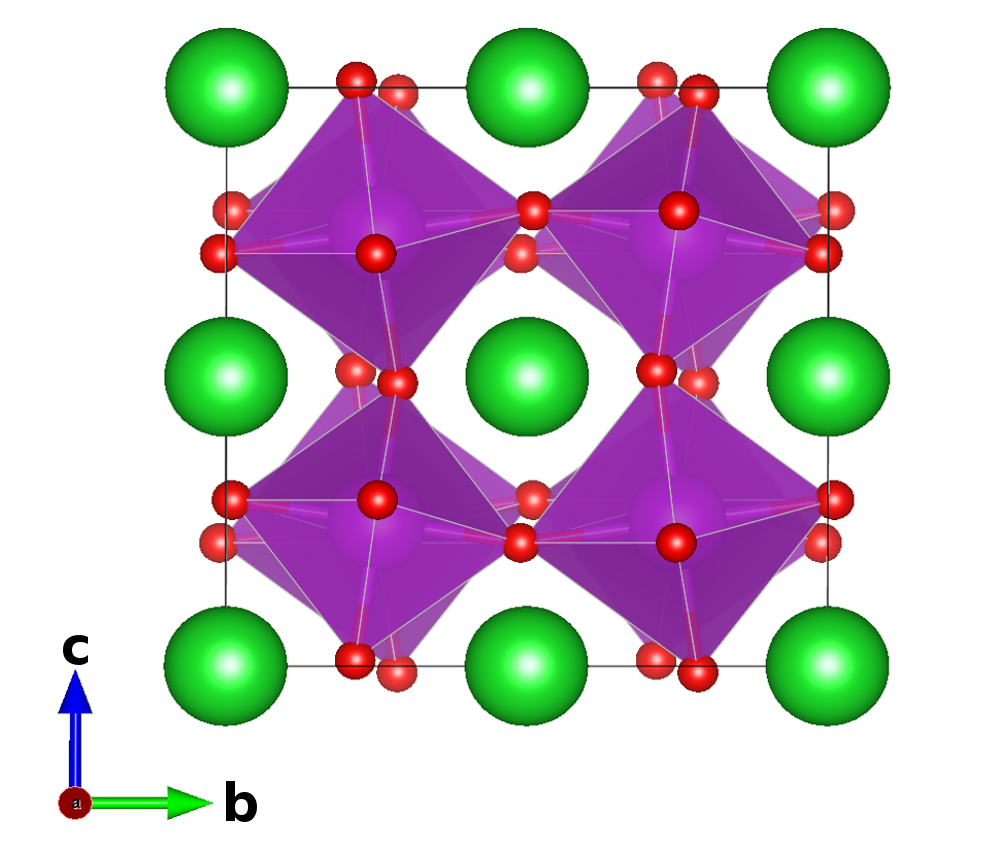
In this compound behaves as mixed-valence element and can occur either in formal or oxidation state. The BaBiO3 compound can thus be seen as a perovskite where is and is . Although the oxidation state was never observed in any other compounds, a hypothetical should have an ideal perovskite cubic – Pm3̄m – structure (Fig. 1LABEL:sub@fig:BBO_cubic) and should be a metal.The mixed valence state of and the periodical arrangement of atoms leads to formation of a CDW state. This has two consequences: the different attraction strength of oxygen to the two types of Bi leads to a chess-pattern breathing distortion of the Bi-O octahedra; in turn, this CDW breathing distortion splits the antibonding Bi(s)-O(p) antibonding state and establishes an insulating ground stateFranchini et al. (2009); Foyevtsova et al. (2015).
Upon hole doping BaBiO3 undergoes an insulator to metal transition and becomes a superconductor; superconducting Tc’s up to 13 K were reported for BaPb1-xBixO3Uchida et al. (1987), and up to 34 K for Ba1-xKxBiO3Cava et al. (1988). The suppression of the CDW state upon doping, and the of superconductivity, have been intensely debated in literature. Zeyher and Kunc (1990); Blaha et al. (1994); Liechtenstein et al. (1991); Kunc et al. (1991); Meregalli and Savrasov (1998); Franchini et al. (2009, 2010); Korotin et al. (2012); Bazhirov et al. (2013); Yin et al. (2013); Foyevtsova et al. (2015). Only recently, with the adoption of post-DFT techniques, it was possible to obtain a consistent description of the whole phase diagram.
In many compounds, high pressure is a viable alternative to doping to tune the material properties. In particular, this has recently been exploited in several 2D transition metal dichalchogenides to study the interplay of CDW and superconductivity. For instance, it was demonstrated that in pristine 1T-TiSe2 Kusmartseva et al. (2009) and 2H-NbSe2Leroux et al. (2015) pressure induces a quantum melting of the CDW. It is extremely intriguing to investigate whether a similar behavior could occur in BaBiO3, i.e. whether pressure could be used to suppress the three-dimensional CDW insulating state and promote a metallic, superconducting state. Based on simple theoretical arguments, all insulators should become metallic at high enough pressure (or density), due to increasing hybridization and higher bandwidth. It is reasonable therefore to expect that, under pressure, BaBiO3 should undergo a structural transition to the ideal perovskite structure, becoming metallic by band overlap. However, this picture may be too naive.
In fact, in the last two decades the study of matter at extreme conditions has shown that even simple elements exhibit a physical and chemical behavior, which cannot be explained in these simple terms. For example, simple free-electron metals such as lithium and sodium become insulating under pressure; Hanfland et al. (2000); Ma Yanming et al. (2009) hydrides, which form insulating molecular crystals at ambient pressure, can become metallic, and exhibit superconductivity with ’s as high as 200 K; Duan et al. (2014); Drozdov et al. (2015a, b); Heil and Boeri (2015); Flores-Livas, José et al. (2016); Bernstein et al. (2015); Errea et al. (2015); Flores-Livas et al. (2016); Shamp et al. (2016); Fu et al. (2016); Kokail et al. (2016) even higher ’s have been predicted for elemental hydrogen, above the Wigner-Huntington transition. Wigner and Huntington (1935); Cudazzo et al. (2008); Borinaga et al. (2016); Dias and Silvera (2017) Explaining the high-pressure behavior of solids thus requires first an accurate understanding of the structural modifications induced by pressure.
The aim of this work is to investigate the possibility of suppressing the CDW state and induce an insulator to metal transition in BaBiO3 under pressure, performing a theoretical study of its crystal and electronic structure. Since the available experimental information is extremely limited, we are using two structural prediction techniques to determine the possible high-pressure phases. The first is based on group theoretical analysis of irreducible representations of unstable phonon modes using the ISOTROPY software suite Stokes et al. (1991) and the second is based on using evolutionary algorithms approaches as implemented in the USPEX package Oganov and Glass (2006). Our calculations show that charge ordering remains up to 100 GPa and the system remains insulating in this pressure range.
To investigate the electronic properties we are using a hybrid Hartree-Fock/Density Functional Theory (DFT) calculation with the HSE (Heyd-Scuseria-Ernzerhof) exchange-correlation functionalHeyd et al. (2003). In fact, the role of electronic correlations on the accurate description of the CDW was discussed in many papers and it was shown that it is essential to use post-DFT approaches to obtain a proper description of the electronic structure of this system Korotin et al. (2012); Yin et al. (2013); Franchini et al. (2009, 2010).
This paper is organized as follows: in Section II we describe the results of our ab-initio calculations starting with our prediction for the high-pressure phase diagram (Subsection II.1), followed by the description of the phonon mode analysis in Subsection II.2. We present the results obtained with ab-initio evolutionary prediction method in Subsection II.3 and electronic properties of the predicted ground-state structures are analyzed in Subsection II.4. The main conclusions of this work are summarized in Subsection III. Computational details are described at the end of the paper in Section IV.

II Results
BaBiO3 was synthesized for the first time in 1963 Scholder et al. (1963) and was identified as a perovskite but it was hard to precisely determine the right structure: rhombohedral, orthorhombic, monoclinic or triclinic symmetries were reported by various groupsCox and Sleight (1976); Nakamura et al. (1971); Arpe and Müller-Buschbaum (1977). It was finally established that at room temperature and ambient pressure the structure is monoclinic (C12m̄1) – Fig. 1LABEL:sub@fig:BBO_mono. This structure can be described as a perovskite with two type of distortions: breathing and tilting distortions of Bi-O octahedra. In the breathing distortion the octahedra alternate in size, while upon tilting the octahedra are rotated. The role of the breathing and tilting distortions has been widely discussed in literature. In particular, DFT calculations reported conflicting resultsZeyher and Kunc (1990); Liechtenstein et al. (1991); Blaha et al. (1994); Liechtenstein et al. (1991); Kunc et al. (1991). Only recently the use of post-DFT methods has permitted to reproduce the experimental findings correctlyFranchini et al. (2009, 2010); Korotin et al. (2012).
II.1 Predicted Phase Diagram
Fig. 2 shows our predicted high-pressure phase diagram 111To model the effect of pressure on the system we have used volume associated to a given pressure by doing fixed volume relaxation using VASP and allowing atomic positions and unit cell shape to vary for several pressures.. The system undergoes three structural phase transitions and remains insulating up to 100 GPa. Fig. 1 shows the structures which are most relevant for the discussion.
As a reference structure we chose the monoclinic (C12m̄1) BaBiO3 structure, which was determined by the experiment at the ambient pressure. The structures with after the title are the best structures obtained using evolutionary crystal structure prediction method. They become energetically favorable in the high pressure region. The structures with are obtained using the group-theoretical approach for crystal structure prediction. At high pressure these structures are energetically more favorable than our reference (C12m̄1) structure, but are way behind the structures obtained using the evolutionary method. The P-Perovskite is a post-perovskite structure that we added into consideration by chemical intuition. This structure was obtained by Oganov et al. for MgSiO3 at extreme pressure and has 20 atoms in the unit cell Oganov and Ono (2004).
Following the lowest enthalpy path in our calculated phase diagram, we find that a first transition from the monoclinic (C12m̄1, see Fig. 1LABEL:sub@fig:BBO_mono, 10 atoms in the unit cell) to triclinic (P1̄, see Fig. 1LABEL:sub@fig:BBO_triclinic, 40 atoms in the unit cell) structure occurs at about 20 GPa. The P1̄ structure is a distortion of the C12m̄1 structure with one additional tilting axis. A transition from triclinic (P1̄) to clustered monoclinic (C12m̄1C, Fig. 1LABEL:sub@fig:BBO_clustered, 40 atoms in the unit cell) occurs at about 28 GPa. We call this structure clustered because it has “domains” created by shearing parts of the original structure. The last transition is at about 87 GPa, where the clustered monoclinic (C12m̄1C) is transformed to highly distorted structure with no symmetry (P1, see Fig. 1LABEL:sub@fig:BBO_dist1, 20 atoms in the unit cell). We will refer in text to it as Dist1.
The experimental information about BaBiO3 at high pressure is extremely scarce and limited to GPaSugiura and Yamadaya (1984, 1986). Unfortunately, the experimental resolution was not enough to have a full refinement of crystal structure. An anomaly at about 4 GPa was reported, at which the bulk modulus decreases and this was attributed to the change of the tilt system (due to additional type of octahedra tilting). Moreover it was reported that the system remains insulating up to at least 10 GPa. Our results are consistent with the measurements that BaBiO3 is an insulator in this pressure range. However, we cannot reproduce the anomaly at 4 GPa.
Before discussing in detail the crystal and electronic structure across the phase diagram, we will illustrate the details of our structural search methods.
II.2 Phonon Mode Analysis

| P=0 GPa | P=100 GPa | |||||
| # | M | R | M | R | X | |
| 1 | M3+ | R1+ | M3+ | |||
| 2 | X5- | |||||
| 3 | 4- | M5- | R4+ | |||
| 4 | R4+ | M3- | ||||
| 5 | ||||||
| 6 | 5- | |||||
The group-theoretical method has been successfully used to identify and predict structural distortions in a variety of perovskites Howard and Stokes (2005); Balachandran and Rondinelli (2013). A powerful extension is to combine this method with the results of a phonon mode analysis of the parent structure He and Franchini (2014). For BaBiO3 the starting point is the ideal cubic perovskite structure – Fig. 1LABEL:sub@fig:BBO_cubic. It has a P3m̄3 (cubic) symmetry with 5 atoms in the unit cell; it is a metal, since no charge disproportionation is possible in this case. The six O nearest neighbors of Bi form a perfect octahedron. This octahedron can be distorted in several ways and there are two kinds of distortions usually present in real perovskite systems: breathing and tilting (see Fig. 3).
A breathing distortion means that some O atoms move closer or further away from the Bi atom, which is located at the center of the octahedron. Octahedra are coupled to each other and the breathing of one of them creates an opposite breathing on its neighbors. There are different kinds of breathing distortions depending on which and how many pairs of O are distorted. In the monoclinic structure of BaBiO3 all O atoms are involved in the breathing distortion and the overall picture is a 3D chess pattern of octahedra with alternating sizes. A tilting distortion is the rotation of an octahedron around a tilting axis. Neighboring octahedra in the plane normal to the tilting axis are coupled and rotate in the opposite direction. Octahedra in adjacent planes may rotate in the same (in-phase rotation) or in the opposite direction (antiphase rotation). The latter is present in monoclinic BaBiO3.
The ideal cubic perovskite is dynamically unstable at ambient pressure and room temperature, and the analysis of unstable phonon modes gives an insight of which distortions correspond to a lowering of the energy of the system and thus allow to predict more favorable structures. This can be achieved by computing the phonon dispersion relations and the corresponding eigenvectors. Eigenvectors with imaginary eigenvalues represent the direction of atomic displacements that lead to a decrease in energy. The stable structure can then be obtained following the most favorable distortion, which may be a linear combination of unstable phonon eigenvectors. The space of possible combinations can be reduced using the group-theoretical method and the unstable phonon modes mapping on the corresponding irreducible representations.
We calculated the phonon dispersion relations and the corresponding phonon eigenvectors for BaBiO3 in the ideal cubic perovskite structure 222Results are available in the supplemental material using the Phonopy package Togo and Tanaka (2015) and classified unstable eigenvectors with the corresponding irreducible representations. We first tested our approach at ambient pressure, and the results we obtained are consistent with the experimental structure (see below). After that, the investigation of stability of modes was repeated for several pressures in the range from 0 to 100 GPa (see Fig. 1 in supplemental material); the results for 0 GPa and 100 GPa pressure are summarized in Table 1.
At ambient pressure our result is consistent with the experimentally reported structure, namely monoclinic BaBiO3, since this structure can be obtained combining a breathing distortion with irreducible representation R1+ and the R4+ irreducible representation tilting () distortion, which are both present in the results of our analysis. The M3+ irreducible representation is an in-plane breathing distortion, which is not present in monoclinic BaBiO3 because the R1+ breathing is more favorable.
| (Å) | (deg) | V0 (Å3) | |
|---|---|---|---|
| PBE | 0.074 | 11.97 | 85.92 |
| HSE | 0.096 | 10.95 | 82.67 |
| PBE Franchini et al. (2010) | 0.07 | 12.1 | 85.76 |
| HSE Franchini et al. (2010) | 0.09 | 11.9 | 82.10 |
| Experiment Cox and Sleight (1976) | 0.09 | 10.1 | 82.11 |
In Table 2 we report the values of the breathing distortion (), the tilting angle () and equilibrium volume () for the ambient pressure structure measured by experiment and calculated using both PBE (Perdew-Burke-Ernzerhof) exchange-correlation functional in the anzatz of the Generalized Gradient Approximation (GGA) and HSE functionals. HSE gives a more accurate description of the structure, and reproduces correctly the electronic properties: monoclinic BaBiO3 is a charge ordered insulator with a bandgap of about 0.8 eV, while in GGA it is a zero-gap semiconductor. Although our calculations predict a transition from the monoclinic to the triclinic structure already at around 20 GPa, we followed the evolution of the monoclinic structure to high pressure to see whether the monoclinic distortions are suppressed. We find that the distortions are preserved under pressure and the tilting angle is proportional to pressure. Thus, the CDW is very robust in this compound and is not suppressed under pressure. Up to about 85 GPa the bandgap increases but afterwards its value decreases and the structure becomes a semi-metal (the related information is provided in supplemental material in Fig. 2).
There are two regions were a substantial change in stability of the phonon modes takes place: at about 30 GPa the R1+ mode become stable and at about 70 GPa the M3- and M5- modes become unstable (for the details see Fig. 1 in supplemental material). We constructed our pool of structures using the unstable modes at 100 GPa, as this is the highest pressure we are interested in and unstable modes at lower pressures are a subset of these. In particular, we have used the M3+, M5- and R4+ irreducible representations to construct our prediction for structures at high pressure (100 GPa) using a group-theoretical approach. In total 17 structures were investigated with 10, 20 and 40 atoms in the unit cell (see Table V in supplemental material for irreducible representations and order parameters used to obtain these structures). The structures P4m̄bm, I4m̄bm and I4m̄bmB (see the Fig. 2) are the best obtained by this method followed by VASP relaxations. P4m̄bm is obtained from the ideal perovskite structure by applying in-phase tilting ( in Glazer notation Glazer (1975)) and I4m̄bm by antiphase tilting (). I4m̄bmB is equivalent to I4m̄bm with an additional in-plane breathing distortion. These three structures are metals, but they are around 7 to 13.5 eV higher in enthalpy with respect to the ground state at 100 GPa, and thus very unlikely to be observed in experiments.
II.3 Ab-initio evolutionary prediction
We performed ab-initio evolutionary algorithms calculations at fixed composition for structures with 10, 20 and 40 atoms in the unit cell corresponding to 2, 4 and 8 formula units (f.u.) respectively. The 10 atoms 0 GPa calculation was used to test the reliability of the method. The structure we obtained for this run is consistent with the experiment. Calculations with 10, 20 and 40 atoms were made at 50 and 100 GPa. Up to 5-10 best structures from each run were chosen for more accurate relaxations to obtain the final ranking of the energies and were relaxed for various pressures in the pressure range from 0 to 100 GPa using fixed volume relaxation allowing cell shape to change but with the symmetry fixed to obtain the equation of state.
The analysis of phonon modes for the monoclinic structure indicates a possible structural transition in the range of 25-30 GPa. To check this region more carefully we performed additional calculations at 25 GPa for structures with 20 and 40 atoms in the unit cell, and 30 GPa for structures with 10 atoms in the unit cell. As a result, we found a triclinic P1̄ structure that is stable in the 20-28 GPa pressure region (Fig. 1c). As already mentioned, the evolutionary algorithm approach was able to find the structures that are the energetically most stable ones at high pressures (i.e. more stable than the best SA ones). These are triclinic (P1̄), “clustered” (C12m̄1C) and distorted (P1). There are both metals and insulators present in the pool of all structures obtained by these structural search calculations, but the most energetically favorable are always insulating and strongly disordered.
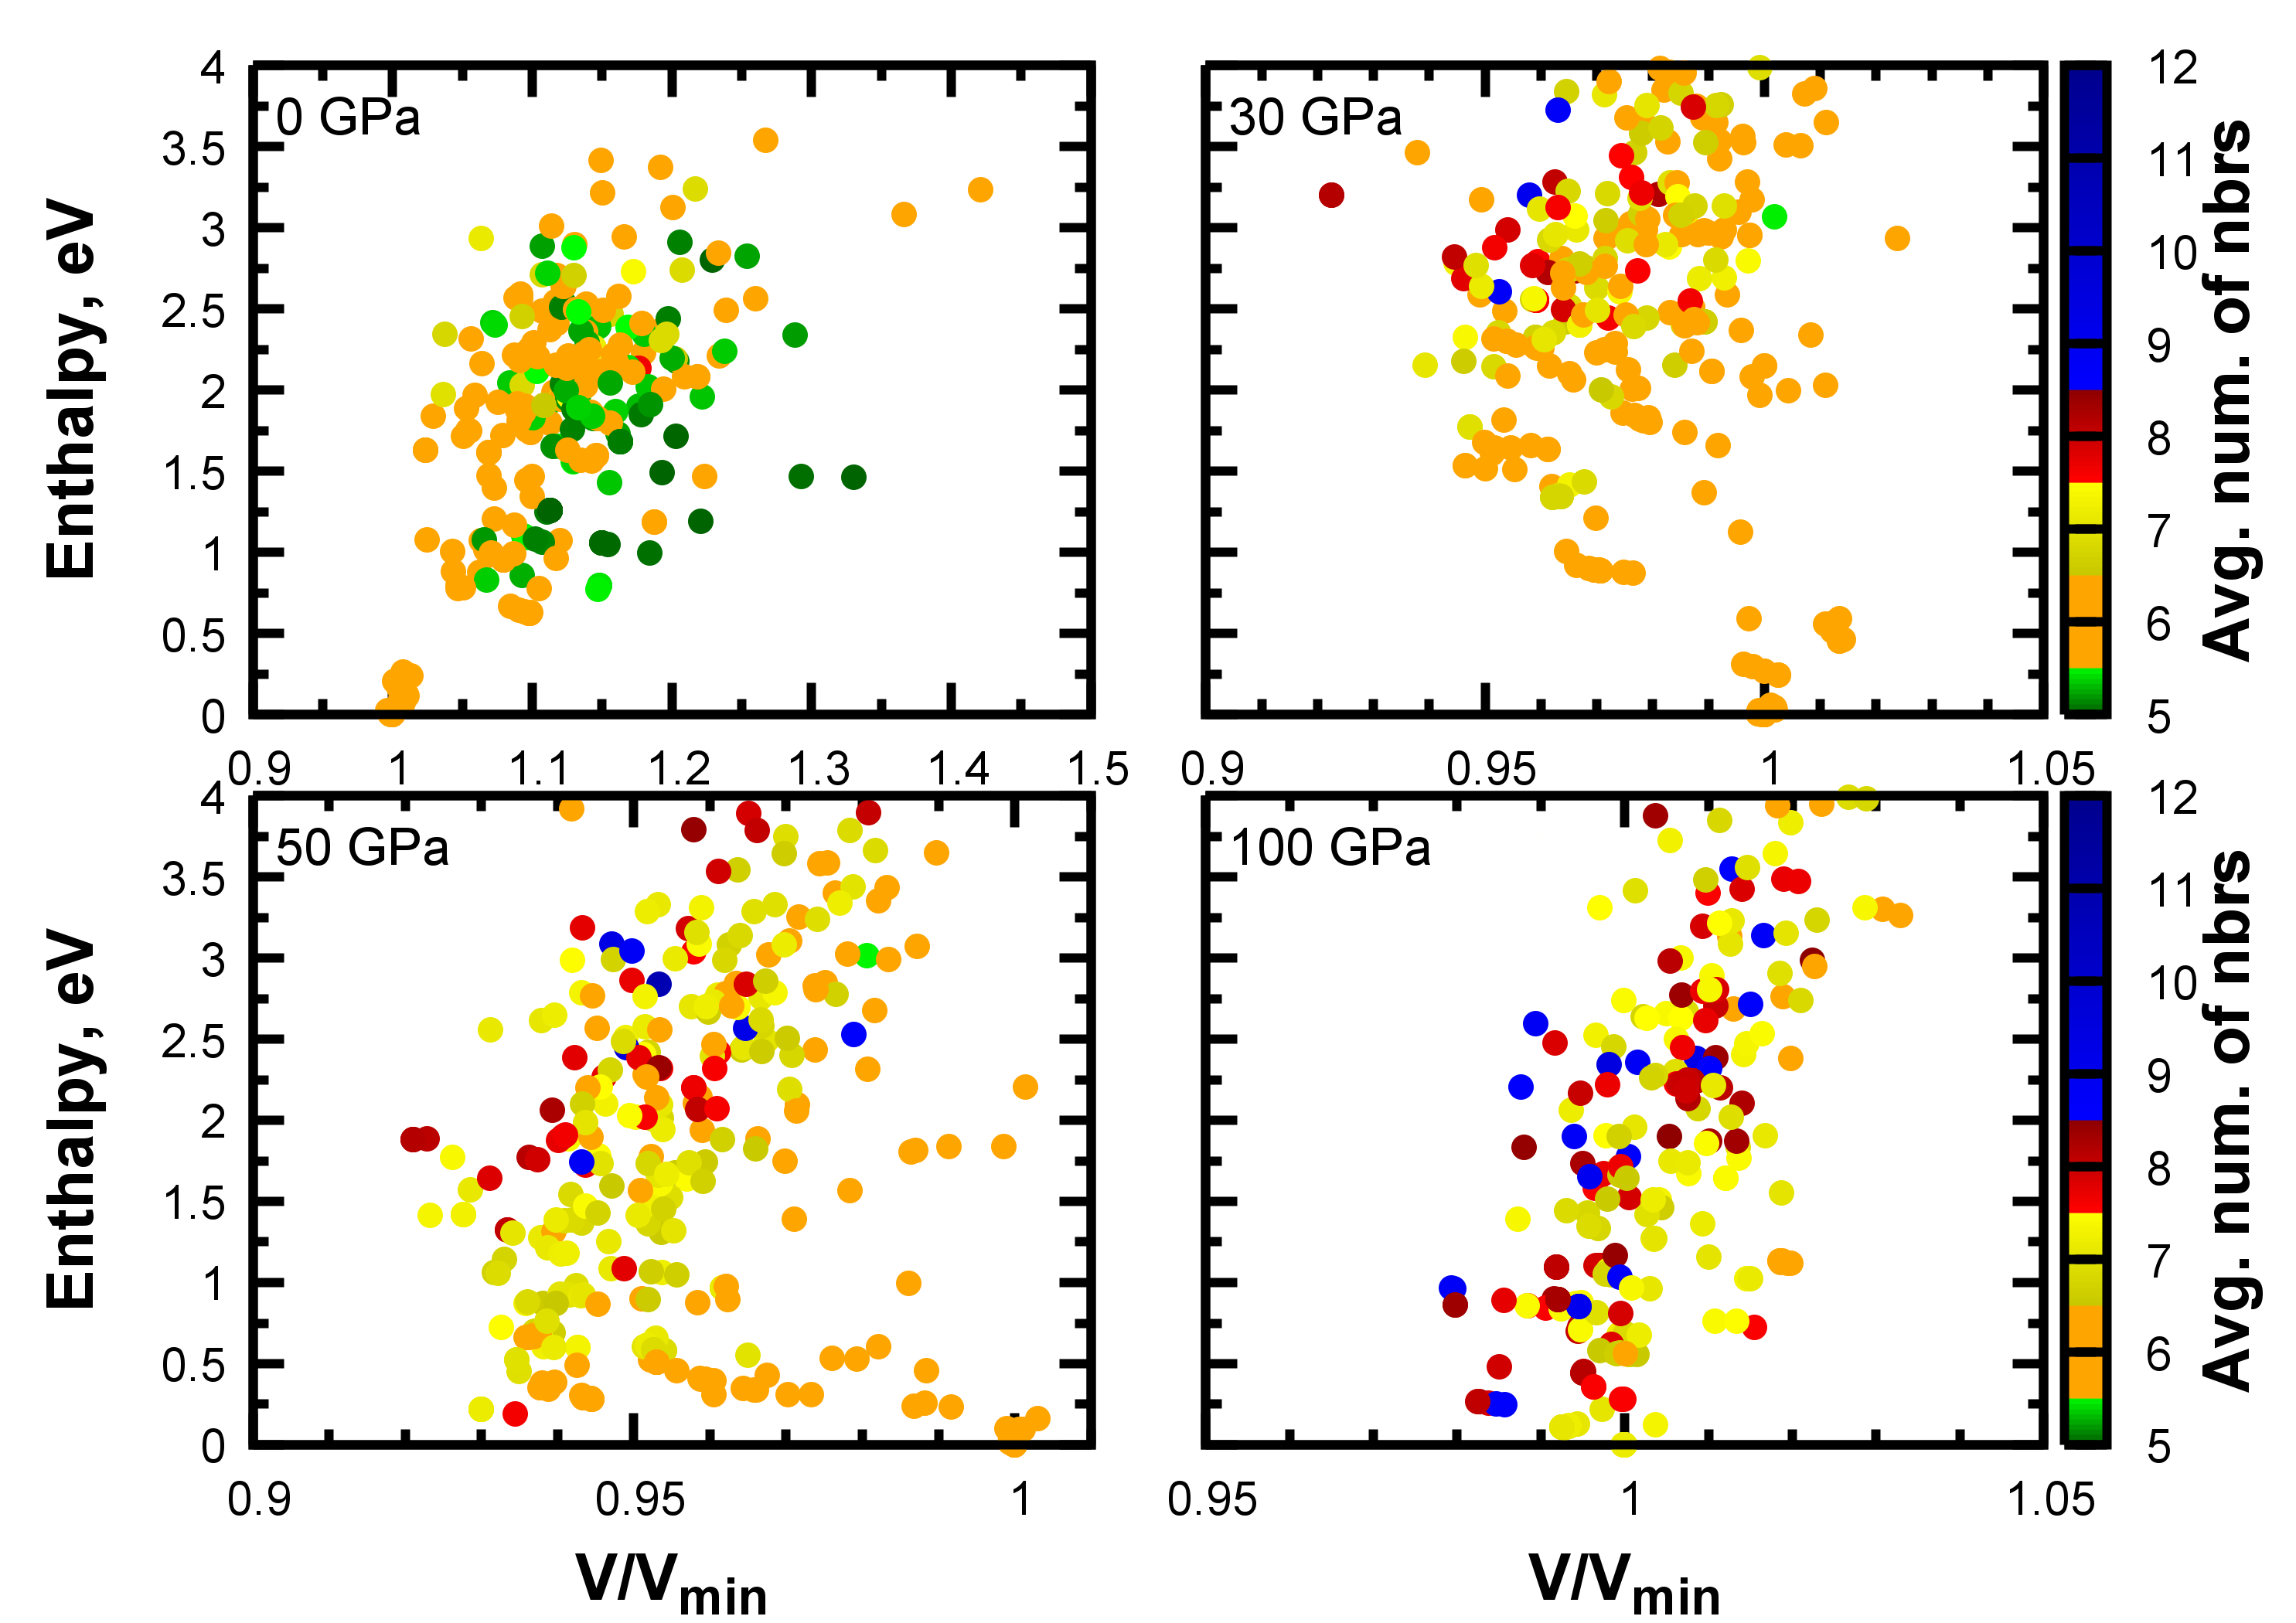
The evolutionary algorithms calculations thus show that BaBiO3 has a tendency to become more distorted when pressure is increased, destabilizing the perovskite environment without suppressing the charge disproportionation. In order to understand and visualize this tendency, we have performed an additional analysis on the pool of all 2 f.u. BaBiO3 structures predicted by the evolutionary algorithm approach. The main idea of this analysis is to visualize the change in bonding environment induced by pressure, following the change in the average number of oxygen neighbors for the Bi atoms. In an ideal perovskite this number is six; significant deviations from this value indicate strong distortions. The result of this analysis using the Chemenv module from Pymatgen package Ong et al. (2013); che ; Pap is presented in Fig. 4 (for the details see subsection “C. Neighbors analysis” in supplemental material). Each structure at the corresponding pressure is represented by a dot, with the color indicating the average number of neighbors of Bi and the coordinates describing the volume and enthalpy of the structure. The volume is rescaled to the volume of the ground-state structure for a given pressure () and the enthalpy is given with respect to the enthalpy of the ground-state structure. As expected, on average at ambient pressure there are six O atoms in Bi environment and this number increases with increasing pressure. The plot thus shows that there is a general trend for BaBiO3 to break the perovskite structure and become more distorted.
II.4 Electronic properties
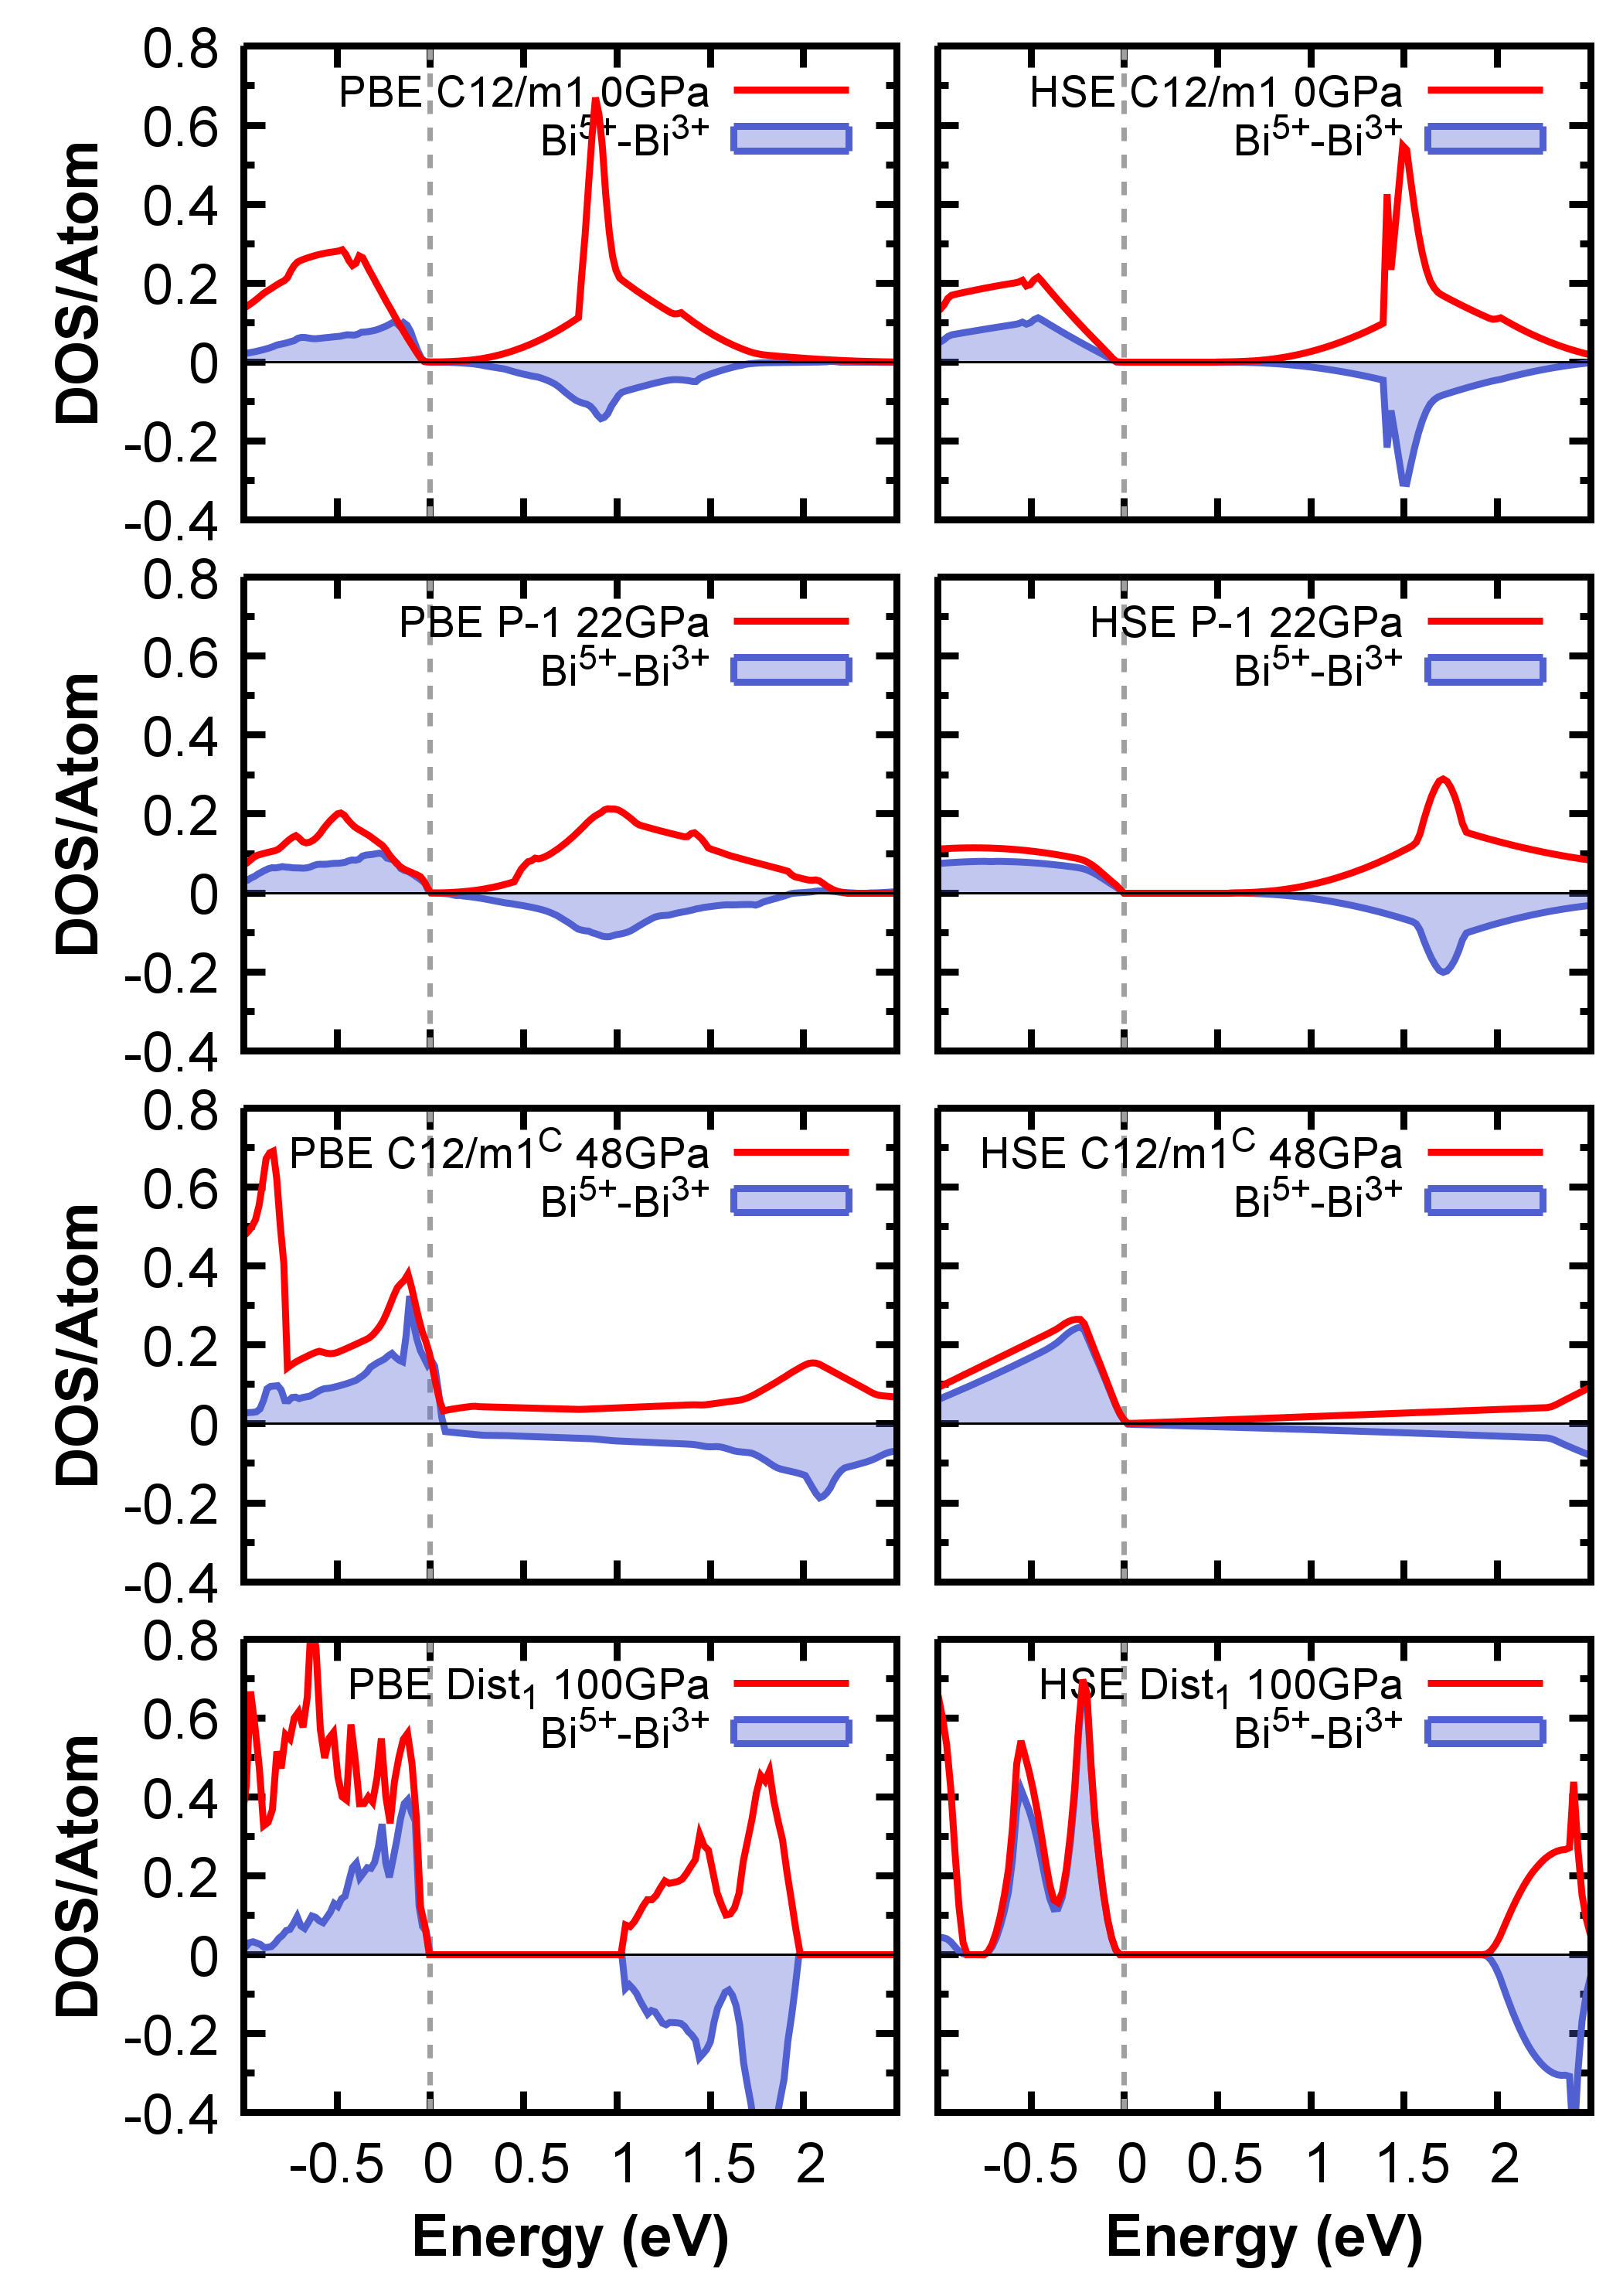
We analyzed the electronic properties of all four ground-state structures using both PBE and HSE. Our calculations show that all structures are insulating (see Fig. 5); the tendency is to become more insulating with increasing pressure. Only the C12m̄1C structure is metallic at the PBE level but on the HSE level opens a gap. Here the use of HSE functional is important as PBE underestimates the band gap or predicts the structure to be a metal while actually it is an insulatorFranchini et al. (2010). Analyzing the partial DOS for Bi atoms it may be seen that all the structures have two inequivalent Bi atoms with different formal valence state, and the insulating behavior is associated with the CDW.
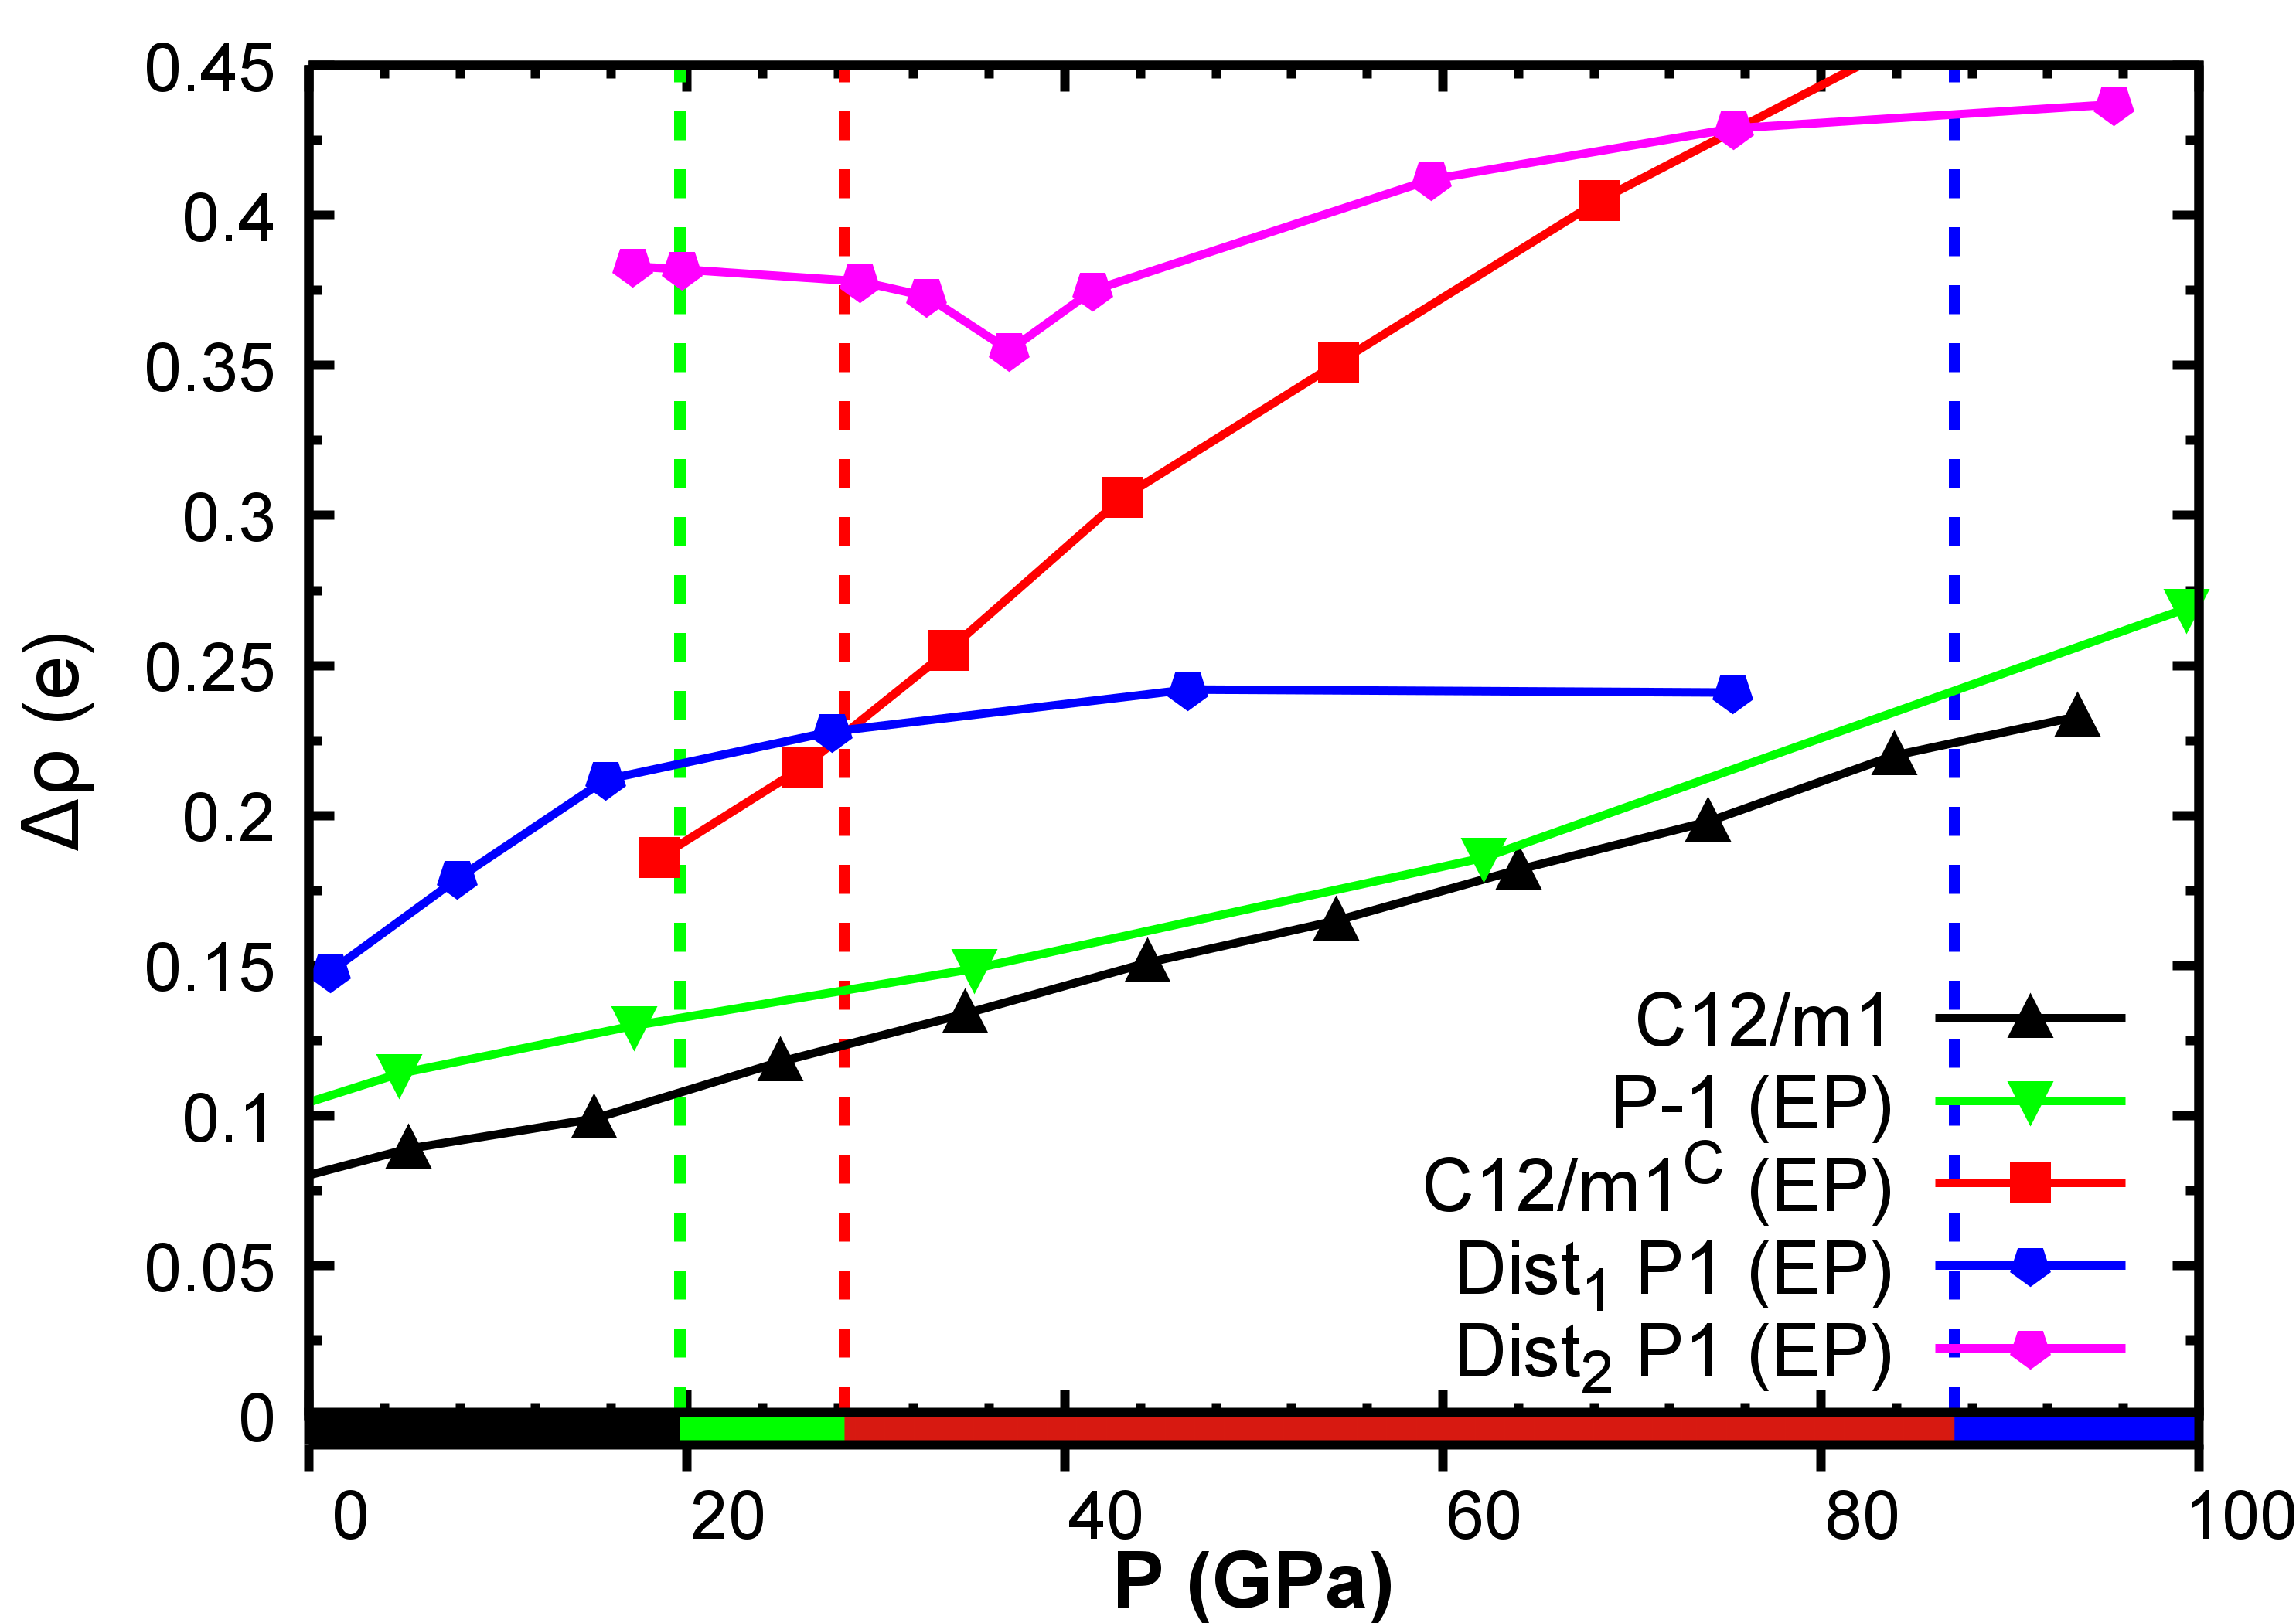
We determine the magnitude of the charge disproportionation by calculating the charge difference for the two types of bismuth, Bi3+ and Bi5+, from the partial spd-charge of the site projected ground-state wave function – see Fig. 6. Note that, although we name these atoms Bi3+ and Bi5+, the actual difference in charge is much smaller than twoFranchini et al. (2010).
For the C12m̄1, P1̄ and C12m̄1C structures the charge disproportionation increases when the pressure is increased. The change of charge disproportionation for Dist1 and Dist2 structures in the pressure range from 20 GPa to 100 GPa is small. Here Dist2 is another distorted structure consisting of 8 f.u. obtained by the evolutionary algorithms approach. Dist1 and Dist2 are competing phases at high pressure, but Dist1 is always lower in energy.
The only possible way to suppress the CDW and have a metallic BaBiO3 phase is to have a highly symmetric structure with no crucial distortions as electronic properties of BaBiO3 are highly coupled to the structural ones. Our calculations show that for BaBiO3 all energetically favorable structures are distorted in a way they are forced to be insulators, and metallic (symmetric) structures are strongly unfavorable in energy, and thus very unlikely to occur.
III Conclusions
In this work we performed a theoretical study of the BaBiO3 phase diagram under pressure to analyze the possibility of suppressing the CDW distortion, caused by charge disproportionation. We used two different structural search approaches to construct our ab-initio predicted high-pressure phase diagram: evolutionary algorithms and phonon mode analysis. The resulting phase diagram shows three structural phase transitions. The group-theoretical structure prediction method alone is not able to find the best structures at high pressure as it is constrained only to structures with symmetry. By using evolutionary algorithms we found that BaBiO3 becomes more distorted with increasing pressure. In fact, our calculations show that high pressure favor complicated structures with clustering and shearing distortions, which cannot be described as symmetry distortions of the single perovskite structures. The analysis of the electronic properties show that all ground-state structures remain insulating up to 100 GPa and the charge disproportionation is preserved at high pressure. This hinders the transition towards a metallic regime.
IV Computational details
For total energies and structural optimization we used GGA and HSE DFT calculations, as implemented in the VASP package Kresse and Hafner (1993, 1994); Kresse and Furthmüller (1996a, b) using PAW pseudopotentials Kresse and Joubert (1999); Blöchl (1994). We used the hybrid HSE functional to improve the description of the electronic properties. The energy cutoff value was set to 500 eV and -centered Monkhorst-Pack grid Monkhorst and Pack (1976); Pack and Monkhorst (1977) with 4x4x4 k-points was used for the GGA Perdew et al. (1996, 1997) and HSE functional for the structural relaxation. To do the relaxation at a specific pressure we performed fixed-volume calculation. For DOS calculations we used 8x8x8 grid for GGA functional and 2x2x2 for HSE which was sufficient to converge the value of the semiconducting gap (note that all structures at HSE level are semiconducting). Phonon calculations were done with 20x20x20 k-points grid at PBE level.
We have used two approaches to predict possible structures at high pressure: evolutionary algorithms as implemented in USPEX package Oganov and Glass (2006) and the group-theoretical analysis using ISOTROPY software suite Stokes et al. (1991). Determination of dispersion relations were done with the Phonopy packageTogo and Tanaka (2015). The setup for USPEX calculations was the following: 20 structures in population, 40 structures in the initial population, maximal number of generations is 25 and stopped the search when the best structure did not change for 8 generations.
The analysis of the Bi environment for the pool of structures obtain in the USPEX calculations was performed using the Chemenv module from the Pymatgen package Ong et al. (2013); che ; Pap . The main goal of the Chemenv module is to determine the chemical environment of each atom in a structure finding the best polyhedron that can represent atomic positions using continuous symmetry measure as a parameter to determine the optimal polyhedron (more details in the supplemental material). The pool of structures consists of around 300 structures for each pressure with 10 atoms in the unit cell.
Acknowledgements.
We thank Jiangang He for useful discussions and helpful instructions on symmetry analysis and David Waroquiers and Geoffroy Hautiers for the development of the chemenv package and very helpful technical support on its use. We acknowledge funding from the Austrian Science Fund FWF through SFB ViCoM, Project F41-P15 and computational resources from the VSC3 of the Vienna University of Technology.References
- Cohen (1992) R. E. Cohen, Nature 358, 136 (1992).
- Raveau et al. (1998) B. Raveau, A. Maignan, C. Martin, and M. Hervieu, Chemistry of Materials 10, 2641 (1998).
- Cox and Sleight (1976) D. Cox and A. Sleight, Solid State Communications 19, 969 (1976).
- Sleight (2015) A. W. Sleight, Physica C: Superconductivity and its Applications 514, 152 (2015), superconducting Materials: Conventional, Unconventional and Undetermined.
- Uchida et al. (1987) S. Uchida, K. Kitazawa, and S. Tanaka, Phase Transitions 8, 95 (1987).
- Cava et al. (1988) R. J. Cava, B. Batlogg, J. J. Krajewski, R. Farrow, L. W. Rupp, A. E. White, K. Short, W. F. Peck, and T. Kometani, Nature 332, 814 (1988).
- Inumaru et al. (2008) K. Inumaru, H. Miyata, and S. Yamanaka, Phys. Rev. B 78, 132507 (2008).
- Kim et al. (2015) G. Kim, M. Neumann, M. Kim, M. D. Le, T. D. Kang, and T. W. Noh, Phys. Rev. Lett. 115, 226402 (2015).
- Yan et al. (2013) B. Yan, M. Jansen, and C. Felser, Nat Phys 9, 709 (2013).
- Vildosola et al. (2013) V. Vildosola, F. Güller, and A. M. Llois, Phys. Rev. Lett. 110, 206805 (2013).
- Franchini et al. (2009) C. Franchini, G. Kresse, and R. Podloucky, Phys. Rev. Lett. 102, 256402 (2009).
- Foyevtsova et al. (2015) K. Foyevtsova, A. Khazraie, I. Elfimov, and G. A. Sawatzky, Phys. Rev. B 91, 121114 (2015).
- Zeyher and Kunc (1990) R. Zeyher and K. Kunc, Solid State Communications 74, 805 (1990).
- Blaha et al. (1994) P. Blaha, S. K., D. P., V. G., and W. W., Zeitschrift für Naturforschung A. 49, 129–132 (1994).
- Liechtenstein et al. (1991) A. I. Liechtenstein, I. I. Mazin, C. O. Rodriguez, O. Jepsen, O. K. Andersen, and M. Methfessel, Phys. Rev. B 44, 5388 (1991).
- Kunc et al. (1991) K. Kunc, R. Zeyher, A. Liechtenstein, M. Methfessel, and O. Andersen, Solid State Communications 80, 325 (1991).
- Meregalli and Savrasov (1998) V. Meregalli and S. Y. Savrasov, Phys. Rev. B 57, 14453 (1998).
- Franchini et al. (2010) C. Franchini, A. Sanna, M. Marsman, and G. Kresse, Phys. Rev. B 81, 085213 (2010).
- Korotin et al. (2012) D. Korotin, V. Kukolev, A. V. Kozhevnikov, D. Novoselov, and V. I. Anisimov, Journal of Physics: Condensed Matter 24, 415603 (2012).
- Bazhirov et al. (2013) T. Bazhirov, S. Coh, S. G. Louie, and M. L. Cohen, Phys. Rev. B 88, 224509 (2013).
- Yin et al. (2013) Z. P. Yin, A. Kutepov, and G. Kotliar, Phys. Rev. X 3, 021011 (2013).
- Kusmartseva et al. (2009) A. F. Kusmartseva, B. Sipos, H. Berger, L. Forró, and E. Tutiš, Phys. Rev. Lett. 103, 236401 (2009).
- Leroux et al. (2015) M. Leroux, I. Errea, M. Le Tacon, S.-M. Souliou, G. Garbarino, L. Cario, A. Bosak, F. Mauri, M. Calandra, and P. Rodière, Phys. Rev. B 92, 140303 (2015).
- Hanfland et al. (2000) M. Hanfland, K. Syassen, N. Christensen, and D. Novikov, Nature 408, 174 (2000).
- Ma Yanming et al. (2009) Ma Yanming, Eremets Mikhail, Oganov Artem R., Xie Yu, Trojan Ivan, Medvedev Sergey, Lyakhov Andriy O., Valle Mario, and Prakapenka Vitali, Nature 458, 182 (2009), 10.1038/nature07786.
- Duan et al. (2014) D. Duan, Y. Liu, F. Tian, D. Li, X. Huang, Z. Zhao, H. Yu, B. Liu, W. Tian, and T. Cui, Sci. Rep. 4 (2014), 10.1038/srep06968.
- Drozdov et al. (2015a) A. P. Drozdov, M. I. Eremets, I. A. Troyan, V. Ksenofontov, and S. I. Shylin, Nature 000, 2015/08/17/online (2015a).
- Drozdov et al. (2015b) A. Drozdov, M. I. Eremets, and I. A. Troyan, ArXiv e-prints (2015b), arXiv:1508.06224 [cond-mat.supr-con] .
- Heil and Boeri (2015) C. Heil and L. Boeri, Phys. Rev. B 92, 060508 (2015).
- Flores-Livas, José et al. (2016) Flores-Livas, José, Sanna, Antonio, and Gross, E. K.U., Eur. Phys. J. B 89, 63 (2016).
- Bernstein et al. (2015) N. Bernstein, C. S. Hellberg, M. D. Johannes, I. I. Mazin, and M. J. Mehl, Phys. Rev. B 91, 060511 (2015).
- Errea et al. (2015) I. Errea, M. Calandra, C. J. Pickard, J. Nelson, R. J. Needs, Y. Li, H. Liu, Y. Zhang, Y. Ma, and F. Mauri, Phys. Rev. Lett. 114, 157004 (2015).
- Flores-Livas et al. (2016) J. A. Flores-Livas, M. Amsler, C. Heil, A. Sanna, L. Boeri, G. Profeta, C. Wolverton, S. Goedecker, and E. K. U. Gross, Phys. Rev. B 93, 020508 (2016).
- Shamp et al. (2016) A. Shamp, T. Terpstra, T. Bi, Z. Falls, P. Avery, and E. Zurek, Journal of the American Chemical Society 138, 1884 (2016), pMID: 26777416.
- Fu et al. (2016) Y. Fu, X. Du, L. Zhang, F. Peng, M. Zhang, C. J. Pickard, R. J. Needs, D. J. Singh, W. Zheng, and Y. Ma, Chemistry of Materials 28, 1746 (2016).
- Kokail et al. (2016) C. Kokail, C. Heil, and L. Boeri, Phys. Rev. B 94, 060502 (2016).
- Wigner and Huntington (1935) E. Wigner and H. Huntington, J. Chem. Phys. 3, 764 (1935).
- Cudazzo et al. (2008) P. Cudazzo, G. Profeta, A. Sanna, A. Floris, A. Continenza, S. Massidda, and E. K. U. Gross, Phys. Rev. Lett. 100, 257001 (2008).
- Borinaga et al. (2016) M. Borinaga, I. Errea, M. Calandra, F. Mauri, and A. Bergara, Phys. Rev. B 93, 174308 (2016).
- Dias and Silvera (2017) R. Dias and I. Silvera, Science xx, yy (2017).
- Stokes et al. (1991) H. T. Stokes, D. M. Hatch, and J. D. Wells, Phys. Rev. B 43, 11010 (1991).
- Oganov and Glass (2006) A. R. Oganov and C. W. Glass, The Journal of Chemical Physics 124, 244704 (2006), 10.1063/1.2210932.
- Heyd et al. (2003) J. Heyd, G. E. Scuseria, and M. Ernzerhof, The Journal of Chemical Physics 118, 8207 (2003).
- Scholder et al. (1963) R. Scholder, K.-W. Ganter, H. Gläser, and G. Merz, Zeitschrift für anorganische und allgemeine Chemie 319, 375 (1963).
- Nakamura et al. (1971) T. Nakamura, S. Kose, and T. Sata, Journal of the Physical Society of Japan 31, 1284 (1971).
- Arpe and Müller-Buschbaum (1977) R. Arpe and H. Müller-Buschbaum, Zeitschrift für anorganische und allgemeine Chemie 434, 73 (1977).
- Note (1) To model the effect of pressure on the system we have used volume associated to a given pressure by doing fixed volume relaxation using VASP and allowing atomic positions and unit cell shape to vary for several pressures.
- Oganov and Ono (2004) A. R. Oganov and S. Ono, Nature 430, 445 (2004).
- Sugiura and Yamadaya (1984) H. Sugiura and T. Yamadaya, Solid state communications 49, 499 (1984).
- Sugiura and Yamadaya (1986) H. Sugiura and T. Yamadaya, Physica B+ C 139, 349 (1986).
- Howard and Stokes (2005) C. J. Howard and H. T. Stokes, Acta Crystallographica Section A 61, 93 (2005).
- Balachandran and Rondinelli (2013) P. V. Balachandran and J. M. Rondinelli, Phys. Rev. B 88 (2013), 10.1103/PhysRevB.88.054101.
- He and Franchini (2014) J. He and C. Franchini, Phys. Rev. B 89, 045104 (2014).
- Note (2) Results are available in the supplemental material.
- Togo and Tanaka (2015) A. Togo and I. Tanaka, Scripta Materialia 108, 1 (2015).
- Glazer (1975) A. M. Glazer, Acta Crystallographica Section A 31, 756 (1975).
- Ong et al. (2013) S. P. Ong, W. D. Richards, A. Jain, G. Hautier, M. Kocher, S. Cholia, D. Gunter, V. L. Chevrier, K. A. Persson, and G. Ceder, Computational Materials Science 68, 314 (2013).
- (58) chemenv is a module inside pymatgen package and is developed by David Waroquiers and Geoffroy Hautier. Website: http://pymatgen.org/.
- (59) Local environments statistics in oxides from an automatic and robust detection algorithm. (To be published).
- (60) It is possible to precisely determine the difference of partial DOS only for monoclinic C12m̄1 BaBiO3 as it has only two Bi atoms which are inequivalent. For the other structures we have separated Bi atoms into two formal groups representing Bi5+ and Bi3+ case. After averaging partial DOS in each group the difference was taken.
- Kresse and Hafner (1993) G. Kresse and J. Hafner, Phys. Rev. B 47, 558 (1993).
- Kresse and Hafner (1994) G. Kresse and J. Hafner, Phys. Rev. B 49, 14251 (1994).
- Kresse and Furthmüller (1996a) G. Kresse and J. Furthmüller, Computational Materials Science 6, 15 (1996a).
- Kresse and Furthmüller (1996b) G. Kresse and J. Furthmüller, Phys. Rev. B 54, 11169 (1996b).
- Kresse and Joubert (1999) G. Kresse and D. Joubert, Phys. Rev. B 59, 1758 (1999).
- Blöchl (1994) P. E. Blöchl, Phys. Rev. B 50, 17953 (1994).
- Monkhorst and Pack (1976) H. J. Monkhorst and J. D. Pack, Phys. Rev. B 13, 5188 (1976).
- Pack and Monkhorst (1977) J. D. Pack and H. J. Monkhorst, Phys. Rev. B 16, 1748 (1977).
- Perdew et al. (1996) J. P. Perdew, K. Burke, and M. Ernzerhof, Phys. Rev. Lett. 77, 3865 (1996).
- Perdew et al. (1997) J. P. Perdew, K. Burke, and M. Ernzerhof, Phys. Rev. Lett. 78, 1396 (1997).