MAGIC detection of very high energy -ray emission from the low-luminosity blazar 1ES 1741+196
Abstract
We present the first detection of the nearby (z=0.084) low-luminosity BL Lac object 1ES 1741+196 in the very high energy (VHE: E100 GeV) band. This object lies in a triplet of interacting galaxies. Early predictions had suggested 1ES 1741+196 to be, along with several other high-frequency BL Lac sources, within the reach of MAGIC detectability. Its detection by MAGIC, later confirmed by VERITAS, helps to expand the small population of known TeV BL Lacs. The source was observed with the MAGIC telescopes between 2010 April and 2011 May, collecting 46 h of good quality data. These observations led to the detection of the source at 6.0 confidence level, with a steady flux ph cm-2s-1 and a differential spectral photon index in the range of 80 GeV - 3 TeV. To study the broad-band spectral energy distribution (SED) simultaneous with MAGIC observations, we use KVA, Swift/UVOT and XRT, and Fermi/LAT data. One-zone synchrotron-self-Compton (SSC) modeling of the SED of 1ES 1741+196 suggests values for the SSC parameters that are quite common among known TeV BL Lacs except for a relatively low Doppler factor and slope of electron energy distribution. A thermal feature seen in the SED is well matched by a giant elliptical’s template. This appears to be the signature of thermal emission from the host galaxy, which is clearly resolved in optical observations.
keywords:
galaxies: galaxies: BL Lacertae objects: individual (1ES 1741+196) - gamma-rays: galaxies.Received: ??? / Accepted: ???
1 Introduction
Blazars are thought to be black-hole (BH) powered Active Galactic Nuclei (AGN) whose relativistic jets are closely aligned with our line-of-sight. They constitute the most numerous class of detected extragalactic very-high-energy (VHE: E100 GeV) -ray sources. Their spectral energy distribution (SED) typically shows two emission components: (i) one component peaks at eV-keV energies, interpreted as synchrotron radiation emitted by relativistic electrons moving in the jet’s magnetic field; and (ii) another component, which peaks at -ray frequencies, commonly interpreted as arising from inverse Compton (IC) scattering of lower-energy photons (Rees 1967) – the latter being either the above-mentioned synchrotron photons internal to the jet (Synchro-Self-Compton (SSC) scenario, see Maraschi, Ghisellini & Celotti 1992) or some other photon field external to the jet (External Compton (EC) scenario, see Dermer & Schlickeiser 1993). The high energy peak may also result from hadronic processes, as proposed by Mannheim (1993). BL Lac objects are blazars characterized by a featureless, highly polarized, broad-band (radio to VHE) continuum emission.
1ES 1741+196 is a high-frequency-peaked BL Lac object (HBL; where the synchrotron peaks at X-ray, while its IC counterpart peaks at VHE), at coordinates (J2000) RA = 17:43:57.8 (hh:mm:ss) and DEC=19:35:09 (dd:mm:ss), at redshift . Its host galaxy is one of the most luminous and largest (=-24.85; =51.2 kpc) among BL Lac host galaxies. Two nearby (7.2 and 25.2 kpc) companion galaxies at the same redshift suggest that 1ES 1741+196 could be a BL Lac object in a triplet of interacting galaxies (Heidt et al. 1999). It was detected in radio, optical, X-ray and high energy (HE: E100 MeV) -ray frequencies (Rector et al. 2003; Heidt et al. 1999; Padovani & Giommi 1995; Acero et al. 2015). Its high resolution radio map (Piner & Edwards 2014) shows a parsec scale one-sided jet. The jet-counterjet brightness ratio suggests a Doppler factor of 4, for a viewing angle of a few degrees.
Prompted by the prediction of TeV flux based on the BeppoSAX observations and the SSC model (Costamante & Ghisellini 2002), MAGIC observed this source in mono-mode for a total of 16 hr between 2007 July and 2008 August, obtaining a significance of , and a flux upper limit of F(170 GeV)ph cm-2 s-1 (Aleksić et al. 2010). Further MAGIC observations carried out between 2010 April and 2011 May in stereoscopic mode finally led to the detection of the source at VHE -ray frequencies (Berger et al. 2011). This was later confirmed by VERITAS (Abeysekara et al. 2016).
In this paper we study the emission features of the 1ES 1741+196, the only BL Lac object detected in a triplet of interacting galaxies, using the data collected from MAGIC and other multi-frequency instruments. In Section 2 we describe the multi-frequency data used for this analysis. The results are presented in Section 3, discussed in Section 4, and summarized in Section 5.
2 Observations and Data Analysis
Observations of 1ES 1741+196 during time periods that include the MAGIC observation window were performed in the optical, X-ray and HE -ray ranges, which are discussed in detail in the following sections.
2.1 KVA
The KVA (Kungliga Vetenskapsakademien Academy)111Tuorla Blazar monitoring program, http://users.utu.fi/kani telescopes are located at La Palma but operated remotely by the Tuorla Observatory in Finland. These telescopes are used mainly for optical support observations for the MAGIC telescopes. The KVA telescopes consist of a 60 cm telescope which is used for polarimetric observations and a 35 cm telescope used for photometry simultaneous with MAGIC observations. Furthermore, the smaller 35 cm telescope monitors potential VHE -ray candidate AGNs in order to trigger MAGIC observations if one of these selected objects is in a high optical state. These observations are performed in the -band and the magnitude of the source is measured from CCD images using differential photometry, i.e. by comparing the brightness of the object with that of several calibrated stars in the same field of view. The data were processed by the reduction programmes developed in Tuorla Observatory (see Nilsson et al. 2016 and the references therein).
2.2 Swift
The Swift satellite, which was launched in 2004 (Gehrels et al. 2004) carries three instruments, the Burst Alert Telescope (BAT; sensitive 15-150 keV; Barthelemy et al. 2005), the X-ray telescope (XRT; sensitive 0.2-10 keV; Burrows et al. 2005) and the UV/Optical Telescope (UVOT; sensitive 170-600 nm; Roming et al. 2005).
The Swift/XRT data which fall in the MAGIC observation period were taken in Photon Counting mode on 2010 July 30 and 2011 January 21. These data were processed by the XRTPIPELINE (version 0.13.1) distributed by HEASARC within the HEASoft package (v.6.16) using standard procedure. Events with grades 0-12 were selected (see Burrows et al. 2005) and the response matrices available in the Swift CALDB (20110101v014) were used. The source events in the 0.3-10 keV range within a circle with a radius of 22 arcsec were selected for the spectral analysis. The background was extracted from off-source circular regions of the same radius. The spectra were extracted from the corresponding event files and binned using GRPPHA to ensure a minimum of 20 counts per energy bin. Spectral analysis was performed using XSPEC version 12.8.2.
Swift/UVOT source counts were extracted from a circular region of radius 5 arcsec, centered on the source position. The background was estimated from three circular source free regions of the same radius. These data were processed with the uvotmaghist task of the HEASOFT package.
2.3 Fermi/LAT
The pair-conversion Large Area Telescope (LAT) on board the Fermi satellite monitors the -ray sky in survey mode every 3 hours in the energy range from 20 MeV to 300 GeV (Atwood et al. 2009). The data presented in this paper were selected from a radius region of interest (ROI) centered at the location of the 1ES 1741+196, during the first 6.7 years of the mission from 2008 August 4 to 2015 April 7 (MJD 54682.7–57119.3). We analyzed the data in the energy range from 100 MeV to 300 GeV. The analysis was performed with the ScienceTools software package version v9r33p0 and the instrument response function P7REP_SOURCE_V15 (Ackermann et al. 2012). The event selection was based on Pass 7 reprocessed source class events and a zenith angle cut of was applied to reduce the contamination from the Earth limb. The Galactic diffuse emission model (Acero et al. 2016) and isotropic component used were gll_iem_v05_rev1.fit and iso_source_v05.txt, respectively as recommended for Pass 7 Reprocessed Source event class222http://fermi.gsfc.nasa.gov/ssc/data/access/lat/BackgroundModels.html. The normalizations of both components in the background model were allowed to vary freely during the spectral fitting. A binned maximum-likelihood method analysis was used (Mattox et al. 1996).
For a first likelihood fit making use of gtlike, the model includes all the sources within 20∘ of the source of interest which are included in the Fermi/LAT third source catalog (Acero et al. 2015). For the spectral fit (simple power law) spectral indices and fluxes were left free for the sources within 15∘, while sources from 15∘ to 20∘ were frozen to the catalog value. From the residual of the model (created using gtmodel) with respect to the data within the ROI, in addition to the 3FGL sources, we identified one new source with test statistic TS=26.1 located 9.9∘ from 1ES 1741+196. This was included in the model. In addition, 5 more sources with TS between 5.3 and 12.8 and located between 9.1 and 11.9∘ from 1ES 1741+196 were included in the model. The best location of these 6 additional sources were found using gtfindsrc. The sources with TS were deleted from the model. A second maximum-likelihood analysis was performed on the updated source model. For the light curve calculation in 1 year time bins shown in Fig. 2, only the source of interest and the diffuse models were left free to vary while the rest of the sources considered in the analysis were fixed to the values obtained from the analysis of the entire data sample. Also variability on monthly timescales was investigated.
2.4 MAGIC
MAGIC is a system of two 17 m dish Imaging Atmospheric Cherenkov Telescopes (IACT) located at the Roque de los Muchachos observatory (N, W, 2200 m a.s.l.), on the Canary Island of La Palma, Spain. Since 2009 the MAGIC telescopes operate stereoscopically, with a sensitivity of 0.7 crab-unit (integrated flux from the Crab Nebula) for energies 220 GeV in 50 hr of observations (Aleksić et al. 2011).
The MAGIC telescopes observed 1ES 1741+196 for 53 nights from 2010 April 10 until 2011 May 26, for a total observation time of approximately 57 hr in the so-called wobble mode (Fomin et al. 1994). The data were taken for zenith angles in the range from to , which resulted in an energy threshold (defined as the peak of the Monte Carlo (MC) simulated photon energy distribution for a Crab-Nebula-like spectrum after all analysis cuts) of 90 GeV.
After the application of standard quality checks based on the rate of the stereo events and the distributions of basic image parameters, 46 hr of effective on-time data were selected. Data analysis was performed using the standard software package MARS (Albert et al. 2008a; Aliu et al. 2009), including the latest routines for stereoscopic analysis (Aleksić et al. 2012; Lombardi et al. 2011; Zanin et al. 2013). After the calibration (Albert et al. 2008b) and the image cleaning of the events recorded by each telescope, the information coming from the individual telescopes is combined and the calculation of basic stereo image parameters is performed. For /hadron separation and the -direction estimation, a multivariate method called Random Forest (Albert et al. 2008c) was applied using image parameters (Hillas 1985), timing information (Aliu et al. 2009), and stereo parameters (Aleksić et al. 2012), to compute a /hadron discriminator, called hadronness. While computing the significance of the signal coming from the 1ES 1741+196 sky region, we applied single cuts in hadronness and ‡‡‡The parameter is the squared angular distance between the reconstructed source position of the events and the nominal position of the expected source., which were optimised to maximise the significance of the signal (above 250 GeV) in a Crab nebula data set. Conversely, in deriving the spectrum and the light curve of the source, we applied different cut values in hadronness that, for each logarithmic energy bin, yield a gamma efficiency of 90% in the MC gamma dataset. These procedures, which are regularly used to analyse MAGIC data, are described in detail in Aleksić (2012).
3 Results
In the following sections the analysis results from the optical, X-ray, HE, and VHE data are presented.
3.1 KVA
The top panel of Fig. 1, shows the light curve obtained from the photometric observations of KVA, between 2006 June and 2013 November, while the bottom panel shows the light curve from 2010 April 21 to 2011 May 23 that coincides with the MAGIC observation window.

The brightness was corrected for the dust in the Galaxy (Schlegel et al. 1998). Since the host galaxy belongs to a triplet of interacting galaxies, we used a slightly different approach to estimate the host galaxy magnitude, using a Nordic Optical Telescope (NOT) image (see also Nilsson et al. 2007). After subtracting the central point source based on the scaling from the model fit and convolving the image with a seeing of 2 arcsec (typical KVA good seeing value), the counts inside a radius of 7.5 arcsec (which is the KVA measurement aperture) were measured. In order to match this NOT image to the same calibration used in the case of KVA monitoring, the brightness of two unsaturated stars in the NOT image (convolved with 2 arcsec seeing) were calculated. In order to derive the transformation from counts to magnitude, we measured the same stars (as in the NOT image) using the KVA data with the same reference star that is used in the monitoring. Using this approach the host magnitude has been computed. The flux of the host galaxy turned out to be 2.50.3 mJy.
After subtracting the estimated host galaxy flux from the observed KVA flux of 1ES 1741+196 (averaged over the MAGIC observation; Fig. 1), the residual KVA flux – an average value attributable to the nuclear region of blazar over the MAGIC observation time – is mJy. This matches the emission level monitored over the whole 7-year span of KVA observations, i.e., mJy. The source shows only marginal variability during the 7 yr KVA survey (as also shown in Lindfors et al. 2016), and hardly any variability during the MAGIC observations (respectively, top and bottom panels of Fig. 1).
3.2 Swift
The X-ray spectra can be well described by a simple power law () in the range of 0.3 - 10 keV, with a photon index , and a normalization constant keV-1 cm-2 s-1 at 1 keV. The neutral hydrogen-equivalent column density was fixed to the Galactic value in the direction of the source, which is cm-2 (Kalberla et al. 2005). We have also found that there is no significant spectral variability in the XRT observations of 2010 July 30 and 2011 January 21.
The fluxes obtained from Swift/UVOT analysis have been corrected for Galactic extinction mag (Schlegel et al. 1998). The exact amount of the host galaxy contribution is not given in the literature. Hence, we estimated the host galaxy magnitude V=1.1 mJy, B=0.5 mJy and U=0.1 mJy based on the R-band value (aperture 5 arcsec) from Nilsson et al. (2007) by using galaxy colours at z=0 (Fukugita, Shimasaku & Ichikawa 1995). These derived values dominate the measured fluxes. Since Fukugita et al. (1995) does not provide the error estimate in the above filters, we roughly estimated the error in the V, B, and U bands (which is 0.3 mJy), by taking into account the error in R-band (0.26 mJy). The estimated error in B and U bands are comparable to, or larger than, the estimated host galaxy flux. Considering the rather large host galaxy magnitude (compared to the measured flux) and the high uncertainty, the fluxes in these bands will not be considered in the (non-thermal) SED modeling in this paper. Indeed, in Sect. 4 we will see that the Swift/UVOT data can be nicely interpreted as arising from the thermal emission of the elliptical host galaxy.
3.3 Fermi/LAT
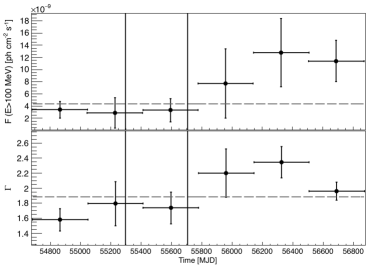
In Fig. 2 the Fermi/LAT fluxes and spectral indices of 1ES 1741+196 are plotted as a function of time in bins of 1 year. Slight hints of variability, especially in the spectral index, do exist with and 11.46/5 for, respectively, the flux and the spectral index, while fitting with a constant line. Since the source was not bright enough, variability on shorter time scales cannot be investigated. Also, no month-scale variability was found, compatible with previous claims in the 3FGL catalog (Acero et al. 2015 with a variability index of 38.3).
We have analysed HE Fermi/LAT data contemporaneous to the MAGIC observations. The LAT data were collected from 2010 April 10 (MJD 55296) to 2011 May 26 (MJD 55707). A point like source positionally consistent with 1ES 1741+196 was detected with a TS = 19.4 (). The best-fit parameters for the model result in a spectral index of and an integral flux F(E100 MeV)=(2.0 0.4). The spectral index reported in the 3FGL (Acero et al. 2015) is , while the one reported in 1FHL (Ackermann et al. 2013) is . For comparison purposes, a spectrum has also been produced for the whole data sample collected by the LAT from 2008 August 4 to 2015 April 7 (MJD 54682.7–57119.3) above 100 MeV using the same procedure.

3.4 MAGIC
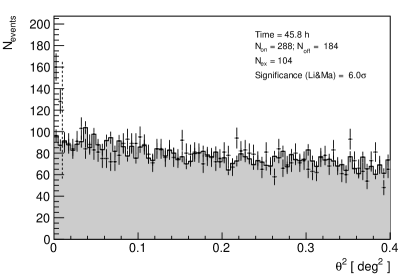
The -ray signal from the source is estimated from the so-called plot, after the application of energy-dependent cuts to events (including hadronness), and within a fiducial signal region. In order to evaluate the residual background of the observation, the distribution around a nominal background control region is also calculated. Fig. 3 shows the distribution of the events. We found an excess of events in the fiducial signal region with , corresponding to a significance of .
Fig. 4 shows the light curve of the source with a time binning of 28 days, considering the length of a moon-cycle, which determines the observational season of IACTs. During the observation period no significant variability was detected. The light curve can be fitted with a constant flux hypothesis of ph cm-2s-1 with a =1.4/3.
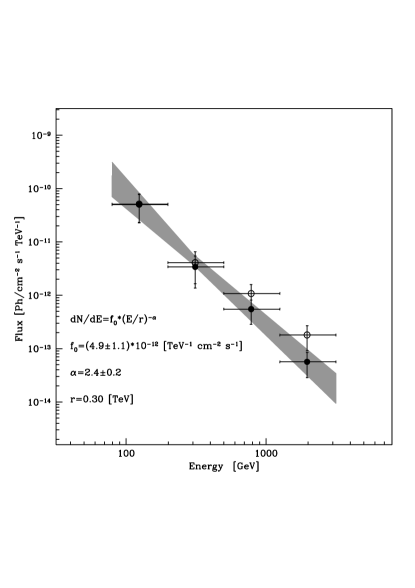
Fig. 5 shows the the spectral points of 1ES 1741+196, which are obtained by the Bertero unfolding method (Albert et al. 2007). We also show the spectral points after correcting the Extragalactic Background Light (EBL) using the Franceschini, Rodighiero & Vaccari (2008) model. The bow-tie shows the power law fit obtained with the forward-folding method. The spectrum in the range 80 GeV E 3 TeV can be well described by a simple power law ():
| (1) |
with a photon index of , and a normalization constant at 0.3 TeV of ph cm-2 s-1 TeV-1. The systematic error on the energy scale is 17% (Aleksić et al. 2011). The mean integrated flux above 100 GeV is ph cm-2s-1.
4 Discussion

The emission of most BL Lac sources is understood in terms of the one-zone SSC model, in which energetic electrons moving inside a magnetized relativistically-moving plasma blob emit via the synchrotron and inverse-Compton scattering mechanisms (e.g., Tavecchio et al. 1998). The electron spectrum is often described as a smoothed broken power law.
| (2) |
where , , and are the lowest, break, and highest Lorentz factors, K is the normalization constant, and and are, respectively, the slopes below and above the break. The relativistic boosting is encoded in the Doppler factor , where is the bulk Lorentz factor, and is the viewing angle.
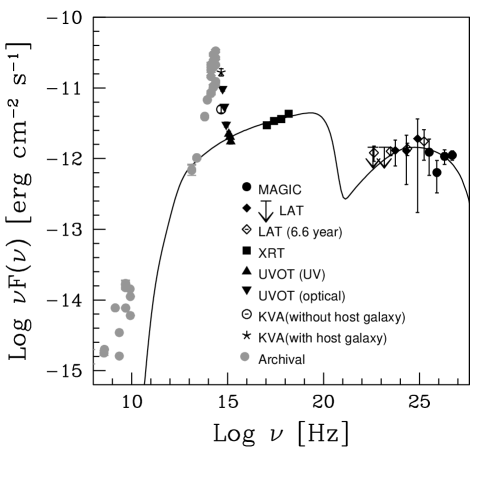
In Fig.6 we plot the broad-band SED of 1ES 1741+196 using the multiwavelength data described in Sect. 3. The VHE data are corrected for the EBL using the Franceschini et al. (2008) model. The Fermi/LAT spectrum (HE -ray band), which is contemporaneous with the MAGIC observation is shown as filled diamonds, while the Fermi spectrum for the total time period (empty diamonds) is not used for the SED modeling. The Swift/XRT X-ray spectrum (averaged over the nights of 30 Jul 2010 and 21 Jan 2011) is also depicted. The optical KVA point, that represents the blazar’s non-thermal optical flux (free from the host galaxy emission), was computed convolving a point-like source with a typical KVA seeing of 2 arcsec.
The SED of 1ES 1741+196 does not look very different from the SEDs of other BL Lacs (Tavecchio et al. 2010). However, it shows an unusual conspicuous feature at optical/NIR frequencies, that appears as a branch taking off from the familiar non-thermal SED. We assume this feature to be the spectral signature of the elliptical galaxy hosting the blazar. In Fig.7 we overlay the optical/NIR data –Swift/UVOT and KVA – together with the non-simultaneous data from the 2 Micron All Sky Survey (2MASS) obtained on 1999 June 19444http://www.ipac.caltech.edu/2mass/, onto the giant elliptical template of Mannucci et al. (2011), placed at the appropriate distance: the good agreement below 10000 supports our assumption. The difference between the model and the 2MASS flux could be due to the contribution of the two nearby galaxies in the triplet which was not taken into account in this modeling.
We fitted the non-thermal SED using the method described in Mankuzhiyil et al. (2011), i.e., assuming a one-zone SSC emission model (Tavecchio et al. 1998). The SSC model parameters obtained are given in Table 1. Fitting an SSC model to the observed SED data returns parameters that are typically found for HBL (e.g., Tavecchio et al. 2010, Mankuzhiyil et al. 2011, Mankuzhiyil et al. 2012), except for the comparatively lower Doppler factor, and the minor difference between the slopes below and above the of the electron energy distribution (EED). We note that the experimental constraints are relatively limited, hence the SSC parameter combination may not be unique. Alternative combinations of parameters could also provide an acceptable fit to the data.
Our results are in overall agreement with those recently reported by the VERITAS collaboration (Abeysekara et al. 2016), pertaining to observations made after ours. The similar results should not be surprising given that the source is consistent with the hypothesis of no variability during the last 6 years.
It is interesting to note that the infrared region of the archival data (which were not considered for the SED fit) nicely match with the SED. However, the KVA (host galaxy subtracted) flux does not agree well with the non-thermal SED, while the KVA flux with the host galaxy shows a rough agreement between the non-thermal infrared-optical flux points. The lack of other host-galaxy-subtracted data in the optical region prevents us from testing any other emission model (see for example, the helical jet model of Villata & Raiteri 1999, that was applied in Ahnen et al. 2016).
The radio emission is plausibly from an extended region, hence does not agree with the model below the frequency Hz. As a demonstration, we calculate the typical Lorentz factor () of electrons that are responsible for the radio emission at 10 GHz in a magnetic field G and Doppler factor 14 (from the Table 1). The calculated value turns out to be 100. The cooling time scale of such an electron will be s. Assuming the electron diffuses through the jet medium at the speed of light, the extent of the radio emitting region will be 100 pc, which is far beyond the blob radius. This suggests that the radio is emitted from an extended region, hence may differ from the model.
| 5.1 | 9.4 | 2.2 | 2.9 | 2.3 | 3.9 | 2.0 | 14.0 |
We note that the Doppler factor from the SSC fit is well above the Doppler factor () calculated from the jet-counterjet radio brightness ratio (Piner & Edwards 2014). This is a common dispute in blazars, where the Doppler factor from the SSC fit falls mostly in the range of 10-50 (Tavecchio et al. 2010), while it is a few from the radio brightness studies (Piner & Edwards 2004). This may be because the Doppler factor that we estimate through the SED modeling belongs to the blazar zone. The size of the emission region derived from the SSC fit is cm. If we assume a conical jet of opening angle of 1∘, then the blazar emission region is located at cm from the central engine. This distance corresponds to an angular separation of 0.1 milli arcsec (at a redshift z=0.084), which is beyond the resolution of radio telescopes. However, the jet-counterjet brightness ratio is estimated from the extended region of the jet.
Perhaps related to 1ES 1741+196’s host galaxy being visible, the equivalent isotropic luminosity, estimated from the peak fluxes and the corresponding frequencies of the synchrotron and SSC components of the SED of this source, erg s-1, is among the lowest among TeV blazars. This is at least partly due to its Doppler factor, , being lower by a factor of 2 than typical values found in TeV blazars – maybe owing to misalignment – as , this source may indeed appear underluminous by a factor of 20.
The of the electron energy distribution (EED) which lies near the , and the minor difference in the EED slopes below and above the (2.2 and 2.9 respectively) are unusual compared to the EED parameters of other BL Lacs (see for example, Tavecchio et al. 2010, Mankuzhiyil et al. 2011, Mankuzhiyil et al. 2011). The reader may also note that the VERITAS collaboration reported a simple power law EED (instead of a broken power law that we use) of slope 2.2 to explain the emission process of this source. We have also attempted to fit the SED using a simple power-law EED, and found that the model does not reproduce well the UV band (connected to the X-ray spectrum) and the flatness of the measured high-energy (IC) peak. Therefore, one needs a double power-law EED with an internal break with a relatively small spectral change ( =0.7) to describe well the measured broadband SED reported in this study. The origin of these internal breaks in the EED, presumedly related to the acceleration process, may be due to variations in the global field orientation or turbulence levels sampled by particles of different energy. The need for this kind of internal breaks in the EED have been reported in the literature for several sources in order to better describe the spectral measurements. Examples of those are the ones reported for 3C 454 (Abdo et al. 2009), AO 0235+164 (Abdo et al. 2010), Mrk 421 (Abdo et al. 2011a, Aleksić et al. 2015) and Mrk 501 (Abdo et al. 2011b and Mankuzhiyil et al. 2012 during short flares). A detailed study on the emission process will be addressed in a more detailed paper.
To the best of our knowledge, 1ES 1741+196 is the first blazar with known SED hosted in a triplet of interacting galaxies. It is interesting to note that, even though a tidal tail is observed to emanate from the host galaxy (Heidt et al. 1999) – suggesting mass loss from the galaxy due to tidal forces within the triplet – the SSC emission parameters of 1ES 1741+196 do not substantially deviate from typical values (except the Doppler factor and the slope of EED) observed in other BL Lacs.
5 Summary
We reported the first detection (by MAGIC) of VHE -rays from the BL Lac source 1ES 1741+196. From the 2010-2011 MAGIC data the source is clearly detected at significance level. The multi-frequency data used in this paper suggest that 1ES 1741+196 shows a behaviour typical of HBL sources, with a slightly different EED and a lower Doppler factor. A notable peculiarity of the SED of 1ES 1741+196 is that it shows the host galaxy’s spectral signature, a thermal feature at optical/NIR frequencies that we show is compatible with the spectrum of a giant elliptical. The coincidental relatively low luminosity of 1ES 1741+196 may stem from the jet’s relatively low Doppler factor.
acknowledgements
We would like to thank the Instituto de Astrofísica de Canarias for the excellent working conditions at the Observatorio del Roque de los Muchachos in La Palma. The financial support of the German BMBF and MPG, the Italian INFN and INAF, the Swiss National Fund SNF, the ERDF under the Spanish MINECO (FPA2015-69818-P, FPA2012-36668, FPA2015-68278-P, FPA2015-69210-C6-2-R, FPA2015-69210-C6-4-R, FPA2015-69210-C6-6-R, AYA2013-47447-C3-1-P, AYA2015-71042-P, ESP2015-71662-C2-2-P, CSD2009-00064), and the Japanese JSPS and MEXT is gratefully acknowledged. This work was also supported by the Spanish Centro de Excelencia “Severo Ochoa” SEV-2012-0234 and SEV-2015-0548, and Unidad de Excelencia “María de Maeztu” MDM-2014-0369, by grant 268740 of the Academy of Finland, by the Croatian Science Foundation (HrZZ) Project 09/176 and the University of Rijeka Project 13.12.1.3.02, by the DFG Collaborative Research Centers SFB823/C4 and SFB876/C3, and by the Polish MNiSzW grant 745/N-HESS-MAGIC/2010/0. The Fermi LAT Collaboration acknowledges generous ongoing support from a number of agencies and institutes that have supported both the development and the operation of the LAT as well as scientific data analysis. These include the National Aeronautics and Space Administration and the Department of Energy in the United States, the Commissariat à l’Energie Atomique and the Centre National de la Recherche Scientifique / Institut National de Physique Nucléaire et de Physique des Particules in France, the Agenzia Spaziale Italiana and the Istituto Nazionale di Fisica Nucleare in Italy, the Ministry of Education, Culture, Sports, Science and Technology (MEXT), High Energy Accelerator Research Organization (KEK) and Japan Aerospace Exploration Agency (JAXA) in Japan, and the K. A. Wallenberg Foundation, the Swedish Research Council and the Swedish National Space Board in Sweden. Additional support for science analysis during the operations phase is gratefully acknowledged from the Istituto Nazionale di Astrofisica in Italy and the Centre National d’Études Spatiales in France. This research was supported ´ 572 by an appointment to the NASA Postdoctoral Program at the Goddard Space Flight Center, administered by Universities Space Re- 574 search Association through a contract with NASA. F. K. acknowledges funding from the European Union’s Horizon 2020 research and innovation programme under grant agreement No 653477.
References
- Abdo et al. (2011a) Abdo A. A. et al., 2011a, ApJ, 736, 131
- Abdo et al. (2011b) Abdo A. A. et al., 2011b, ApJ, 727, 129
- Abdo et al. (2010) Abdo A. A. et al., 2010, ApJ, 710, 1271
- Abdo et al. (2009) Abdo A. A. et al., 2009, ApJ, 699, 817
- Abeysekara et al. (2016) Abeysekara A. U. et al., 2016, MNRAS, 459, 2550
- Acero et al. (2016) Acero F. et al., 2016, ApJS, 223, 2
- Acero et al. (2015) Acero F. et al., 2015, ApJS, 218, 23
- Ackermann et al. (2013) Ackermann M. et al., 2013, ApJS, 209, 2
- Ackermann et al. (2012) Ackermann M. et al., 2012, ApJ, 750, 3
- Ahnen et al. (2016) Ahnen M. L. et al., 2016, MNRAS, 459, 3271
- Albert et al. (2007) Albert J. et al., 2007, Nucl. Inst. Meth. Phys. Res. A, 594, 407
- Albert et al. (2008a) Albert J. et al., 2008a, ApJ, 674, 1037
- Albert et al. (2008b) Albert J. et al., 2008b, Nucl. Instr. Meth., A594, 407
- Albert et al. (2008c) Albert J. et al., 2008c, Nucl. Instr. Meth., A588, 424
- Aleksić et al. (2015) Aleksić J. et al., 2015, A&A, 578, 22
- Aleksić et al. (2012) Aleksić J. et al., 2012, Astrop. Phys., 35, 435
- Aleksić et al. (2011) Aleksić J. et al., 2011, Astrop. Phys., 35, 435
- Aleksić et al. (2010) Aleksić J. et al., 2010, ApJ, 729, 2
- Aliu et al. (2009) Aliu E. et al., 2009, Astrop. Phys., 30, 293
- Atwood et al. (2009) Atwood W. B. et al., 2009, ApJ, 697, 1071
- Barthelemy et al. (2005) Barthelemy S. D. et al., 2005, Space Sci. Rev., 120, 143
- Berger et al. (2011) Berger, K. et al., 2011, Proc. 32nd ICRC (Beijing, China), 8, 167
- Burrows et al. (2005) Burrows, D. N. et al., 2005, Space Sci. Rev., 120, 165
- Costamante & Ghisellini (2002) Costamante, L., Ghisellini, G. 2002, A&A, 384, 56
- Dermer & Schlickeiser (1993) Dermer C.D., Schlickeiser R. 1993, ApJ, 416, 458
- Fomin et al. (1994) Fomin V.P., Fennell S., Lamb R.C., Lewis c D. A., Punch M., Weekes T.C., 1994, Astrop. Phys., 2, 137
- Franceschini et al. (2005) Franceschini, A., Rodighiero, G., Vaccari, M. 2008, A&A, 487, 837
- Fukugita, Shimasaku & Ichikawa (1995) Fukugita M., Shimasaku K., Ichikawa T. 1995, PASP, 107, 945
- Gehrels et al. (2004) Gehrels, N. et al., 2004, ApJ, 611, 1005
- Heidt et al. (1999) Heidt J., Nilsson K., Fried J.W., Takalo L.O., Sillanpaa A., 1999, A&A, 348, 113
- Hillas (1985) Hillas, A.M. 1985, Proc. 19th ICRC (La Jolla, CA), 445
- Kalberla et al. (2005) Kalberla, P. M. W., Burton, W. B., Hartmann, D., Arnal E., Bajaja E., Morras R., Poppel W.G.L., 2005, A&A, 440, 775
- Li & Ma (1983) Li T.P., Ma Y.Q. 1983, ApJ, 272, 317
- Lindfors et al. (2016) Lindfors E.J. et al., 2016, A&A 593, 98
- Lombardi et al. (2011) Lombardi S. et al., 2011, Proc. 32nd ICRC (Beijing, China), arXiv:1109.6195
- Mannheim (1993) Mannheim, K, 1993, A&A, 269, 67
- Mankuzhiyil et al. (2011) Mankuzhiyil N., Ansoldi S., Persic M. Tavecchio F., 2011, ApJ, 733, 14
- Mankuzhiyil et al. (2012) Mankuzhiyil N., Ansoldi S., Persic M., Rivers E., Rothschild R., Tavecchio F., 2012, ApJ, 753, 154
- Mannucci et al. (2001) Mannucci, F, Basile, F., Poggianti, B.M. et al., 2001, MNRAS, 326, 745
- Maraschi et al. (1992) Maraschi L., Ghisellini G.,Celotti A. 1992, ApJ, 397, L5
- Mattox et al. (1996) Mattox J. R. et al., 1996, ApJ, 461, 396
- Nilsson et al. (2007) Nilsson K., Pasanen M., Takalo L. O., Lindfors E., Berdyugin A., Cipirini S., Pforr J., 2007, A&A, 475, 199
- Nilsson et al. (2016) Nilsson, K. et al., 2016 (in preparation)
- Padovani & Giommi (1995) Padovani P. Giommi P. 1995, ApJ, 444, 567
- Piner & Edwards (2004) Piner B.G., Edwards P.G. 2004, ApJ, 600, 115
- Piner & Edwards (2014) Piner B.G., Edwards P.G. 2014, ApJ, 797, 25
- Rees (1967) Rees, M.J. 1967, MNRAS, 135, 345
- Rector et al. (2003) Rector T. A., Cabzuda D. C., Stocke J. T., 2003, AJ, 125, 1060
- Roming et al. (2005) Roming P. W. A. et al., 2005, Space Sci. Rev., 120, 95
- Schlegel et al. (1998) Schlegel D.J., Finkbeiner D.P., Davis M. 1998, ApJ, 500, 525
- Tavecchio et al. (1998) Tavecchio F., Maraschi L., Ghisellini G. 1998, ApJ, 509, 608
- Tavecchio et al. (2010) Tavecchio F., Ghisellini G., Ghirlanda G. et al. 2010, MNRAS, 401, 1570
- Villata & Raiteri (1999) Villata M. Raiteri C. M. 1999, A&A, 347, 30
- Zanin et al. (2013) Zanin R. et al., 2013, Proc. 33rd ICRC, id.773
1 ETH Zurich, CH-8093 Zurich, Switzerland
2 Università di Udine, and INFN Trieste, I-33100 Udine, Italy
3 INAF National Institute for Astrophysics, I-00136 Rome, Italy
4 Università di Siena, and INFN Pisa, I-53100 Siena, Italy
5 Università di Padova and INFN, I-35131 Padova, Italy
6 Croatian MAGIC Consortium, Rudjer Boskovic Institute, University of Rijeka, University of Split and University of Zagreb, Croatia
7 Saha Institute of Nuclear Physics, 1/AF Bidhannagar, Salt Lake, Sector-1, Kolkata 700064, India
8 Max-Planck-Institut für Physik, D-80805 München, Germany
9 Universidad Complutense, E-28040 Madrid, Spain
10 Inst. de Astrofísica de Canarias, E-38200 La Laguna, Tenerife, Spain; Universidad de La Laguna, Dpto. Astrofísica, E-38206 La Laguna, Tenerife, Spain
11 University of Łódź, PL-90236 Lodz, Poland
12 Deutsches Elektronen-Synchrotron (DESY), D-15738 Zeuthen, Germany
13 Institut de Fisica d’Altes Energies (IFAE), The Barcelona Institute of Science and Technology, Campus UAB, 08193 Bellaterra (Barcelona), Spain
14 Universität Würzburg, D-97074 Würzburg, Germany
15 Institute for Space Sciences (CSIC/IEEC), E-08193 Barcelona, Spain
16 Technische Universität Dortmund, D-44221 Dortmund, Germany
17 Finnish MAGIC Consortium, Tuorla Observatory, University of Turku and Astronomy Division, University of Oulu, Finland
18 Unitat de Física de les Radiacions, Departament de Física, and CERES-IEEC, Universitat Autònoma de Barcelona, E-08193 Bellaterra, Spain
19 Universitat de Barcelona, ICC, IEEC-UB, E-08028 Barcelona, Spain
20 Japanese MAGIC Consortium, ICRR, The University of Tokyo, Department of Physics and Hakubi Center, Kyoto University, Tokai University, The University of Tokushima, KEK, Japan
21 Inst. for Nucl. Research and Nucl. Energy, BG-1784 Sofia, Bulgaria
22 Università di Pisa, and INFN Pisa, I-56126 Pisa, Italy
23 ICREA and Institute for Space Sciences (CSIC/IEEC), E-08193 Barcelona, Spain
24 also at the Department of Physics of Kyoto University, Japan
25 now at Centro Brasileiro de Pesquisas Físicas (CBPF/MCTI), R. Dr. Xavier Sigaud, 150 - Urca, Rio de Janeiro - RJ, 22290-180, Brazil
26now at NASA Goddard Space Flight Center, Greenbelt, MD 20771, USA and Department of Physics and Department of Astronomy, University of Maryland, College Park, MD 20742, USA
27Humboldt University of Berlin, Institut für Physik Newtonstr. 15, 12489 Berlin Germany
28also at University of Trieste
29now at Ecole polytechnique fédérale de Lausanne (EPFL), Lausanne, Switzerland
30now at Max-Planck-Institut fur Kernphysik, P.O. Box 103980, D 69029 Heidelberg, Germany
31now at Astrophysical Sciences Division, BARC, Mumbai, India
32also at Japanese MAGIC Consortium
33now at Finnish Centre for Astronomy with ESO (FINCA), Turku, Finland
34also at INAF-Trieste and Dept. of Physics & Astronomy, University of Bologna
35also at ISDC - Science Data Center for Astrophysics, 1290, Versoix (Geneva)
36now at IPNS, High Energy Accelerator Research Organization (KEK)
1-1 Oho, Tsukuba, Ibaraki 305-0801, Japan
37GRAPPA & Anton Pannekoek Institute for Astronomy, University of Amsterdam, Science Park 904, 1098 XH Amsterdam, The Netherlands
38ASI Science Data Center, Via del Politecnico snc I-00133, Roma, Italy
39NASA Goddard Space Flight Center, Greenbelt, MD 20771, USA