Which stars are ionizing the Orion Nebula ? 111Based on observations from the European Southern Observatory at Paranal, and the Hubble Space Telescope
Abstract
The common assumption that Ori C is the dominant ionizing source for the Orion Nebula is critically examined. This assumption underlies much of the existing analysis of the nebula. In this paper we establish through comparison of the relative strengths of emission lines with expectations from Cloudy models and through the direction of the bright edges of proplyds that Ori A, which lies beyond the Bright Bar, also plays an important role. Ori C does dominate ionization in the inner part of the Orion Nebula, but outside of the Bright Bar as far as the southeast boundary of the Extended Orion Nebula, Ori A is the dominant source. In addition to identifying the ionizing star in sample regions, we were able to locate those portions of the nebula in 3-D. This analysis illustrates the power of MUSE spectral imaging observations in identifying sources of ionization in extended regions.
1 Introduction
The central region of the Orion Nebula (NGC1976) is arguably the best studied Hii region (O’Dell et al., 2008). As the exemplar of its class of gaseous nebulae it has also been subject to many attempts at modeling the physics that occurs and the 3-D structure. We understand that it is basically an irregular concave thin layer of ionized gas lying nearer the observer than the Main Ionization Front (MIF) that marks the boundary with the host background molecular cloud. There is also a nearby foreground thin layer (the Veil) of partially ionized gas.
The usual assumption is that ionization in this region is dominated by the brightest star in the compact Trapezium group, the complex hot star Ori C, whose spectral type is usually assigned as about O6. The next hottest and most luminous star is Ori A, which lies 135″ southeast of Ori C. As one moves further from the Trapezium the degree of ionization decreases, consistent with the ionizing star or stars being in the central nebula (O’Dell & Harris, 2010). It is important in interpreting the nebula’s spectra to understand if a secondary star or stars play a role in ionization of the nebula.
The inner ionized nebula is actually very complex in structure, there being irregular features in the concave surface, the most famous of which is the Bright Bar, and there is a neutral cloud of material containing very young stars known as the Orion-South cloud (hereafter Orion-S) lying 55″ to the southwest of Ori C. Interpreting the spectra and emission-line images of the nebula demands knowing the source of ionization for each region. That is the goal of this study.
Two approaches are adopted. In Section 2 we utilize the predictions of key tracers of different degrees of ionization. In Section 3 we utilize resolved ionization fronts formed around gas surrounding many of Orion’s proplyds.
Numerous assumptions have been made in this study. There are many similar values for the distance to the Orion Nebula, but in this study we have adopted 3888 pc from the recent radio results of Kounkel et al. (2016). For Ori C, we have adopted a temperature (Tstar) of 38950 K and total luminosity in photons capable of ionizing hydrogen () of 7.351048 photons s-1 (Badnell et al., 2015). For Ori A at O9.5 V (Warren & Hesser, 1977), we use values from Table 2.3 of Osterbrock & Ferland (2006) of Tstar = 34600 K and = 3.631048 photons s-1. We express distances in the plane of the sky in parsecs, using the adopted distance.
2 Using line ratios to identify the ionizing star
The ionized layer on the observer’s side of the MIF is stratified into layers according to the varying ionization. These layers are determined by the energy of the stellar photons reaching them and this energy distribution is controlled by the absorption of the ions of the most common elements, hydrogen and helium.
Close to the ionizing star hydrogen is ionized and oxygen is doubly ionized (easily traced by the [O III] 500.7 nm line). Helium is singly ionized (easily traced by the Hei 667.8 nm line). This is the He++H+ zone. For the relatively cool Orion Nebula stars there is no higher ionization zone (where helium would be doubly ionized).
Further from the ionizing star and closer to the MIF is the narrow Heo+H+ zone, where helium is neutral and hydrogen is ionized. Nitrogen is singly ionized and is most visible in the [N II] 658.3 nm line. The easily visible Balmer H and H lines arise from both ionization zones.
2.1 The basic approach
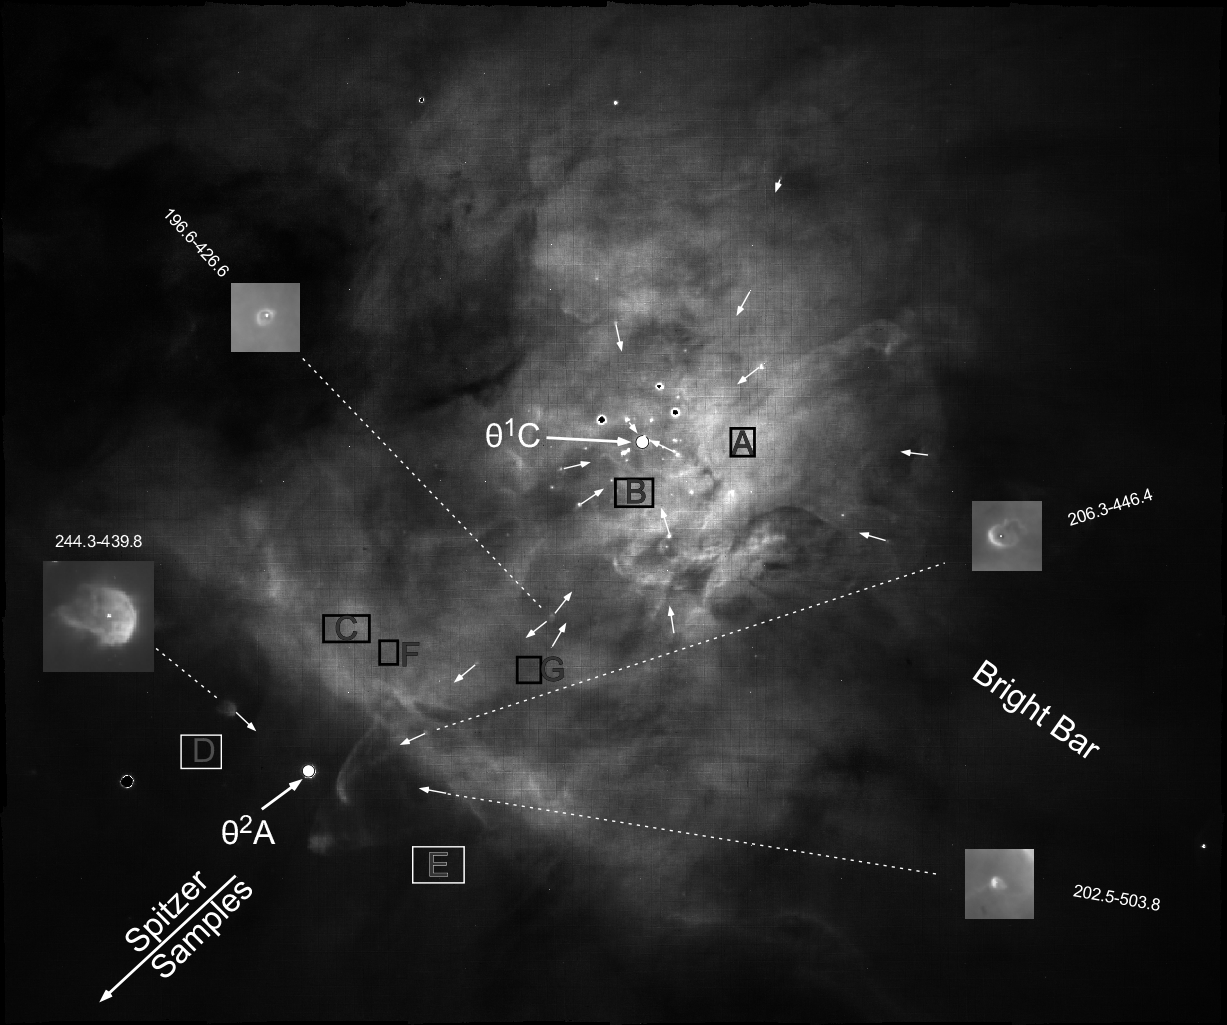
We selected seven regions that were expected to illuminate the question of the ionizing star in various parts of the Orion Nebula. These all fall within the region of calibrated monochromatic images obtained with the MUSE (Weilbacher et al., 2015) multi-aperture spectrograph. Reddening corrected line ratios from the MUSE data-base are used throughout this study. Figure 1 shows the location and sizes of these samples. They include regions near Ori C and others on both sides of the Bright Bar.
The ratio of lines F([O III])/F(H) and F(Hei)/F(H) within the He++H+ zone and F([N II])/F(H) within the Heo+H+ zone are dependent on the temperature of the ionizing star and a quantity defined as the ionization parameter U (Osterbrock & Ferland, 2006), which is the ratio of the density of photons that can ionize hydrogen to the local hydrogen density (nH). We can approximate the local hydrogen density as the electron density (ne) since hydrogen is essentially completely ionized and the contribution from Hei is small.
We can calculate the photon density () from the total ionizing photon luminosity of the ionizing star () and the true distance to the emitting layer (r), and this leads to the relation
| (1) |
where c is the velocity of light.
2.2 Calculations
In this section we present a series of new ionization simulations of the Orion H II region. We use version C17.00 of Cloudy, the spectral simulation code last described by Ferland et al. (2013). The geometry is that used by Baldwin et al. (1991). It is assumed that the physical thickness of the H+ layer that constitutes the H II region is much thinner than the separation to the ionizing stars. The geometry is plane parallel. The layer is assumed to be in hydrostatic equilibrium with the H+ layer held back against the molecular cloud by the combination of gas pressure in the X-ray emitting hot gas surrounding the star cluster, and the absorbed outward momentum in the starlight.
This model was originally applied to central regions of the Nebula, close to the Trapezium, where we are most likely viewing the H+ layer nearly face on. However, the bright Huygens region is most likely bowl shaped, as described by Ferland et al. (2013) and Wen & O’Dell (1995). The observed surface brightness of the layer is affected by two things. First, as the distance of the star increases, the flux of ionizing photons, which sets the surface brightness, falls as r-2. This causes the surface brightness to decrease with increasing radius. At the same time, the “tilt” of the H layer to our line of sight increases (see Fig 3 of Wen & O’Dell (1995)) which causes the surface brightness to increase by a factor , where is the viewing angle measured relative to the normal to the layer, As long as our line of sight passes through the entire layer, the relative emission-line intensities do not change, only their total surface brightness.
This simple geometry breaks down when the viewing angle approaches edge-on, since we then see successive regions projected on the plane of the sky, resolving the ionization structure. This occurs within the Bar (Sellgren et al., 1990) or near edges of proplyds. In this case a more complex model can be developed (Shaw et al., 2009). For simplicity, in this study we use the Baldwin et al. (1991) approach and remain mindful that it will break down in edge-on cases.
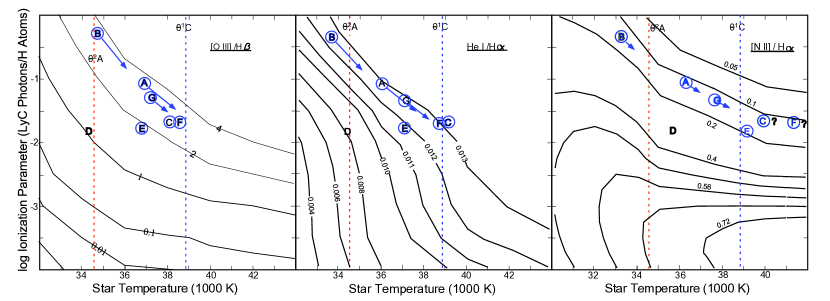
We calculated the line ratios F([O III],500.7 nm)/F(H), F(Hei,667.8 nm)/F(H), and F([N II],658.3 nm)/F(H) for a variety of conditions. The models adopted a progression of values of the ionizing star temperature and the ionization parameter. We used the stellar SED described in Badnell et al. (2015). In both figures the predicted values of the line ratios are plotted as contour lines. The lines in these ratios are at close wavelengths and relatively insensitive to reddening by foreground dust. Furthermore, the models were compared with reddening corrected line ratios.
2.3 Methodology
By comparing the derived data for each sample with the expected values for the candidate ionizing star, we can identify that star. The apparent value of U (Usky) was calculated from the equation
| (2) |
where is the separation of the sample and the candidate ionizing star and we have adopted the ne value derived from the red [S II] ratio. This calculation was done for both Ori C and Ori A. This means that a given sample is represented twice, once in Figure 2 and again in Figure 3, the first using Usky for Ori C and the second using Usky for Ori A, but the same line ratio for the sample.
We do not know r, but we do know a lower limit, . Therefore an ionization parameter calculated using (Usky) is an upper limit. If the assumed ionizing star is correct, then each derived point will lie on the intersection of the observed line ratio and Tstar or to the upper left. A greater separation means a larger difference between r and , that is, there must be a greater distance correction.
If the observed point lies to the right of the intersection or if a projection along a constant line ratio does not reach the Tstar value, then that sample is not ionized by the assumed star. We do see two points (C and F) in the F([N II])/F(H) panel of Figure 2 that lie to the right of the intersection with Tstar for Ori C. These fall in a very flat region for the predicted flux ratio. If we had adopted a smaller distance to the Orion Nebula, then the values of Usky would be larger for all points, and Samples C and F would have shifted to near the intersection. However, our adopted value for the distance is already smaller than many modern determinations, as summarized in O’Dell & Henney (2008).
It is more likely that the Cloudy model that we adopt is beginning to break-down in Sample C and Sample F due to the large viewing angle. Our model assumes that we are observing along a line-of-sight that goes through the entire H+ layer. When the MIF is highly tilted we resolve the ionization structure on the plane of the sky, and so sample along layers within the column. This compromises a comparison of a line-of-sight models against observations of a highly tilted region. We would expect that the results for the F([N II])/F(H) ratio would be affected the most since the [N II] line forms in a small part of the H+ layer. Although the peak of the tilt of the MIF is a maximum at the nearby Bright Bar, O’Dell et al. (2017) establish that the region near our Sample C and Sample F is already highly tilted.
2.4 Identifying the ionizing star from the observed ratios
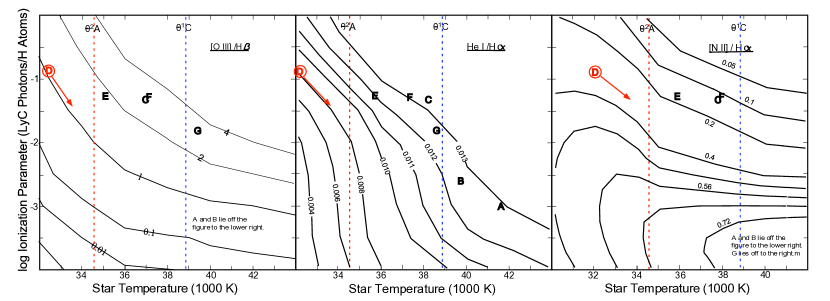
In Figure 2 we compare our observations with the brightest star in the Orion Nebula, Ori C. Figure 3 is similar, but assumes that the isolated bright star Ori A is the source.
In Figure 2 we see that Samples A, B, C, F , and G are all ionized by Ori C, although the F([N II])/F(H) ratios for Samples C and F fall to the right of Tstar( Ori C). In F([O III])/F(H) and F(Hei)/F(H) we see that all samples are consistent with ionization by Ori C, with the caveat of the remarks in Section 2.3 about the high Tstar values for Samples C and F. Taken at face value F([O III])/F(H) and F(Hei)/F(H) indicate that Samples C and F have spatial distances about equal to while Samples G , A, and B demand progressively larger corrections to the true distance. In the left and right panels it appears that Sample D could also be associated with Ori C, but in the middle panel we see that no plausible correction for distance would make the line ratio compatible with Tstar for Ori C. All of the Ori C associated samples fall within the central cavity of the nebula. Sample E can be associated with ionization by Ori C with a small adjustment in U, which is allowable even though it is much further on the sky than either of the difficult to interpret Sample C or Sample F.
In Figure 3 we note that only Sample D agrees with ionization by Ori A with similar distance corrections in all ratios. The appearance of the ionized edge of the nearby proplyd 244.3-439.8 indicates dominant ionization by Ori A but with some possible contribution by Ori C (Section 3). Clearly Samples A, B, C, F, and G are not associated with Ori A. Those samples lie on the Ori C side of the Bright Bar and have already been associated with that star. Sample E agrees with an association with Ori A in the F([O III])/(H) without a distance correction; but, In the F(Hei)/F(H) and F([N II])/F(H) ratios it lies too far to the right of Tstar for Ori A, which rules out Ori A.
The identification of the inner five samples as being ionized by Ori C falls within the accepted model of this region of the Orion Nebula, i.e. that it is a concave irregular surface.The sample apparently ionized by Ori A is consistent with the Bright Bar and the regions southeast from there being ionized by the nearest hot star. Sample E, although lying outside the Bright Bar is probably ionized by Ori C, as discussed earlier in this section.
| Sample | ne bbElectron densities are in cm-3 and are derived from the red [S II] doublet ratio using MUSE fluxes. | log U( Ori C) | log U( Ori A) | F([O III] 500.7 nm)/F(H) | F([N II] 658.3 nm)/F(H) | F(Hei 667.8 nm)/F(H) |
|---|---|---|---|---|---|---|
| A | 6160 | -0.95 | -2.92 | 3.73 | 0.120 | 0.0129 |
| B | 4310 | -0.24 | -2.54 | 3.58 | 0.136 | 0.0126 |
| C | 2090 | -1.56 | -1.28 | 2.81 | 0.125 | 0.0132 |
| D | 1230 | -1.76 | -0.81 | 1.06 | 0.307 | 0.00812 |
| E | 1610 | -1.71 | -1.26 | 1.96 | 0.180 | 0.0118 |
| F | 1860 | -1.58 | -1.22 | 2.93 | 0.116 | 0.013 |
| G | 1970 | -1.27 | -1.70 | 3.03 | 0.129 | 0.0127 |
3 Identifying the ionizing stars using observations of the proplyds
There is a completely independent method of identifying the dominant source of ionization using high resolution images of the Orion Nebula proplyds. These are young stars with circum-stellar material in or projected upon Hii regions. Under favorable orientations and locations the interior protoplanetary disks are rendered visible in silhouette. More relevant here, these disks are surrounded by much larger envelopes of gas and dust. A nearby hot star will form an ionization front in this gas that is seen as a bright arc oriented towards the ionizing star. This allows one to identify the direction in the plane of the sky of the dominant ionizing star.
In Figure 1 we have added white arrows on a representative sample of the proplyds. The arrows point in the direction of the bright arc pointing towards that proplyd’s ionizing star. The sampling is incomplete, but representative of the proplyds closest to Ori C, and includes all of the proplyds that indicate ionization by Ori A. The latter four objects (O’Dell et al., 1993; O’Dell & Wen, 1994) are labeled with their names in the position-based designation system introduced by O’Dell & Wen (1994) and later refined (O’Dell et al., 2015). The orientation of the bright arcs of those proplyds ionized by Ori C are well illustrated in O’Dell (1998). Those four associated with Ori A are shown in enlargements. It is to be noted that the circumstellar gas of 196.6-426.6 is clearly ionized by both stars as may be the case for 244.3-439.8.
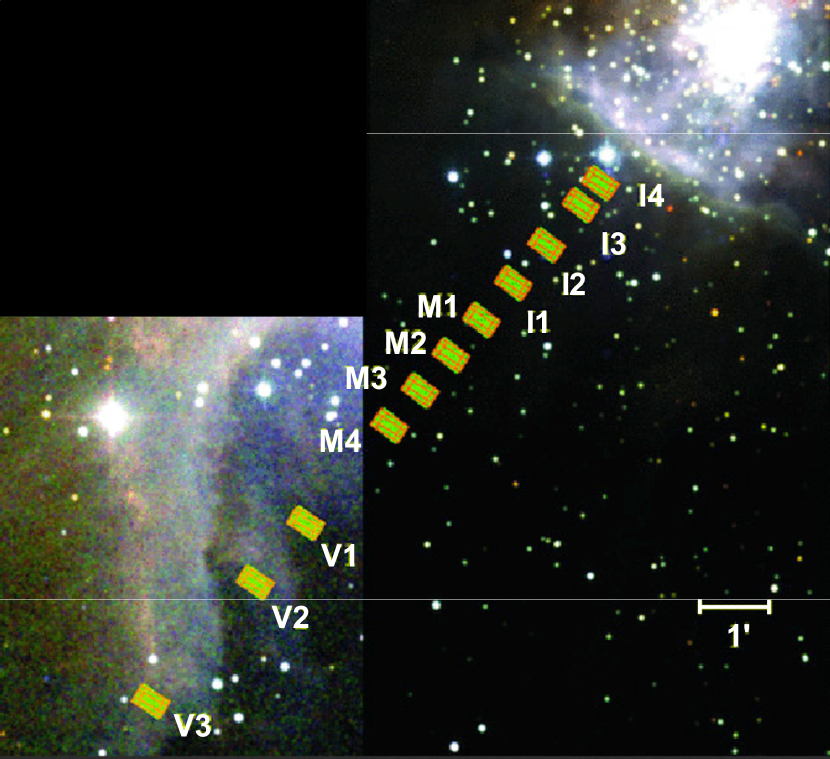
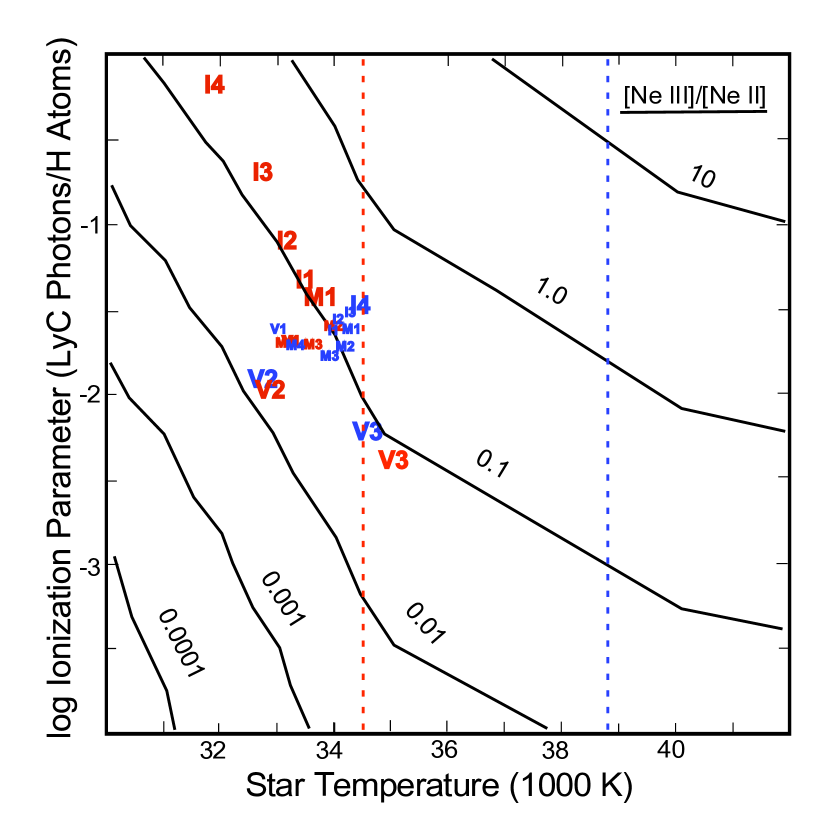
4 Using Spitzer Space Telescope Infrared Spectra Line Ratios
Published Spitzer Space Telescope observations of the infrared [Ne III] 15.6 µm and [Ne II] 12.8 µm lines are also useful for determining the ionizing star. These are particularly useful because they both arise in the same He++H+ zone and are unaffected by emission from the Heo+H+ zone and any changes of abundances, as is the case for our optical line ratios. In the study of Rubin et al. (2011) observations were made at eleven locations to the southeast of the central Orion Nebula. These samples all lie outside the Bright Bar, with the innermost being close to Ori A. The progression of increasing distances is I4, I3, I2, I1, M1, M2, M3, M4, V1, V2, and V3. They all lie in a smooth region between the Bright Bar and the boundary of the Extended Orion Nebula (EON). Sample V2 falls near the edge of the sharp southeast boundary of the EON and Sample V3 falls on this boundary. These samples do not agree with the results from the others because Sample V3 is certainly an ionization front viewed edge-on and Sample V2 is probably a region that is rising towards that feature (Rubin et al., 2011) and thus our Cloudy models do not provide a guide to the conditions (Section 2.3). They are not similar to the other samples and are not included in our discussion of the general properties of the Spitzer samples.
We have compared the neon line ratios with the predictions from the same set of Cloudy calculations used in the analysis of the optical line ratios. We have used the Rubin et al. (2011) [S II] ne densities derived from overlapping optical observations for each sample. The results are shown in Figure 5.
Figure 5 shows that all of the samples that assume Ori C to be the ionizing star (blue labels) cluster near Tstar about 34000 K. This is clear evidence that Ori C does not ionize the region southwest of the Bright Bar. To reconcile the observations with Tstar for Ori C would require all of the samples to have a large and similar correction for projection effects, even though their separations in the plane of the sky range from 2.6′ to 12.08′.
The comparison with the results assuming Ori A (red labels) are fully consistent with that star as the dominant ionizing star, since Sample I4 is closest to Ori A and our Sample D in the plane of the sky and the I3, I2, and I1 samples progress further away. Their locations in Figure 5 indicate a succession of corrections for projection effects and at large distances the samples are close to Tstar for Ori A.
5 Discussion
The results of Section 2 and Section 3 show similar but not identical results. Some of the differences may be explained by the methodology.
The F([O III])/F(H) and F(Hei)/F(H) line ratios are indicators of the conditions in the He++H+ zone as [O III] and Hei emission arise only there as does most of the H emission. The gas density decreases (O’Dell, 2001) with increasing distance from the MIF, therefore most of the emission used in the F([O III])/F(H) and F(Hei)/F(H) line ratios method occurs near the onset of the He++H+ zone, with a lesser H contribution from the narrower Heo+H+ zone. The distributions of doubly ionized oxygen (producing the [O III] emission) and Hei ions (producing the 667.8 nm emission) are slightly different within the He++H+ zone. This means that the ratios using these two ions will give slightly different results. In the Heo+H+ zone the [N II] emission is well constrained, but the fact that the H emission comes mostly from the He++H+ zone, means that the F([N II])/F(H) ratio is intrinsically not as good a diagnostic.
In contrast, the proplyds give an indication of the ionization of objects located somewhere along the line of sight from the foreground Veil and the MIF. The Orion Nebula Cluster is centered near the Trapezium and monotonically decreases in stellar density with increasing distance in all directions. This means that a proplyd lying in the same direction as a ratios sample can lie well displaced towards the observer. This difference of sampling can explain the similarities and differences in the results.
5.1 Location of the samples along the line of sight
We can, however, approximately determine the position of the MIF samples with respect to the plane in the sky of the ionizing star. For each observed sample we can compare the ”observed” Usky with the value where the same line ratio intersects Tstar. The shift in U gives us the square of r/, hence that ratio. For example, if the Usky is four times larger than where that line ratio intersects Tstar, then Usky is four times too large and the true distance (r) is twice the separation in the plane of the sky (). It follows that the angle of r with respect to the plane of the sky () will be arccos(/r) and the distance along the line of sight (Z) is Z = tan . What we actually determine is and Z.
Assignment to positive (towards the observer) or negative can usually be determined by comparing the Z values with respect to the quantitative models of the Orion Nebula. From the ratio of the surface brightness in the radio continuum with that expected from ionization by Ori C, both Wen & O’Dell (1995) and Henney et al. (2005) derived a model of a concave surface with ridges (e.g. the one producing the Bright Bar). The former presumed a distance to the nebula of 500 pc and the latter 430 pc. Their derived separation (Z) values were -0.2 pc and about -0.15 pc. In their study of the spectrum of the substellar point using Cloudy, Badnell et al. (2015) used 0.10 pc. We assume in our discussion that the sub- Ori C distance is -0.15 pc. The line of sight positions of the samples can now be discussed in the order of increasing distance from their ionizing stars.
| Sample | Ionizing Star | (pc) | r/ | Z (pc) | |
|---|---|---|---|---|---|
| A | Ori C | 0.054 | 1.77 | -60° | -0.094 |
| B | Ori C | 0.028 | 4.37 | -78° | -0.134 |
| C | Ori C | 0.189 | 1.134 | 28° | 0.101 |
| D | Ori A | 0.060 | 2.81 | -72° | - 0.180 |
| E | Ori C | 0.254 | 1.78 | 60° | 0.444 |
| F | Ori C | 0.179 | 1.134 | 28° | 0.096 |
| G | Ori C | 0.139 | 1.53 | 55° | 0.196 |
5.1.1 Samples ionized by Ori C
for Sample A and B must be negative, otherwise samples this close to Ori C would not be ionized by direct radiation. Sample A would have Z = -0.09 pc and Sample B would have Z = -0.13 pc, the latter being comparable to the sub- Ori C distance and the former sample being 0.04 pc closer to the observer. This agrees with the rapid increase of surface brightness west of Ori C.
If the values for Samples C, F, and G were negative, then this would imply that the nebula is basically flat to the southeast from Ori C. This is incompatible with the fact that the surface brightness in H is nearly constant (which requires that the surface curves towards the observer because the ionizing flux from Ori C falls with r). These samples must have positive values of and Z, which indicates that the MIF surface has risen about 0.3 pc from the sub- Ori C point over a distance of about 0.2 pc.
Sample E certainly has positive values since it lies southeast of the Bright Bar, with this region being 0.44 pc towards the observer from the plane of Ori C and 0.6 pc above the sub- Ori C point at a distance of 0.3 pc. Samples C, E, F, and G taken together indicate that the MIF rises steeply towards the observer to the southeast from Ori C, which is the direction of the Bright Bar.
The region outside of the Bright Bar changes at about the position of the HH 203 and HH 204 shocks. To the northeast of these shocks F([N II])/F(H) is high and F([O III])/F(H) is low. This is reversed to the southwest of these shocks and agrees with our Sample D and Sample E values. This transition is illustrated well in an F([N II])/F(H) image such as Figure 24 of O’Dell et al. (2015).
The southwest high ionization region is marked by numerous crenellations lying immediately southeast of the Bright Bar. These features have sharp boundaries and are likely to be shocks driven by a series of outflows from the Orion-S star formation region (O’Dell et al., 2015).
If these shocks and earlier precursors are contributing to ionization in the region around Sample E, we can then accept that the sample does not give consistent results for the distance correction for either for Ori C and it may be that Ori A is playing a secondary role in ionizing this region.
5.1.2 Samples ionized by Ori A
The region between Sample D and Ori A is relatively smooth and structure-free (except for the overlying shocks of HH 203 and HH 204). This means that the sample must lie away from the observer relative to the plane of Ori A. The progression of decreasing displacements of the neon line ratios in going from Sample I4 to Sample I1 indicates that Sample I4 is well beyond Ori A but by position I1 the ionization front is close to the same plane as Ori A.
This result is quite different from that in Rubin et al. (2011). In that study they argue in a qualitative way that all of the region along their samples (to the southeast, beyond the Bright Bar) is ionized by Ori C, under the assumption that Ori A is incapable of creating local [Ne III] emission. Our Cloudy models indicate that this is not the case and our examination of the variations of the F([Ne III])/F([Ne II]) ratio firmly establish that Ori A is the dominant ionizing star in this region.
In Section 2.4 we established that Sample E, which lies outside the Bright Bar, is dominantly ionized by Ori C. However, this identification was good only for the F([O III])/F(H) and F(Hei)/F(H) ratios with a surprisingly large distance correction, while F([N II])/F(H) indicated that no distance correction was required. In the comparison with line ratios predicated on ionization by Ori A, the observed points were close to Tstar for that star, but always slightly hotter. It is most likely that Sample E is ionized by both Ori C and Ori A.
6 Conclusions
We have confirmed the usual assumption that the bright portion of the Orion Nebula lying within the boundary of the southeast Bright Bar is dominantly ionized by the hottest star in the Trapezium grouping ( Ori C). With the exception of a single region (Sample E), all of the regions lying southeast of the Bright Bar are dominantly ionized by the much cooler isolated star Ori A. Sample E is most likely ionized by both stars. This conclusion is verified by the orientation of the ionization boundaries of proplyds, with the exception of one proplyd (196.6-422.6)) that probably lies at a small spatial distance from Ori A.
References
- Badnell et al. (2015) Badnell, N. R., Ferland, G. J., Gorczyca, T. W., Nikolić, D., & Wagle, G. A. 2015, ApJ, 804, 100
- Baldwin et al. (1991) Baldwin, J. A., Ferland, G. J., Martin, P. G., et al. 1991, ApJ, 374, 580
- Ferland et al. (2013) Ferland, G. J., Porter, R. L., van Hoof, P. A. M. 2013, RMxAA, 49, 137
- Goicoechea et al. (2016) Goicoechea, J. R., Pety, J., Cuadrado, S., et al. 2016, Nature, 537, 207
- Goicoechea et al. (2015) Goicoechea, J. R., Teyssier, D., Etxaluze, M., et al. 2015, ApJ, 815, 75
- Henney et al. (2005) Henney, W. J., Arthur, S. J., & Garcia-Diaz, Ma.-T. 2005, ApJ, 627, 813
- Kounkel et al. (2016) Kounkel, M., Hartmann, L., Loinard, L., et al. 2016, ApJ, in press
- Mesa-Delgado et al. (2011) Mesa-Delgado, A., Núñez-Díaz, M., Esteban, C., et al. 2011, MNRAS, 411, 2076
- Muench et al. (2008) Muench, A., Getman, A., Hillenbrand, L., & Preibisch, T. 2008, in Handbook of Star Forming Regions, Vol. 1:The Northern Sky ASP Monograph Publications, Vol. 4, ed. B. Reipurth, p. 483
- Nagy et al. (2015) Nagy, Z., Ossenkopf, V., Van der Tak, F. F. S., et al. 2015, A&A, 578, 124
- O’Dell (1998) O’Dell, C. R., 1998, AJ, 115, 263
- O’Dell (2001) O’Dell, C.R., 2001, ARA&A, 39, 99
- O’Dell et al. (2015) O’Dell, C. R., Ferland, G. J., Henney, W. J., et al. 2015, AJ, 150, 108
- O’Dell et al. (2017) O’Dell, C. R., Ferland, G. J., & Peimbert, M., 2017, MNRAS, 464, 4835
- O’Dell & Harris (2010) O’Dell, C. R., & Harris, J. A. 2010, AJ, 140, 985
- O’Dell & Henney (2008) O’Dell, C. R., & Henney, W. J. 2008, AJ, 136, 1566
- O’Dell et al. (2008) O’Dell, C. R., Muench, A., Smith, N., & Zapata, L. 2008, in Handbook of Star Forming Regions, Vol. 1:The Northern Sky ASP Monograph Publications, Vol. 4, ed. B. Reipurth, p. 544
- O’Dell & Wen (1994) O’Dell, C. R., & Wen, Z. 1994, ApJ, 436, 194
- O’Dell et al. (1993) O’Dell, C. R., Wen, Z., & Hu, X.-H., 1993, ApJ, 410, 696
- Osterbrock & Ferland (2006) Osterbrock, D. E., & Ferland, G. J. 2006, Astrophysics of Gaseous Nebulae and Active Galactic Nuclei (second edition), University Science Books (Mill Valley)
- Rubin et al. (2011) Rubin, R. H., Simpson, J. P., O’Dell, C. R., et al. 2011, MNRAS, 410, 1320
- Sellgren et al. (1990) Sellgren, K., Tokunaga, A. T., & Nakada, Y. 1990, ApJ, 349, 120
- Shaw et al. (2009) Shaw, G., Ferland, G. J., Henney, W. J., et al. 2009, ApJ, 701, 677
- Wen & O’Dell (1995) Wen, Z., & O’Dell, C. R. 1995, ApJ, 438, 784
- Warren & Hesser (1977) Warren, W. H, Jr., & Hesser, J. E. 1977, ApJS, 34, 115,
- Weilbacher et al. (2015) Weilbacher, P. M., Monreal-Ibero, A., Kollatschny, W., et al. 2015, A&A, 582, 114