Azimuthally differential pion femtoscopy relative to the second and third harmonic in Pb–Pb 2.76 TeV collision from ALICE
Abstract
Azimuthally differential femtoscopic measurements, being sensitive to spatio-temporal characteristics of the source as well as to the collective velocity fields at freeze-out, provide very important information on the nature and dynamics of the system evolution. While the HBT radii modulations relative to the second harmonic event plane reflect mostly the spatial geometry of the source, the third harmonic results are mostly defined by the velocity fields [1]. Radii variations with respect to the third harmonic event plane unambiguously signal a collective expansion and anisotropy in the flow fields. Event shape engineering (ESE) is a technique proposed to select events corresponding to a particular shape. Azimuthally differential HBT combined with ESE allows for a detailed analysis of the relation between initial geometry, anisotropic flow and the deformation of source shape. We present azimuthally differential pion femtoscopy with respect to second and third harmonic event planes as a function of the pion transverse momentum for different collision centralities in Pb–Pb collisions at = 2.76 TeV. All these results are compared to existing models. The effects of the selection of the events with high elliptic or triangular flow are also presented.
keywords:
LHC, ALICE, HBT, femtoscopy, final eccentricity, elliptic shape, freeze-out, Azimuthally differentialNuclear Physics A \runauth \jidnupha \jnltitlelogoNuclear Physics A
XXVIth International Conference on Ultrarelativistic Nucleus-Nucleus Collisions
(Quark Matter 2017)
1 Introduction
The correlation of two identical particles at small relative momentum, commonly known as intensity, or Hanbury Brown-Twiss (HBT), interferometry, is an effective tool to study the space-time structure of the emitting source in relativistic heavy-ion collisions [2]. Due to the position-momentum correlations in particle emission, the so-called HBT radii become sensitive to the collective velocity fields, from which information about the dynamics of the system evolution can be extracted. Azimuthally differential femtoscopic measurements can be performed relative to the direction of different harmonic flow planes [3]. In particular, measurements of the HBT radii relative to the second harmonic flow provide information on the final shape of the system, which is expected to become more spherical compared to the initial state due to stronger in-plane expansion. In contrast, the azimuthal dependence of the HBT radii relative to the third harmonic flow plane can originate only from the the anisotropies in collective flow gradients, and the observation of any HBT radii azimuthal dependence will unambiguously signals a collective expansion and anisotropy in the flow fields [1]. Event shape engineering (ESE) is a relatively new technique which selects on the magnitude of the flow vector [4]. This selection can provide more control on the initial shape of the source.
2 Experimental analysis and results
The data Pb–Pb data used in this analysis were collected by ALICE in 2011. The Time
Projection Chamber (TPC) was used to
reconstruct the tracks in the pseudorapidity range as well as to identify pions via the specific ionization energy
loss d/d associated with each track. In addition to the TPC, the Time-Of-Flight (TOF) detector was used for identifying pions with transverse
momentum 0.5 GeV/c. The second and third harmonic event plane angles, and , were determined using TPC tracks.
The correlation function was calculated as the ratio of and , where
is the relative 3-momentum of two pions,
is the same-event distribution of particle pairs, and
is the background distribution of uncorrelated particle
pairs obtained using mixed events technique.
The Bertsch-Pratt [5] out–side–long
coordinate system was used [5].
The correlation function is fitted to
| (1) |
where is the normalization factor, is the chaoticity, and . The function describes the Bose-Einstein correlations and is the Coulomb correction. In this analysis the Gaussian form of was used [6]:
| (2) |
where the parameters , , and are traditionally called HBT radii in the out, side, and long directions. The cross-terms , , and describe the correlation in the out-side, side-long, and out-long directions, respectively.
| (3) |
where . Fitting the radii’s azimuthal dependence with the functional form of Eq.3 allows us to extract the average radii and the amplitude of oscillations [7] for the second harmonic results.
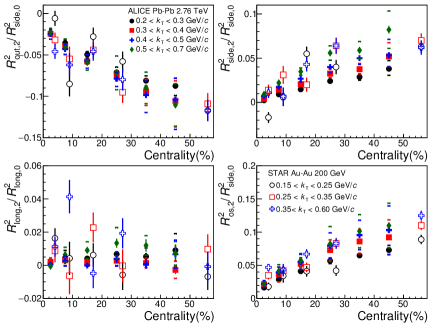
Figure 1 [7] shows the relative amplitudes of the radius oscillations , , , and . We observe similar results to that of STAR, however the STAR results [8, 9] show on average larger oscillations for . Our relative amplitudes for , , and show a clear centrality dependence, whereas the is very close to zero for all centralities, similarly to the results from RHIC [8].
The final source eccentricity at freeze-out
can be estimated with an accuracy within 20–30% as
[10].
Figure 2 [7] presents
for different ranges as a function of the initial-state
eccentricity for six different centralities.
We find a smaller final-state anisotropy in
the LHC regime compared to RHIC energies [11, 8]. In Fig. 2,
we also compare our results to the 3+1D hydrodynamic
calculations [12], this model
slightly underestimates the final source eccentricity.
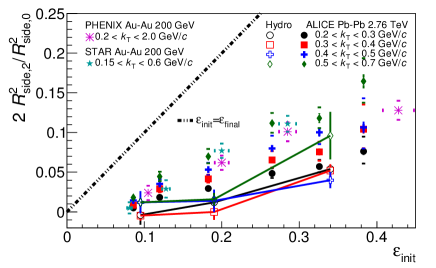
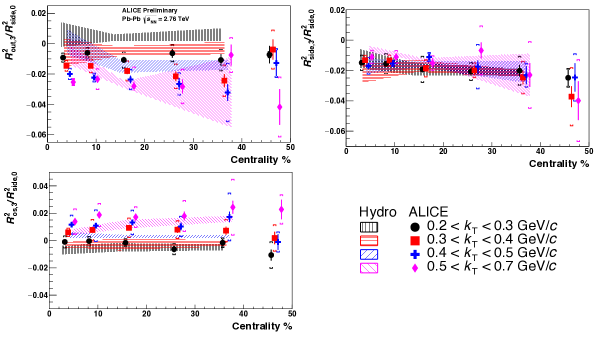
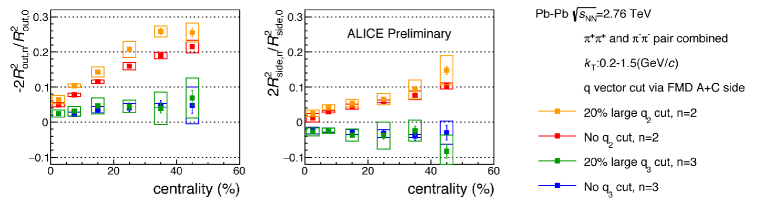
Figure 3 shows the relative amplitudes of the radius oscillations , , and . The relative amplitudes for and have negative values for all centralities and cuts. We compare our results with the 3+1D hydrodynamic calculations [12], where the relative amplitudes and agree quantitatively, and the relative amplitudes agree qualitatively with the 3+1D hydrodynamical calculations [12]. The relative amplitudes of the third harmonic results exhibit weak centrality and dependence. According to the 3+1D hydrodynamical calculations, the negative signs of oscillations of and are an indication that the initial triangularity has been washed-out or even reversed due to the triangular flow. In the event shape engineering analysis, events were selected based on the magnitude of the second (third) order flow vector () [4], the Forward Multiplicity detector (FMD) was used to select on the magnitude of the flow vectors (-3.4 -1.7, 1.7 5). We studied the effect of selecting the top 20% of the flow vector () on the magnitude of the flow (). An enhancement of about 25% (15%) for () was observed for all centralities. Figure 4 shows the effect of large () selection on the relative amplitudes of the radii oscillations () and ( ). The large selection significantly enhances the relative amplitudes of the radius oscillations and slightly enhanced , possibly selecting more elliptic initial source. However, the large selection doesn’t affect the relative amplitudes of the radius oscillations.
3 Summary
We have performed a measurement of two-pion azimuthally differential femtoscopy relative to the second and third harmonic flow plane in Pb–Pb collisions at = 2.76 TeV. The final-state source eccentricity, estimated via side-radius oscillations relative to the second harmonic flow plane, is noticeably smaller than at lower collisions energies, but still exhibits an out-of-plane elongated source at freeze-out even after a stronger in-plane expansion. The negative signs of the relative amplitudes of radii oscillation, and , measured relative to the third harmonic flow plane, are an indication that the initial triangularity is washed-out or even reversed according to the 3+1D hydrodynamic calculations. The azimuthally differential HBT combined with ESE measurements were performed. The large selection has significant enhancement on the HBT radii relative to the second harmonic flow plane, whereas large selection has no effect on the HBT radii relative to the third harmonic flow plane.
Acknowledgement
This material is based upon work supported by the U.S. Department of Energy Office of Science, Office of Nuclear Physics under Award Number DE-FG02-92ER-40713.
References
- [1] S. A. Voloshin, J. Phys. G38 (2011) 124097. arXiv:1106.5830, doi:10.1088/0954-3899/38/12/124097.
- [2] G. Bertsch, M. Gong, M. Tohyama, Phys. Rev. C37 (1988) 1896–1900. doi:10.1103/PhysRevC.37.1896.
- [3] S. A. Voloshin, W. E. Cleland, Phys. Rev. C53 (1996) 896–900. arXiv:nucl-th/9509025, doi:10.1103/PhysRevC.53.896.
- [4] J. Schukraft, A. Timmins, S. A. Voloshin, Phys. Lett. B719 (2013) 394–398. arXiv:1208.4563.
- [5] S. Pratt, Phys. Rev. D33 (1986) 1314–1327. doi:10.1103/PhysRevD.33.1314.
- [6] S. Pratt, T. Csörgő, J. Zimányi, Phys. Rev. C 42 (1990) 2646–2652. doi:10.1103/PhysRevC.42.2646.
- [7] D. Adamova, et al.arXiv:1702.01612.
- [8] J. Adams, et al., Phys. Rev. Lett. 93 (2004) 012301. arXiv:nucl-ex/0312009, doi:10.1103/PhysRevLett.93.012301.
- [9] J. Adams, et al., Phys. Rev. C71 (2005) 044906. arXiv:nucl-ex/0411036, doi:10.1103/PhysRevC.71.044906.
- [10] F. Retiere, M. A. Lisa, Phys. Rev. C70 (2004) 044907. arXiv:nucl-th/0312024, doi:10.1103/PhysRevC.70.044907.
- [11] A. Adare, et al., Phys. Rev. Lett. 112 (2014) 222301. arXiv:1401.7680, doi:10.1103/PhysRevLett.112.222301.
- [12] P. Bozek, Phys. Rev. C89 (2014) 044904. arXiv:1401.4894, doi:10.1103/PhysRevC.89.044904.
- [13] S. Ghosh, S. K. Singh, S. Chatterjee, J. Alam, S. Sarkar, Phys. Rev. C93 (2016) 054904. arXiv:1601.03971, doi:10.1103/PhysRevC.93.054904.