Extensive globular cluster systems associated with ultra diffuse galaxies in the Coma cluster
Abstract
We present Hubble Space Telescope imaging of two ultra diffuse galaxies (UDGs) with measured stellar velocity dispersions in the Coma cluster. The galaxies, Dragonfly 44 and DFX1, have effective radii of kpc and kpc and velocity dispersions of km s-1 and km s-1, respectively. Both galaxies are associated with a striking number of compact objects, tentatively identified as globular clusters: for Dragonfly 44 and for DFX1. The number of globular clusters is much higher than expected from the luminosities of the galaxies but is consistent with expectations from the empirical relation between dynamical mass and globular cluster count defined by other galaxies. Combining our data with previous HST observations of Coma UDGs we find that UDGs have a factor of more globular clusters than other galaxies of the same luminosity, in contrast to a recent study of a similar sample by Amorisco et al. (2017), but consistent with earlier results for individual galaxies. The Harris et al. (2017) relation between globular cluster count and dark matter halo mass implies a median halo mass of M⊙ for the sixteen Coma UDGs that have been observed with HST so far, with the largest and brightest having M⊙.
Subject headings:
galaxies: clusters: individual (Coma) — galaxies: evolution — galaxies: structure1. Introduction
The discovery of large, extremely faint, spheroidal objects in galaxy clusters dates at least to Impey, Bothun, & Malin (1988), who noticed several such objects in photographic studies of the Virgo cluster. Over the following three decades several more were found (e.g., Dalcanton et al. 1997), but it was only recognized recently how common they are. Using the Dragonfly Telephoto Array (Abraham & van Dokkum 2014), 47 galaxies with half-light radii kpc and central surface brightness mag arcsec-2 were found in the Coma cluster (van Dokkum et al. 2015a). The galaxies appear smooth and spheroidal, and have a much lower Sersic (1968) index than elliptical galaxies ( versus for ellipticals). These remarkable objects were dubbed “ultra diffuse galaxies”, or UDGs. The number of known UDGs quickly expanded in the past two years, with many more examples found in Coma (Koda et al. 2015), Virgo (Mihos et al. 2015), other clusters (van der Burg, Muzzin, & Hoekstra 2016), and in low density environments (Martínez-Delgado et al. 2016; Merritt et al. 2016; Román & Trujillo 2017).
It is still unknown how UDGs fit in the general framework of galaxy formation and evolution. One possibility is that most UDGs are closely related to smaller galaxies of the same luminosity: they may have originated as small galaxies that were puffed up by tidal interactions (see, e.g., Collins et al. 2013), or represent the high angular momentum tail of the general population of dwarf galaxies (Amorisco & Loeb 2016). Another possibility is that many UDGs are “failed” galaxies, with truncated star formation histories. Strong feedback from supernovae or active nuclei could produce underluminous galaxies, perhaps in combination with environmental effects (Agertz & Kravtsov 2015; Yozin & Bekki 2015; Di Cintio et al. 2017).
Intriguingly, an important clue to the formation of these diffuse galaxies comes from the most compact stellar systems in the universe. Beasley et al. (2016) found that the UDG VCC 1287 in Virgo has a surprisingly large number of globular clusters for its luminosity. Similar results were subsequently reported for the Coma UDGs Dragonfly 17 (Peng & Lim 2016) and Dragonfly 44 (van Dokkum et al. 2016). These early results, together with the first measurements of the kinematics of UDGs (Beasley et al. 2016; van Dokkum et al. 2016), indicated that UDGs are fundamentally different from other galaxies of the same luminosity.
However, other studies have cast doubt on this interpretation. Some large, low surface brightness objects seem to be tidally-disrupted low mass galaxies (Collins et al. 2013; Merritt et al. 2016), and there is large variation in the cold gas fraction among field UDGs (Papastergis, Adams, & Romanowsky 2017). Furthermore, it has been suggested that massive, globular cluster-rich systems are the exception, not the rule: Amorisco, Monachesi, & White (2017) report that UDGs have no statistically-significant excess of globular clusters compared to normal dwarf galaxies with the same stellar mass. Amorisco et al. come to this conclusion from a comparison of the positions of compact objects in the Hammer et al. (2010) HST/ACS Coma Cluster Treasury program (CCTp; Carter et al. 2008) catalog to the positions of low surface brightness objects in the Yagi et al. (2016) catalog.
In this Letter we contribute to this discussion by measuring the globular cluster populations in two large Coma UDGs using HST. We also analyze all archival HST/ACS images of UDGs in Coma.
2. Data
2.1. Kinematics
In 2016 we obtained very deep spectroscopy of several low surface brightness objects in the Coma cluster with the Deep Imaging Multi-Object Spectrograph (DEIMOS) on the Keck II telescope. The primary targets were Dragonfly 44, one of the largest UDGs in Coma, and a similar-looking galaxy that we dubbed DFX1. The latter object was visually identified in an archival CFHT/Megacam image; its J2000 coordinates are , and it is listed in various previous catalogs (2175 in Godwin, Metcalfe, & Peach 1983; 13 in Yagi et al. 2016). It was not in the original Dragonfly UDG catalog as we removed all objects that were detected in the Sloan Digital Sky Survey. We also obtained a spectrum of Dragonfly 42, a very faint UDG.
The instrumental resolution ( km s-1) and exposure time (120,600 s) were sufficient for measuring the central stellar velocity dispersions of both Dragonfly 44 and DFX1. For Dragonfly 44 we measure km s-1, as described in van Dokkum et al. (2016). Using the same methodology we find km s-1 for DFX1. Its redshift is . For Dragonfly 42 we could only measure the redshift: . DFX1 and Dragonfly 42 contribute to the steadily growing sample of UDGs with confirmed distances (see Kadowaki, Zaritsky, & Donnerstein 2017), and our redshifts confirm that Dragonfly 44, DFX1, and Dragonfly 42 are all members of the Coma cluster.111The redshift of Dragonfly 44 was not listed in van Dokkum et al. (2016), except erroneously inside Fig. 2 of that paper. The correct redshift is . Dragonfly 42 and Dragonfly 44 are likely bound, as their radial velocities are less than km s-1 apart.
2.2. HST Imaging
HST imaging for Dragonfly 44 and DFX1 was obtained in the Cycle 24 program GO-14643. Each galaxy was observed for three orbits in and one orbit in , using a standard dither pattern to eliminate hot pixels. We used ACS/WFC for DFX1 but WFC3/UVIS for Dragonfly 44 as this enabled us to simultaneously observe Dragonfly 42 in a parallel ACS observation. The CTE-corrected, drizzled images created by the STScI pipeline were used. The three images were rotated and shifted to the frame of the image and combined. In the combination step remaining deviant pixels in the individual images were replaced by the average of the other two frames. The point-source depth was measured from the rms of the counts in empty apertures with diameter pixels, corrected to using theoretical growth curves (see Labbé et al. 2003). We find AB depths of and for Dragonfly 44 and and for DFX1. The relatively modest depth of the ACS imaging can be attributed to the now quite severe CTE effects.
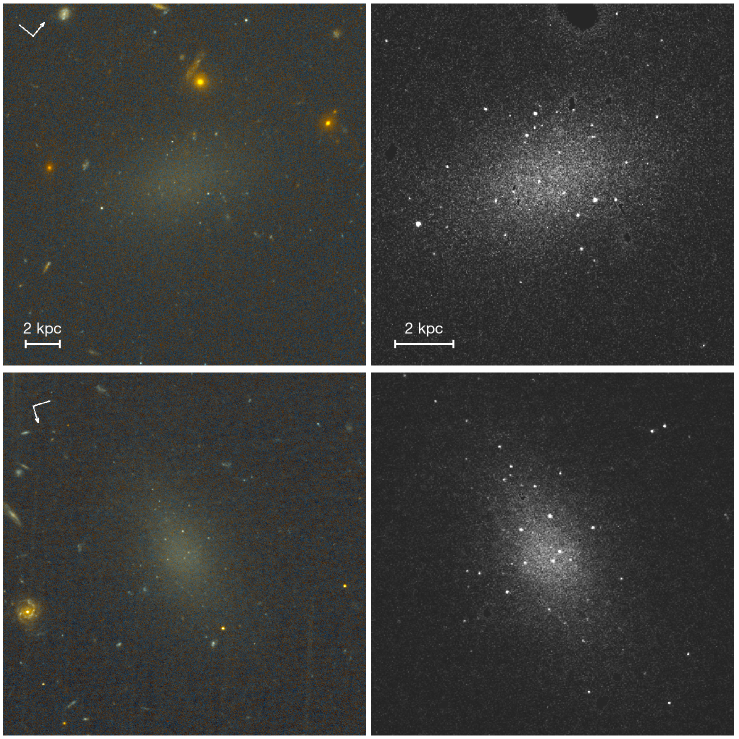
The HST images of Dragonfly 44 and DFX1 are shown in Fig. 1; Dragonfly 42 is discussed in § 4. The left panels are color images created from the and exposures; the right panels show the deep data at high contrast after masking spatially-extended objects (see § 4). Both galaxies are smooth and elongated, with no obvious tidal features, spiral arms, star forming regions, or other irregularities. The most striking aspect of Fig. 1, and the central topic of this Letter, is the fact that both UDGs are associated with a large number of compact objects. For Dragonfly 44 this was already seen in ground-based imaging, although not as clearly (see van Dokkum et al. 2016). For both galaxies the distribution of compact objects has a broadly similar orientation and flattening as the smooth light.
3. Globular Clusters in Dragonfly 44 and DFX1
The compact objects were identified and characterized in the following way. First, the light of the UDGs was fit with a 2D Sersic profile, using the GALFIT code (Peng et al. 2002). Neighboring objects, as well as the compact sources, were masked. The fit was done multiple times, improving the mask in each iteration. The best-fitting Sersic model has effective radius kpc, central surface brightness , and Sersic index for Dragonfly 44 and kpc, , and for DFX1. The results for Dragonfly 44 are in good agreement with previous ground-based measurements (van Dokkum et al. 2015b, 2016). We also fit the data, keeping all parameters except the sky value and the normalization fixed to the results. The colors of the two galaxies are the same, within the uncertainties: for Dragonfly 44 and for DFX1. The total magnitudes are and respectively.
After subtracting the best-fitting GALFIT models an object catalog was created using SExtractor (Bertin & Arnouts 1996), using default parameters. Globular cluster candidates were selected by the criterion , where is the flux ratio in pixel and pixel apertures. Stars with a high signal-to-noise (S/N) ratio have ; the broad selection range ensures that unresolved objects with low S/N are included in the sample, at the expense of some contamination by compact galaxies.
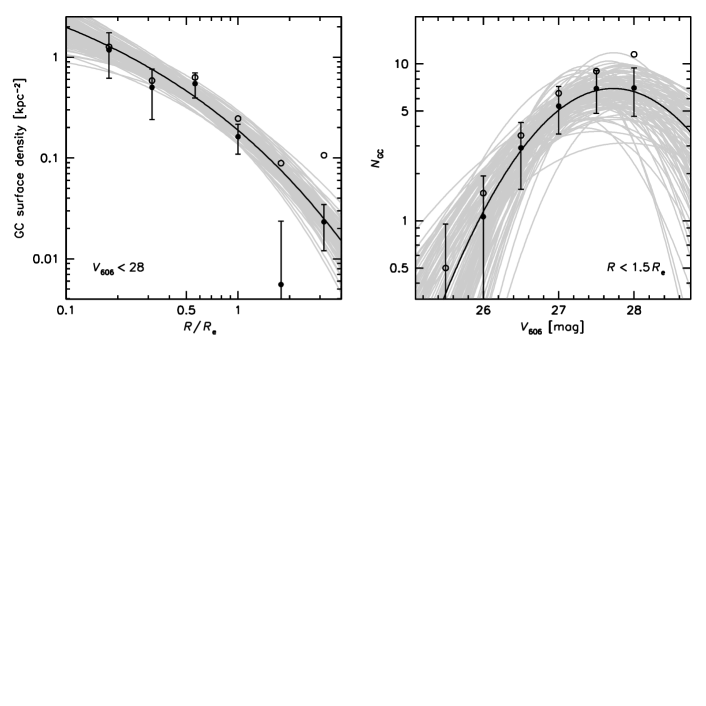
The surface density of compact objects associated with the two galaxies is shown in the left panel of Fig. 2. The number density was measured in elliptical annuli that are scaled to the half-light radius. In each annulus the number of compact objects with was measured and divided by the area of the annulus (open circles). A contamination correction was applied by subtracting the average number density of objects with , , and distances . The measurements were done separately for Dragonfly 44 and DFX1 and then averaged.
The radial distribution confirms the visual impression of a significant overdensity of compact objects. We fit a Sersic profile to the combined, binned distribution using the emcee methodology (Foreman-Mackey et al. 2013), with a prior on the Sersic index of . The best fit has and , with the half-number radius of the globular cluster distribution.222We find similar results when fitting the profiles of the individual galaxies rather than the average. Forcing , i.e., a similar functional form as the stellar light, we find . We conclude that the distribution of globular clusters is more extended than the galaxy light, as was previously found for luminous galaxies (Kartha et al. 2014; Hargis & Rhode 2014) and the UDG Dragonfly 17 (Peng & Lim 2016), but that the precise value of is not well constrained by our data.
The luminosity function of compact objects within is shown in the right panel of Fig. 2. The number rises sharply from to , where it seems to plateau. The canonical luminosity function of globular clusters is a Gaussian with a width of mag and a peak at for the Coma distance (see, e.g., Miller & Lotz 2007; Lee & Jang 2016; Peng & Lim 2016). We cannot constrain the peak magnitude very well with our data, as the luminosity function does not show a clear turnover. Fitting a Gaussian with a prior , we find mag and mag.
We conclude that the properties of the compact objects in Dragonfly 44 and DFX1 are consistent with those expected from previously-studied globular cluster populations of other galaxies. To estimate the total number of clusters in each galaxy we use , where is the contamination-corrected number of compact objects with and . We find for Dragonfly 44 and for DFX1. The number for Dragonfly 44 is consistent with our previous measurement from ground-based imaging (; van Dokkum et al. 2016).
Finally, we note that the globular clusters are blue and that their colors are similar to that of the smooth light of the UDGs, as was previously found by Beasley & Trujillo (2016) for Dragonfly 17. Due to the limited depth of the data we can only measure reliable colors for the brightest clusters. For and we find .
4. Globular Clusters in Other Coma UDGs
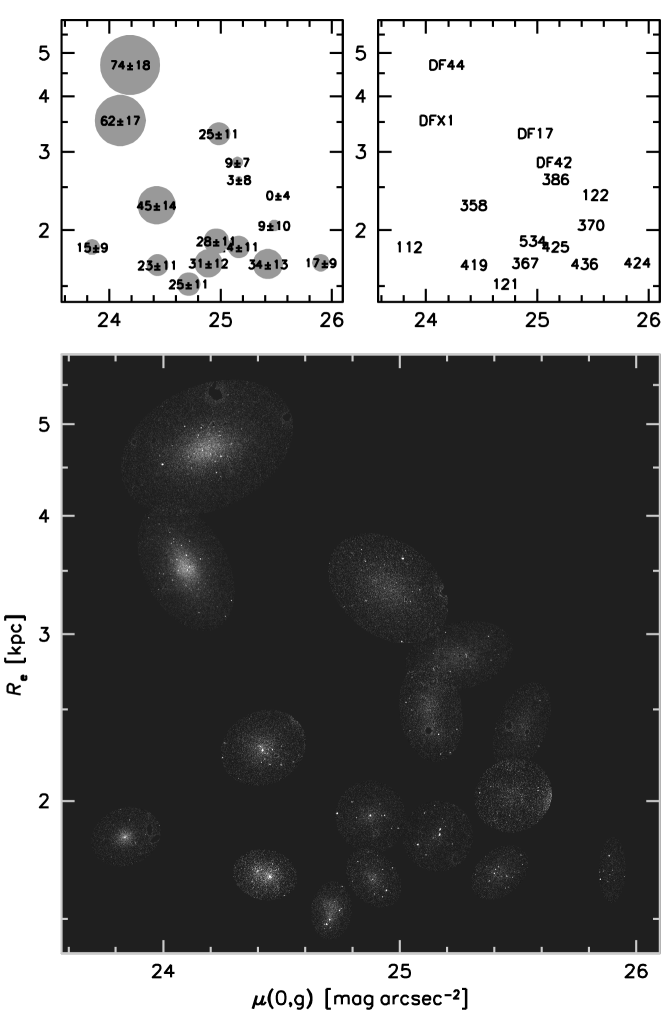
We obtained the ACS images of all 54 low surface brightness objects from the Yagi et al. (2016) catalog that fall in the Coma Cluster Treasury program area from MAST333https://archive.stsci.edu/prepds/coma/, and analyzed these galaxies in the same way as described above. Most of the CCTp data consist of a single orbit in and a single orbit in . We added the images to increase the S/N ratio, using . We use a zeropoint of 27.14, as for this value derived magnitudes are equivalent to for objects with the colors of UDGs and their globular clusters.
Structural parameters of the galaxies were determined using GALFIT, following the same masking procedures as described in § 3. Only 12 of the 54 objects have kpc and are classified as UDGs. The remaining galaxies are up to a factor of two smaller than this limit. After subtracting the best-fitting GALFIT models compact objects were identified, again using the same methodology and criteria as used for Dragonfly 44 and DFX1. The number of globular clusters was then determined by measuring the number of compact objects with in an elliptical aperture with radius and multiplying this by 4.
| Id | ||||||
|---|---|---|---|---|---|---|
| (kpc) | ||||||
| DF 17 | 3.3 | 25.0 | 0.61 | 0.71 | ||
| DF 42 | 2.8 | 25.2 | 0.64 | 0.61 | ||
| DF 44 | 4.7 | 24.2 | 0.94 | 0.68 | ||
| DF X1 | 3.5 | 24.1 | 0.90 | 0.62 | ||
| Y 112 | 1.8 | 23.8 | 1.43 | 0.81 | ||
| Y 121 | 1.5 | 24.7 | 0.60 | 0.69 | ||
| Y 122 | 2.4 | 25.5 | 0.64 | 0.54 | ||
| Y 358 | 2.3 | 24.4 | 0.99 | 0.83 | ||
| Y 367 | 1.7 | 24.9 | 0.84 | 0.73 | ||
| Y 370 | 2.1 | 25.5 | 0.78 | 0.92 | ||
| Y 386 | 2.6 | 25.2 | 0.53 | 0.63 | ||
| Y 419aaY 419 may be a superposition of two smaller galaxies. | 1.7 | 24.4 | 0.62 | 0.78 | ||
| Y 424bbY 424 is barely detected in the HST images. | : | 1.7: | 26.8: | 0.50: | 0.41: | |
| Y 425 | 1.8 | 25.2 | 1.33 | 0.99 | ||
| Y 436 | 1.7 | 25.4 | 0.58 | 0.69 | ||
| Y 534 | 1.9 | 25.0 | 1.03 | 0.96 |

The results are listed in Table 1 and summarized in Fig. 3. Dragonfly 44 and DFX1 have the most dramatic globular cluster populations of all HST-observed UDGs in Coma, but they are not the only ones with significant overdensities of point sources.444Interestingly some UDGs appear to be nucleated, as first reported by Koda et al. (2015). Here we do not attempt to distinguish between globular clusters and compact nuclei. We find that half of the 12 Yagi et al. (2016) UDGs have overdensities that are significant at the level. Among the Yagi et al. (2016) objects galaxy 358 has the largest number of globular clusters, with . We also include Dragonfly 42, observed in parallel with Dragonfly 44, and Dragonfly 17. The globular clusters in Dragonfly 17 were previously studied by Peng & Lim (2016) and Beasley et al. (2016). Our measurement is consistent with these studies ( versus ).
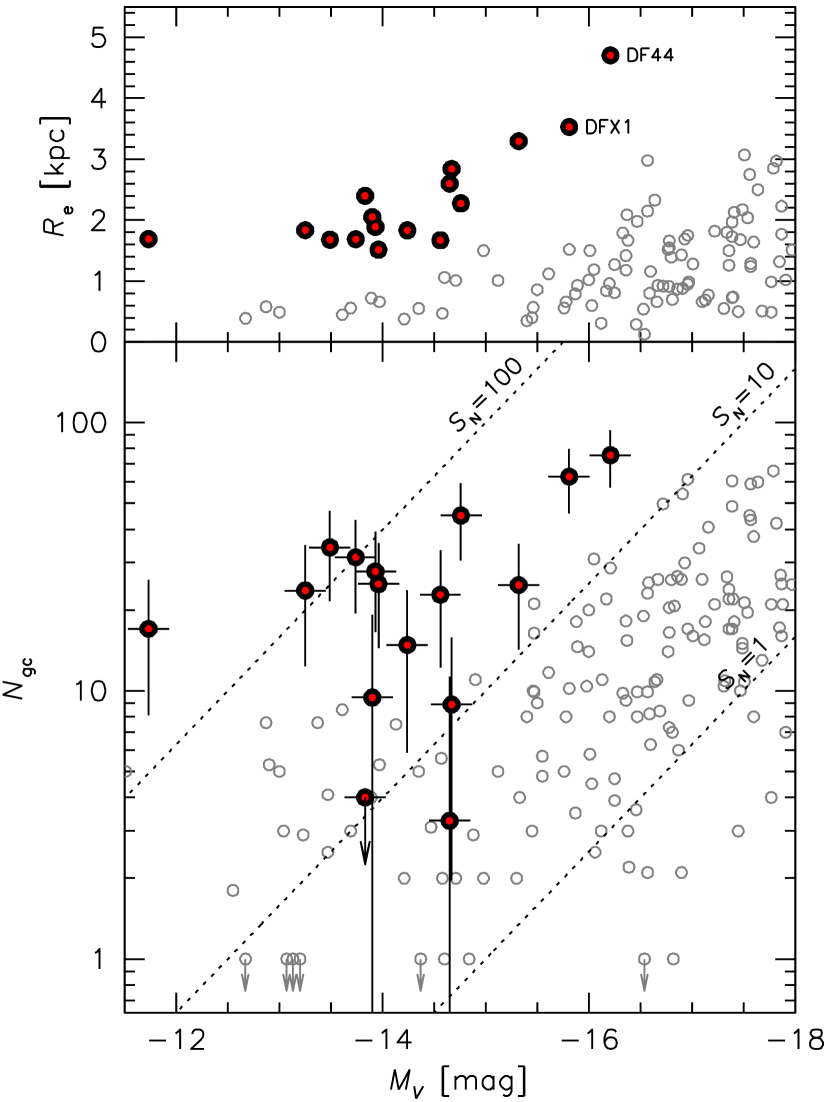
The globular counts in UDGs are compared to those in other galaxies in Fig. 4. Open symbols in this Figure are taken from the literature compilation of Harris et al. (2013).555In the luminosity regime of the UDGs the primary sources include Miller & Lotz (2007), Peng et al. (2008), and Georgiev et al. (2010). UDGs have more globular clusters than other galaxies of the same total luminosity. For this sample of 16 UDGs the median difference666It should be noted that the Harris et al. sample is heterogeneous, and possibly biased against galaxies with globular clusters. is a factor of . The specific frequency, defined as , is for UDGs.
5. Discussion
Using newly obtained HST images of the two UDGs in Coma with measured kinematics we find that they have remarkable globular cluster populations. No other known galaxies look like the objects in Fig. 1: very diffuse “blobs” as large as the Milky Way, sprinkled with many extremely compact sources. Dragonfly 44 and DFX1 are both large and relatively bright among UDGs. Although none of the smaller and fainter UDGs that were imaged serendipitously in the Coma Cluster Treasury program have quite as many globular clusters, several come close (see Fig. 4). Their median globular cluster specific frequency is actually higher than that of Dragonfly 44 and DFX1 ( versus ), because they are so faint.
Our results seem to be at odds with Amorisco et al. (2017), who report that UDGs in the Coma cluster do not have a statistically-significant excesss of compact objects compared to normal dwarf galaxies (see § 1). This tension may be partly due to the inclusion of galaxies with kpc in that study, and partly to differences in selection techniques: as an example, Amorisco et al. (2017) identify only a single compact object in galaxy 358 (N. Amorisco, private communication), whereas we find with and ( after correcting for contamination, and ).777Alerted to our apparently discrepant results, the authors of Amorisco et al. (2017) are revising aspects of their analysis and it is likely that the published version of their paper is in better agreement with our study than the submitted version (N. Amorisco, private communication).
The results presented here, and particularly Fig. 4, put to rest the suggestion that most cluster UDGs are directly related to smaller galaxies of the same total luminosity. Although some UDGs may be rapidly spinning low mass galaxies (Amorisco & Loeb 2016), and quite a few are probably tidally distorted objects on the verge of complete disruption (see Collins et al. 2013; Merritt et al. 2016), the majority appear to have a different origin.
Several studies have suggested that the number of globular clusters is more closely related to the dark matter halo mass of a galaxy than to its stellar content (Blakeslee et al. 1997; Forbes et al. 2016; Harris et al. 2017). Although we cannot test this directly for UDGs, as no halo masses out to large radius have yet been measured, we can determine whether UDGs fall on the same relation between and the dynamical mass within the effective radius as other galaxies. This relation is shown in the left panel of Fig. 5, with (Wolf et al. 2010). Solid symbols are the three UDGs with measured kinematics: Dragonfly 44, DFX1, and the Virgo galaxy VCC 1287 (Beasley et al. 2016). Open symbols are from Harris et al. (2013), after applying an offset of 0.3 dex to account for the contribution of baryons inside (Grillo 2010; Auger et al. 2010). 888This contribution is negligible for UDGs; see van Dokkum et al. (2016). The UDGs fall on the same relation as other galaxies.
Encouraged by this result, and following Peng & Lim (2016) and Beasley & Trujillo (2016), we converted to halo mass using (Harris et al. 2017). The median inferred halo mass is M⊙ for the sixteen galaxies; Dragonfly 44 and DFX1 have inferred M⊙. In the right panel of Fig. 5 we show the relation between stellar mass and halo mass. The stellar masses were determined from the total magnitudes using Bell & de Jong (2001), with the assumption that all UDGs have the same color as Dragonfly 44 and DFX1. Open symbols are derived from the Harris et al. (2013) sample of normal galaxies, using their colors to transform luminosity to mass. The UDGs fall below the canonical relations between stellar mass and halo mass, suggesting they are “failed” galaxies that quenched after forming their globular clusters but before forming a disk and bulge (see also Peng & Lim 2016; Beasley & Trujillo 2016; van Dokkum et al. 2016).
This study can be extended and improved in various ways. More dynamical measurements are needed to test whether the globular cluster counts are indeed directly related to the dark matter content, and to test whether there is a simple relation between the structure and kinematics of UDGs (Zaritsky 2017). The UDGs that overlap with the CCTp program are relatively small – none were in the original Dragonfly sample – and HST imaging of more UDGs with kpc may turn up even more spectacular objects than Dragonfly 44 and DFX1. The best way to measure total masses is probably through weak lensing. A recent ground-based study has provided the first upper limits (Sifón et al. 2017, see Fig. 5), and future HST studies of large samples could probe deeper into the relevant halo mass range of M⊙ – M⊙.
References
- (1)
- (2) Abraham, R. G. & van Dokkum, P. G. 2014, PASP, 126, 55
- (3)
- (4) Agertz, O. & Kravtsov, A. V. 2015, arXiv:1509.00853
- (5)
- (6) Amorisco, N. C. & Loeb, A. 2016, MNRAS, 459, L51
- (7)
- (8) Amorisco, N. C., Monachesi, A., & White, S. D. M. 2017, ArXiv e-prints
- (9)
- (10) Auger, M. W., Treu, T., Gavazzi, R., Bolton, A. S., Koopmans, L. V. E., & Marshall, P. J. 2010, ApJ, 721, L163
- (11)
- (12) Beasley, M. A., Romanowsky, A. J., Pota, V., Navarro, I. M., Martinez Delgado, D., Neyer, F., & Deich, A. L. 2016, ApJ, 819, L20
- (13)
- (14) Beasley, M. A. & Trujillo, I. 2016, ApJ, 830, 23
- (15)
- (16) Behroozi, P. S., Marchesini, D., Wechsler, R. H., Muzzin, A., Papovich, C., & Stefanon, M. 2013, ApJ, 777, L10
- (17)
- (18) Bell, E. F. & de Jong, R. S. 2001, ApJ, 550, 212
- (19)
- (20) Bertin, E. & Arnouts, S. 1996, A&AS, 117, 393
- (21)
- (22) Blakeslee, J. P., Tonry, J. L., & Metzger, M. R. 1997, AJ, 114, 482
- (23)
- (24) Carter, D., Goudfrooij, P., Mobasher, B., et al. 2008, ApJS, 176, 424
- (25)
- (26) Collins, M. L. M., Chapman, S. C., Rich, R. M., Ibata, R. A., Martin, N. F., Irwin, M. J., Bate, N. F., Lewis, G. F., et al. 2013, ApJ, 768, 172
- (27)
- (28) Dalcanton, J. J., Spergel, D. N., Gunn, J. E., Schmidt, M., & Schneider, D. P. 1997, AJ, 114, 635
- (29)
- (30) Di Cintio, A., Brook, C. B., Dutton, A. A., Macciò, A. V., Obreja, A., & Dekel, A. 2017, MNRAS, 466, L1
- (31)
- (32) Forbes, D. A., Alabi, A., Romanowsky, A. J., Brodie, J. P., Strader, J., Usher, C., & Pota, V. 2016, MNRAS, 458, L44
- (33)
- (34) Foreman-Mackey, D., Hogg, D. W., Lang, D., & Goodman, J. 2013, PASP, 125, 306
- (35)
- (36) Georgiev, I. Y., Puzia, T. H., Goudfrooij, P., & Hilker, M. 2010, MNRAS, 406, 1967
- (37)
- (38) Godwin, J. G., Metcalfe, N., & Peach, J. V. 1983, MNRAS, 202, 113
- (39)
- (40) Grillo, C. 2010, ApJ, 722, 779
- (41)
- (42) Hammer, D., Verdoes Kleijn, G., Hoyos, C., den Brok, M., Balcells, M., Ferguson, H. C., Goudfrooij, P., Carter, D., et al. 2010, ApJS, 191, 143
- (43)
- (44) Hargis, J. R. & Rhode, K. L. 2014, ApJ, 796, 62
- (45)
- (46) Harris, W. E., Blakeslee, J. P., & Harris, G. L. H. 2017, ApJ, 836, 67
- (47)
- (48) Harris, W. E., Harris, G. L. H., & Alessi, M. 2013, ApJ, 772, 82
- (49)
- (50) Impey, C., Bothun, G., & Malin, D. 1988, ApJ, 330, 634
- (51)
- (52) Kadowaki, J., Zaritsky, D., & Donnerstein, R. L. 2017, ApJ, 838, L21
- (53)
- (54) Kartha, S. S., Forbes, D. A., Spitler, L. R., Romanowsky, A. J., Arnold, J. A., & Brodie, J. P. 2014, MNRAS, 437, 273
- (55)
- (56) Koda, J., Yagi, M., Yamanoi, H., & Komiyama, Y. 2015, ApJ, 807, L2
- (57)
- (58) Labbé, I., Franx, M., Rudnick, G., Schreiber, N. M. F., Rix, H., Moorwood, A., van Dokkum, P. G., van der Werf, P., et al. 2003, AJ, 125, 1107
- (59)
- (60) Lee, M. G. & Jang, I. S. 2016, ApJ, 819, 77
- (61)
- (62) Martínez-Delgado, D., Läsker, R., Sharina, M., Toloba, E., Fliri, J., Beaton, R., Valls-Gabaud, D., Karachentsev, I. D., et al. 2016, AJ, 151, 96
- (63)
- (64) Merritt, A., van Dokkum, P., Danieli, S., Abraham, R., Zhang, J., Karachentsev, I. D., & Makarova, L. N. 2016, ApJ, 833, 168
- (65)
- (66) Mihos, J. C., Durrell, P. R., Ferrarese, L., Feldmeier, J. J., Côté, P., Peng, E. W., Harding, P., Liu, C., et al. 2015, ApJ, 809, L21
- (67)
- (68) Miller, B. W. & Lotz, J. M. 2007, ApJ, 670, 1074
- (69)
- (70) Moster, B. P., Somerville, R. S., Maulbetsch, C., van den Bosch, F. C., Macciò, A. V., Naab, T., & Oser, L. 2010, ApJ, 710, 903
- (71)
- (72) Papastergis, E., Adams, E. A. K., & Romanowsky, A. J. 2017, ArXiv e-prints
- (73)
- (74) Peng, C. Y., Ho, L. C., Impey, C. D., & Rix, H.-W. 2002, AJ, 124, 266
- (75)
- (76) Peng, E. W., Jordán, A., Côté, P., et al. 2008, ApJ, 681, 197
- (77)
- (78) Peng, E. W. & Lim, S. 2016, ApJ, 822, L31
- (79)
- (80) Román, J. & Trujillo, I. 2017, MNRAS, 468, 703
- (81)
- (82) Sersic, J. L. 1968, Atlas de galaxias australes (Cordoba, Argentina: Observatorio Astronomico, 1968)
- (83)
- (84) Sifón, C., van der Burg, R. F. J., Hoekstra, H., Muzzin, A., & Herbonnet, R. 2017, ArXiv e-prints
- (85)
- (86) van der Burg, R. F. J., Muzzin, A., & Hoekstra, H. 2016, A&A, 590, A20
- (87)
- (88) van Dokkum, P., Abraham, R., Brodie, J., Conroy, C., Danieli, S., Merritt, A., Mowla, L., Romanowsky, A., et al. 2016, ApJ, 828, L6
- (89)
- (90) van Dokkum, P. G., Abraham, R., Merritt, A., Zhang, J., Geha, M., & Conroy, C. 2015a, ApJ, 798, L45
- (91)
- (92) van Dokkum, P. G., Romanowsky, A. J., Abraham, R., Brodie, J. P., Conroy, C., Geha, M., Merritt, A., Villaume, A., et al. 2015b, ApJ, 804, L26
- (93)
- (94) Wolf, J., Martinez, G. D., Bullock, J. S., Kaplinghat, M., Geha, M., Muñoz, R. R., Simon, J. D., & Avedo, F. F. 2010, MNRAS, 406, 1220
- (95)
- (96) Yagi, M., Koda, J., Komiyama, Y., & Yamanoi, H. 2016, ApJS, 225, 11
- (97)
- (98) Yozin, C. & Bekki, K. 2015, MNRAS, 452, 937
- (99)
- (100) Zaritsky, D. 2017, MNRAS, 464, L110
- (101)