Discovery of three strongly lensed quasars in the Sloan Digital Sky Survey
Abstract
We present the discovery of 3 quasar lenses in the Sloan Digital Sky Survey (SDSS), selected using two novel photometry-based selection techniques. The J0941+0518 system, with two point sources separated by 5.46′′ on either side of a galaxy, has source and lens redshifts and . The AO-assisted images of J2211+1929 show two point sources separated by 1.04 corresponding to the same quasar at besides the lens galaxy and Einstein ring. Images of J2257+2349 show two point sources separated by 1.67′′ on either side of an E/S0 galaxy. The extracted spectra show two images of the same quasar at redshift . In total, the two selection techniques identified 309 lens candidates, including 47 known lenses, and 6 previously ruled out candidates. 55 of the remaining candidates were observed using NIRC2 and ESI at Keck Observatory, EFOSC2 at the ESO-NTT (La Silla), and SAM and the Goodman spectrograph at SOAR. Of the candidates observed, 3 were confirmed as lenses, 36 were ruled out, and 16 remain inconclusive. Taking into account that we recovered known lenses, this gives us a success rate of at least 50/309 (16%). This initial campaign demonstrates the power of purely photometric selection techniques in finding lensed quasars. Developing and refining these techniques is essential for efficient identification of these rare lenses in ongoing and future photometric surveys.
keywords:
gravitational lensing: strong – methods: statistical – methods: observational1 Introduction
Strong gravitational lensing serves as a unique probe into the distant universe (e.g. Treu & Ellis, 2015, and references therein). With their highly magnified images, one can use lenses as cosmic telescopes to study, e.g., the properties of quasar host galaxies at high redshifts (Peng et al., 2006; Ding et al., 2017). Anomalies in the positions and fluxes of the images can be used to probe dark matter substructure in the lensing object (Mao & Schneider, 1998; Dalal & Kochanek, 2002; Vegetti et al., 2012; Nierenberg et al., 2014). Microlensing due to compact objects in the lens galaxy (see Wambsganss, 2006) can be used to study the inner structure of lensed AGN, enabling measurements of the accretion disk size (Kochanek, 2004; Motta et al., 2017) and thermal slopes (Anguita et al., 2008; Eigenbrod et al., 2008) and the geometry of the broad line region (Braibant et al., 2014, 2016). With additional monitoring, one can measure the time delay between arrival of the different images and use this as a cosmological distance indicator (e.g. Refsdal, 1964; Schechter et al., 1997; Suyu et al., 2014; Tewes et al., 2013; Treu & Marshall, 2016; Bonvin et al., 2016).
Unfortunately, the field is currently limited by the small number of known lenses. Since strong gravitational lensing requires such a close alignment of a distant source with a foreground lensing object, lensed quasars are very rare objects. Oguri & Marshall (2010) estimate that, given an -band limiting magnitude of 21, there are only 0.2 lenses per square degree, of which 20% are information-rich quads. Thus, the large footprints of wide-field surveys such as the Sloan Digital Sky Survey (SDSS, York et al., 2000) and the Dark Energy Survey (DES, Diehl et al., 2014) are essential for successful searches.
| Telescope | Instrument | Type | filter/wavelength coverage | pixel scale/dispersion | slit size (′′) |
|---|---|---|---|---|---|
| Keck 1 | OSIRIS | Imaging | Kbb | 0.02 arcsec/pixel | – |
| Keck 2 | NIRC2 narrow | Imaging | K′ | 0.01 arcsec/pixel | – |
| Keck 2 | ESI | Spectroscopy | 3900 Å to 10900 Å | 0.16 to 0.30 Å/pixel | 0.75 |
| NTT | EFOSC2 | Spectroscopy | 3685 Å to 9315 Å | 5.54 Å/pixel | 1.2 |
| SOAR | SAM | Imaging | SAMI-z | 0.045 arcsec/pixel | – |
| SOAR | Goodman | Spectroscopy | 4912 Å to 9020 Å | 1.00 Å/pixel | 1.0 |
Previous systematic searches for strongly lensed quasars have predominantly explored samples of objects that have spectroscopic data. In the radio, the Cosmic Lens All Sky Survey (CLASS, Myers et al., 2003; Browne et al., 2003) in combination with the Jodrell-Bank VLA Astrometric Survey (JVAS, King et al., 1999) explored flat-spectrum radio sources, resulting in the discovery of 22 lenses. In the optical, Pindor et al. (2003) compared fits of single- and double-component point-spread functionss (PSFs) to spectroscopically confirmed quasars in SDSS to identify closely separated pairs of quasars as lens candidates. The SDSS Quasar Lens Search (SQLS, Oguri et al., 2006; Inada et al., 2012) explored the sample of low-redshift () spectroscopically confirmed quasars and used a combination of a morphological selection aimed at finding small-separation candidates and a colour-based selection to find lenses that are deblended in SDSS imaging. More recently, More et al. (2016) applied a similar method to the Baryon Oscillation Spectroscopic Survey (BOSS, Dawson et al., 2013), expanding the SDSS spectroscopic searches out to higher redshifts.
With the aim of expanding searches to include the footprints of new and upcoming wide-field surveys, many photometry-based techniques have recently been developed. Ostrovski et al. (2016) use Gaussian Mixture Models to search for lenses in the DES Y1A1 (Diehl et al., 2014) footprint using DES photometry combined with the Wide-field Infrared Survey Explorer (WISE, Wright et al., 2010) and VISTA Hemisphere Survey (VHS, McMahon et al., 2013) infrared bands. Agnello et al. (2015) used an artificial neural network classifier applied to blue, extended objects, and Lin et al. (2017) search for red galaxies with multiple blue neighbours in DES.
In this paper, we present the discovery of three new gravitationally lensed quasars selected by two independent photometry-based selection techniques applied to the SDSS DR12 footprint: J0941+0518 at (ra, dec) = (09:41:22.5, +05:18:23.9), J2211+1929 at (22:11:30.3, +19:29:13.2), and J2257+2349 at (22:57:25.4, +23:49:30.4). The quasar images are separated by 5.46′′, 1.04′′, and 1.67′′, and correspond to sources at , , respectively. In Section 2, we describe the two selection techniques, introduced by Williams et al. (2017) and Agnello et al. (2017), and their application to SDSS data. In Section 3, we present the follow-up imaging and spectroscopy observations of the candidates and provide simple model fits to the three lenses. Finally, we conclude in Section 4.
2 Candidate selection methods
The colours of lensed quasars are a combination of the colours of quasars and those of the lensing galaxy. This places them in a particular location in colour-magnitude space that is separate from the locations of more common contaminant classes of objects such as individual quasars or individual galaxies. We use two independent selection techniques that take advantage of this fact: one which describes the distribution of all classes of objects individually, and another which uses pseudo-distance measures in colour-magnitude space to identify objects that lie ‘far’ away from more common classes/clusters.
2.1 Population Mixture Models
The population mixture model approach attempts to describe the populations of lensed quasars and various contaminant classes as a superposition of probability density functions (PDFs) in colour-magnitude space. We use Gaussian PDFs and the Expectation Maximization algorithm to fit the Gaussians to the data, where each Gaussian is associated with a different class of objects. This then allows us to compute the probability that a particular object belongs to each of the classes.
The objects in this paper were selected using the results of three different models utilizing SDSS and WISE photometry: a 6 feature model including , , , , , and ; a 7 feature model adding ; and a 9 feature model adding , , and as a measure of extendedness. Objects were first selected from the SDSS DR12 data set according to the cuts in (Williams et al., 2017) and were then run through each of the 6, 7, and 9 feature models, generating three membership probability vectors for each object. We retained only those objects where the average ‘lens’ probability across the three models is greater than 0.8. Each of these was visually inspected by two investigators (among PW, AA, TT) using the SDSS DR12 Image List Tool and assigned a score of 0-3 with the following grading scheme: 0 - not a lens, 1 - probably not a lens, 2 - possibly a lens, 3 - probably a lens. Those receiving an average visual inspection score greater than 2 were then selected for follow-up based on observability.
2.2 Outlier selection
In the outlier selection technique, Gaussians are used to characterize four classes, or clusters, of ‘common’ objects: nearby quasars (), isolated quasars at higher redshift, blue-cloud galaxies, and faint objects. Each Gaussian is characterized by a mean and a covariance in the seven-dimensional space of , , , , , , and . The six- and nine-dimensional spaces of the population mixture model approach are not used. For a given object, a set of four pseudo-distances can be calculated, describing how close the object colours are to those of the main clusters of objects. By excluding those with distances less than a certain threshold, one retains mainly peculiar objects, including lensed quasars.


Objects were pre-selected to have extended morphology based on the and psf-model magnitudes in the SDSS. Additional cuts in WISE magnitudes were used to exclude most quasars and narrow-line galaxies (see Agnello et al., 2017, for details). For the remaining objects, the distances were calculated and only those with large enough distances were retained.
2.3 Performance of the two methods
The population mixture model yielded 59 candidates with a score of greater than 2, including 7 already known lenses and 6 objects that had already been identified, observed, and rejected. Of the remaining 46 candidates, 21 were observed, resulting in 2 confirmed lenses, 15 rejects, and 4 inconclusive. This gives a success rate between 9/59 and 38/59, ie. at least 15%. The two main sources of contamination were close QSO + star alignments and single point sources, accounting for 9 of the 15 observed rejects and 1 of the 6 previously rejected candidates.
The outlier selection technique yielded 250 candidates with , including 40 known lenses111The exact number depends on the colour-preselection cuts and pseudo-distance cuts used. The combination used for this search retained 37 previously known lenses.. 36 of the candidates were observed, yielding 2 confirmed lenses, 22 rejects, and 12 inconclusive. This would correspond to success rate.
3 Follow-up of candidates
Candidates were observed using the Near-Infrared Camera 2 (NIRC2), the Echelette Spectrograph and Imager (ESI, Sheinis et al., 2002), and the Optical, Spectrographic, and Infrared Remote Imaging System (OSIRIS Larkin et al., 2006) at Keck Observatory; the ESO Faint Object Spectrograph and Camera (EFOSC2 Buzzoni et al., 1984) at the New Technology Telescope (NTT); and the Adaptive Optics Module (SAM) and Goodman Spectrograph at the Southern Astrophysical Research Telescope (SOAR). The instrument setups and observing conditions are summarized in Table 1. In total, we observed 55 candidates (results summarized in the Appendix), of which 3 were confirmed to be lenses.
| name | Image separation (′′) | Image | Flux (arbitrary) | (dec.) (′′) | dec. (′′) |
|---|---|---|---|---|---|
| J0941+0518 | A | ||||
| B | |||||
| J2211+1929 | A | ||||
| B | |||||
| J2257+2349 | A | ||||
| B |
| name | Lens model | (′′) | (deg) | ||
|---|---|---|---|---|---|
| J0941+0518 | SIE | ||||
| SIE + fluxes | |||||
| J2211+1929 | SIE | ||||
| SIE + fluxes | |||||
| J2257+2349 | SIE | ||||
| SIE + fluxes |
We used the lensmodel package (Keeton, 2011) to fit simple lens models to each confirmed lens. We adopted a singular isothermal ellipsoid (SIE) model, which has a surface density given by
| (1) |
where is the lens strength, and the axis ratio is related to by . We use the lensmodel routine optimize which minimizes by varying the source and galaxy positions, the source flux, the lens strength , the ellipticity , and the ellipticity position angle . Our observational constraints are the image and galaxy positions found using a centroid algorithm and fluxes found using aperture photometry with the high resolution AO images. Since flux ratios can be affected by microlensing and differential extinction (e.g., Mao & Schneider, 1998; Falco et al., 1999) as well as the combined effects of quasar variability and time delays, the flux measurements introduce additional uncertainties greater than those measured. For this reason, we fit a model without using image fluxes and one using the fluxes with 20% uncertainties. The relative positions and fluxes of the images are given in Table 2. With the fluxes omitted, we have 4 constraints from the image positions relative to the galaxy and are fitting for , , , and source position. This means we have more free parameters than constraints and should expect a . In this case, the fitted parameters give an idea of the correct values for the SIE model, but the errors do not hold as much meaning as those for the fits including the flux ratios. The best-fit parameters for all models are given in Table 3.
3.1 SDSS J0941+0518
Images of SDSS J0941+0518 were obtained with the OSIRIS Imager at Keck Observatory on 9 November 2016. The Kbb filter was used, centered at 2172 nm and with bandwith 415 nm, with a scale of 0.02 arcsec/pixel. 27 exposures of 30 seconds each were obtained with 3′′ dithers in each direction. Spectra were obtained with ESI at Keck Observatory on 19 November 2016, in echelette mode with a wavelength coverage from 3900 Å to 10900 Å and dispersion ranging from 0.16 Å/pixel to 0.30 Å/pixel, giving a constant dispersion of 11.5 km/sec/pixel. The 0.75 arcsec slit was used, which projects to 4.9 pixels. Three 600s exposures were taken, dithering along the slit between exposures.
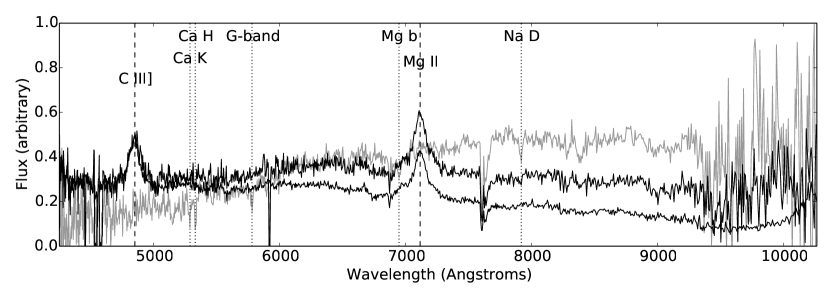
Images show two point sources separated by 5.46′′ on either side of the lens galaxy. The spectra (Figure 3, top panel) are consistent with coming from the same object at redshift , as identified by the C III] and Mg II emission lines. The extracted galaxy spectrum with the Ca H and K, G-band, Mg b, and Na D lines give . These values agree with the SDSS fiber spectra which give and .
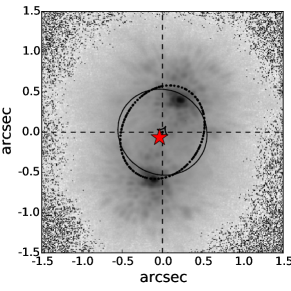
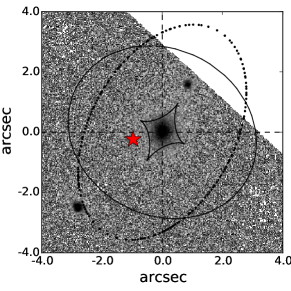
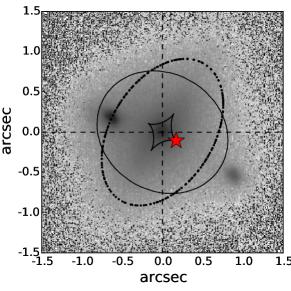
The SIE model fit infers an elliptical lensing object with ellipticity and position angle degrees, measured East of North. The inferred mass centroid from the model agrees with the light centroid from the images. The resulting critical lines and caustics are plotted on the images in Figure 1 along with the inferred source position. The value for the model without flux constraints was , but the ellipticity and position angle were poorly constrained. Including the fluxes increased to 30.3, but the parameter constraints improved drastically.
The lens galaxy is in close proximity () to eight other sources in SDSS imaging. McConnachie et al. (2009) identify 6 of these objects, including the lens, as belonging to a compact group of galaxies. This could explain the large image separation and indicates the need for a more complex lens model.
3.2 SDSS J2211+1929
Images of SDSS J2211+1929 were obtained using NIRC2 with adaptive optics at Keck Observatory on 21 September 2016. The narrow camera was used with the Kp filter, centered at 2124 nm and with bandpass 351 nm. The pixel scale is 0.01 arcsec/pixel. Three sets of three 120s exposures were taken using a three point dither pattern in addition to two 60s acquisition exposures. Spectra were first obtained with ESI at Keck Observatory on 19 November 2016. The same setup was used as for SDSS J0941+0518, but with two 900s exposures. A second set of spectra were obtained with EFOSC2 at NTT on 27 September 2016. The Gr#13 grism was used with a slit, which covers 3685 Å to 9315 Å with dispersion 5.54 Å/pixel.
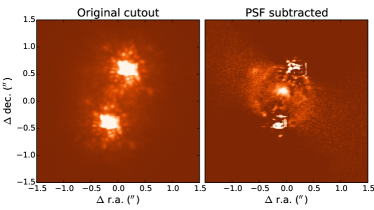
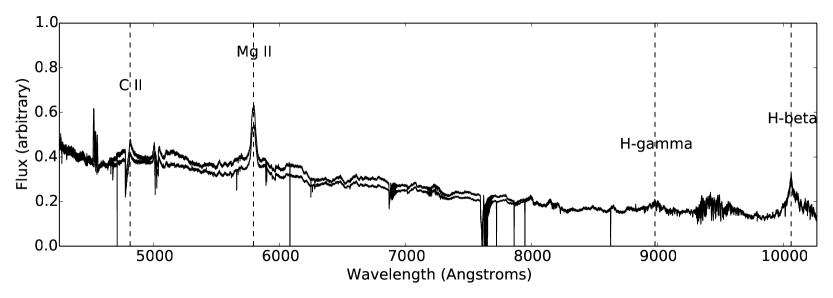
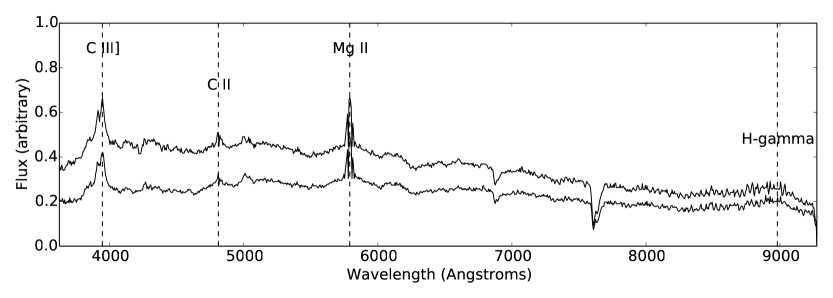
The images show two bright point sources separated by 1.04′′. Despite the complex structure in the PSF, a slight excess can be seen which we associate with the lens galaxy (Figure 2, left). A simple pairwise PSF subtraction, in which Image A is subtracted from Image B and vice versa, reveals the lens galaxy as well as an Einstein ring (Figure 2, right). The extracted 1D spectra are consistent with coming from the same object with emission lines C III], C II, Mg II, H-gamma, and H-beta at redshift .
The SIE fit with fluxes infers an ellipticity and position angle . As with J0941+0518, the fit without flux observations does not reliably constrain the ellipticity position angle, but including fluxes with uncertainties significantly improves the constraints. The inferred mass centroid from the SIE fit again agrees with the light centroid from the psf-subtracted images.
3.3 SDSS J2257+2349
Images of SDSS J2257+2349 were obtained with NIRC2 with adaptive optics at Keck Observatory on 21 September 2016. The same setup was used as for SDSS J2211+1929, but with two sets of three 120s exposures and the two additional 60s acquisition exposures. Spectra were obtained with EFOSC2 at NTT on 27 September 2016 with the same setup as for SDSS J2211+1929.
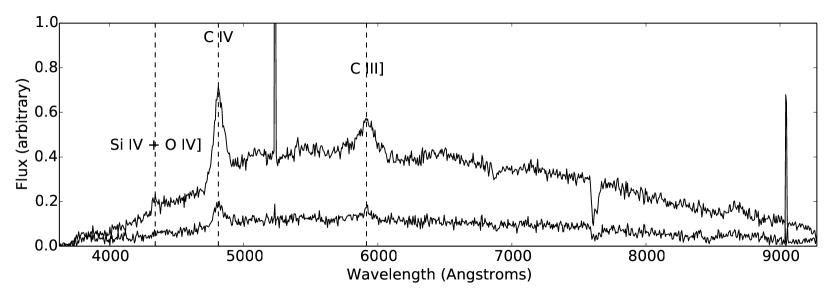
The images show two point sources separated by 1.67′′ on either side of an E/S0 galaxy. Spectra show that both point sources correspond to the same quasar at redshift , as indicated by the Si IV + O IV], C IV, and C III] emission lines.
The SIE fit with fluxes infers an ellipticity and ellipticity position angle degrees. These values agree with the orientation of the lens galaxy as seen in the right panels of Figure 1 and the mass centroid from the fit matches the light centroid from the images. When fluxes are not included as constraints, the position angle is only constrained with an upper bound, but when the fluxes are used, all parameters are well constrained. This again illustrates the necessity of deeper data in order to constrain the deflector shape and explore more complex lens models.
4 Discussion and Conclusions
We have followed-up 55 lensed quasar candidates selected by two photometry-based selection techniques, independently applied to the SDSS-DR12 data set, confirming three new lenses: J0941+0518, J2211+1929, and J2257+2349. Of these, J0941 was selected by both methods, J2211 was found only by the population mixture search, and J2257 only by the outlier selection. This reflect a general behaviour on the larger sample of selected candidates, where the two searches complement one another and have some degree of overlap.
Adaptive-Optics assisted images of the three lenses, taken with OSIRIS and NIRC2, reveal two quasar images on either side of a lensing source, separated by , , and , respectively. Spectra taken with ESI and EFOSC2 confirm that each system is a lens with quasar redshifts , , and , respectively, and give a lens redshift for J0941+0518. Fits to simple SIE models with and without the use of fluxes as a constraint give the lens parameters summarized in Table 3. With deeper data, one could apply more complex models, e.g. including external shear terms or deviations from the SIE density law, in order to better constrain the shape of the lens.
Most of the ‘inconclusive’ objects appear as two point sources in images, but do not show any sign of a lens galaxy. These objects will require spectra to confirm if they are images of the same quasar, or, similar to the case of J2211+1929, deeper imaging with careful PSF subtraction. In future follow-up campaigns, a quick PSF subtraction such as the one done with J2211+1929 can be used as a tool for quickly examining targets while at the telescope.
A non-negligible subset of candidates were revealed as bright and single point-sources in follow-up imaging. Their uncertain SDSS morphology was given by CCD ‘blooming’, which is common for bright sources and in fact can be seen also on some known quasar lenses. Subsequent Pan-STARRS images222http://ps1images.stsci.edu/cgi-bin/ps1cutouts, not available at the time of this campaign, were much clearer at distinguishing between spurious candidates (due to blooming) and systems with truly multiple images.
The discovery of these three lenses in the SDSS demonstrates the importance of photometry-based selection techniques to complement previous searches for lensed quasars. Neither J2211+1929 nor J2257+2349 have spectra in the SDSS and thus were not explored by previous searches like the SQLS. The case of J0941+0518 is more surprising: despite having, coincidentally, a fibre spectrum of the bright quasar image and one of the lens galaxy and counter-image, it was missed by previous spectroscopic searches. With new and upcoming surveys that do not have readily available spectroscopic data, both types of searches will be important in order to generate a more complete sample of lenses.
Acknowledgments
TT acknowledges support by the Packard Foundation through a Packard Research Fellowship and by the National Science Foundation through grant AST-1450141. T. A. and Y.A. acknowledge support by proyecto FONDECYT 11130630 and by the Ministry for the Economy, Development, and Tourism’s Programa Inicativa Científica Milenio through grant IC 12009, awarded to The Millennium Institute of Astrophysics (MAS). CDF acknowledges support from the NSF via AST-1312329. VM acknowledges support from Centro de Astrofísica de Valparaíso. K.R. is supported by PhD fellowship FIB-UV 2015/2016 and Becas de Doctorado Nacional CONICYT 2017.
Based on observations obtained at the Southern Astrophysical Research (SOAR) telescope, which is a joint project of the Ministério da Ciência, Tecnologia, e Inovação (MCTI) da República Federativa do Brasil, the U.S. National Optical Astronomy Observatory (NOAO), the University of North Carolina at Chapel Hill (UNC), and Michigan State University (MSU).
Funding for SDSS-III has been provided by the Alfred P. Sloan Foundation, the Participating Institutions, the National Science Foundation, and the U.S. Department of Energy Office of Science. The SDSS-III web site is http://www.sdss3.org/.
SDSS-III is managed by the Astrophysical Research Consortium for the Participating Institutions of the SDSS-III Collaboration including the University of Arizona, the Brazilian Participation Group, Brookhaven National Laboratory, Carnegie Mellon University, University of Florida, the French Participation Group, the German Participation Group, Harvard University, the Instituto de Astrofisica de Canarias, the Michigan State/Notre Dame/JINA Participation Group, Johns Hopkins University, Lawrence Berkeley National Laboratory, Max Planck Institute for Astrophysics, Max Planck Institute for Extraterrestrial Physics, New Mexico State University, New York University, Ohio State University, Pennsylvania State University, University of Portsmouth, Princeton University, the Spanish Participation Group, University of Tokyo, University of Utah, Vanderbilt University, University of Virginia, University of Washington, and Yale University.
Some of the data presented herein were obtained at the W.M. Keck Observatory, which is operated as a scientific partnership among the California Institute of Technology, the University of California and the National Aeronautics and Space Administration. The Observatory was made possible by the generous financial support of the W.M. Keck Foundation. The authors wish to recognize and acknowledge the very significant cultural role and reverence that the summit of Mauna Kea has always had within the indigenous Hawaiian community. We are most fortunate to have the opportunity to conduct observations from this mountain, and we respectfully say mahalo.
References
- Agnello et al. (2015) Agnello A., et al., 2015, MNRAS, 454, 1260
- Agnello et al. (2017) Agnello A., Grillo C., Jones T., Treu T., Bonamigo M., Suyu S. H., 2017, preprint, (arXiv:1702.03942)
- Anguita et al. (2008) Anguita T., Schmidt R. W., Turner E. L., Wambsganss J., Webster R. L., Loomis K. A., Long D., McMillan R., 2008, AA, 480, 327
- Astropy Collaboration et al. (2013) Astropy Collaboration et al., 2013, AA, 558, A33
- Bonvin et al. (2016) Bonvin V., Tewes M., Courbin F., Kuntzer T., Sluse D., Meylan G., 2016, AA, 585, A88
- Braibant et al. (2014) Braibant L., Hutsemékers D., Sluse D., Anguita T., García-Vergara C. J., 2014, AA, 565, L11
- Braibant et al. (2016) Braibant L., Hutsemékers D., Sluse D., Anguita T., 2016, AA, 592, A23
- Browne et al. (2003) Browne I. W. A., et al., 2003, MNRAS, 341, 13
- Buzzoni et al. (1984) Buzzoni B., et al., 1984, The Messenger, 38, 9
- Dalal & Kochanek (2002) Dalal N., Kochanek C. S., 2002, ApJ, 572, 25
- Dawson et al. (2013) Dawson K. S., et al., 2013, AJ, 145, 10
- Diehl et al. (2014) Diehl H. T., et al., 2014, in Observatory Operations: Strategies, Processes, and Systems V. p. 91490V, doi:10.1117/12.2056982
- Ding et al. (2017) Ding X., et al., 2017, MNRAS, 465, 4634
- Eigenbrod et al. (2008) Eigenbrod A., Courbin F., Meylan G., Agol E., Anguita T., Schmidt R. W., Wambsganss J., 2008, AA, 490, 933
- Falco et al. (1999) Falco E. E., et al., 1999, ApJ, 523, 617
- Inada et al. (2012) Inada N., et al., 2012, AJ, 143, 119
- Keeton (2011) Keeton C. R., 2011, GRAVLENS: Computational Methods for Gravitational Lensing, Astrophysics Source Code Library (ascl:1102.003)
- King et al. (1999) King L. J., Browne I. W. A., Marlow D. R., Patnaik A. R., Wilkinson P. N., 1999, MNRAS, 307, 225
- Kochanek (2004) Kochanek C. S., 2004, ApJ, 605, 58
- Larkin et al. (2006) Larkin J., et al., 2006, in Society of Photo-Optical Instrumentation Engineers (SPIE) Conference Series. p. 62691A, doi:10.1117/12.672061
- Lin et al. (2017) Lin H., et al., 2017, ApJL, 838, L15
- Mao & Schneider (1998) Mao S., Schneider P., 1998, MNRAS, 295, 587
- McConnachie et al. (2009) McConnachie A. W., Patton D. R., Ellison S. L., Simard L., 2009, MNRAS, 395, 255
- McMahon et al. (2013) McMahon R. G., Banerji M., Gonzalez E., Koposov S. E., Bejar V. J., Lodieu N., Rebolo R., VHS Collaboration 2013, The Messenger, 154, 35
- More et al. (2016) More A., et al., 2016, MNRAS, 456, 1595
- Motta et al. (2017) Motta V., Mediavilla E., Rojas K., Falco E. E., Jiménez-Vicente J., Muñoz J. A., 2017, ApJ, 835, 132
- Myers et al. (2003) Myers S. T., et al., 2003, MNRAS, 341, 1
- Nierenberg et al. (2014) Nierenberg A. M., Treu T., Wright S. A., Fassnacht C. D., Auger M. W., 2014, MNRAS, 442, 2434
- Oguri & Marshall (2010) Oguri M., Marshall P. J., 2010, MNRAS, 405, 2579
- Oguri et al. (2006) Oguri M., et al., 2006, AJ, 132, 999
- Ostrovski et al. (2016) Ostrovski F., et al., 2016, preprint, (arXiv:1607.01391)
- Peng et al. (2006) Peng C. Y., Impey C. D., Rix H.-W., Kochanek C. S., Keeton C. R., Falco E. E., Lehár J., McLeod B. A., 2006, ApJ, 649, 616
- Pindor et al. (2003) Pindor B., Turner E. L., Lupton R. H., Brinkmann J., 2003, The Astronomical Journal, 125, 2325
- Refsdal (1964) Refsdal S., 1964, MNRAS, 128, 307
- Schechter et al. (1997) Schechter P. L., et al., 1997, ApJL, 475, L85
- Sheinis et al. (2002) Sheinis A. I., Bolte M., Epps H. W., Kibrick R. I., Miller J. S., Radovan M. V., Bigelow B. C., Sutin B. M., 2002, PASP, 114, 851
- Suyu et al. (2014) Suyu S. H., et al., 2014, ApJL, 788, L35
- Tewes et al. (2013) Tewes M., Courbin F., Meylan G., 2013, AA, 553, A120
- Treu & Ellis (2015) Treu T., Ellis R. S., 2015, Contemporary Physics, 56, 17
- Treu & Marshall (2016) Treu T., Marshall P. J., 2016, preprint, (arXiv:1605.05333)
- Vegetti et al. (2012) Vegetti S., Lagattuta D. J., McKean J. P., Auger M. W., Fassnacht C. D., Koopmans L. V. E., 2012, Nat, 481, 341
- Wambsganss (2006) Wambsganss J., 2006, Annalen der Physik, 518, 43
- Williams et al. (2017) Williams P., Agnello A., Treu T., 2017, MNRAS, 466, 3088
- Wright et al. (2010) Wright E. L., et al., 2010, AJ, 140, 1868
- York et al. (2000) York D. G., et al., 2000, AJ, 120, 1579
Appendix A Observed targets
In Table A, we list all 55 observed candidates and their follow-up outcomes. Of the 16 inconclusive objects, most appear as two point sources in imaging. These need either deeper imaging to bring out the lens galaxy, as in the case of J2211+1929, or spectra to confirm that both images are the same quasar. The ruled out candidates are split into those that are single point sources and those that are multiple sources, but not lenses. The single-source objects appear as single point sources in the SDSS, but were selected as potential small separation lenses because they contain galaxy colours and some have SDSS QSO spectra showing galaxy absorption features. These objects can probably be avoided in future searches without risk of losing a substantial number of lenses.
| name | r.a.(J2000) | dec.(J2000) | mag_i | selection method | Instrument | Comments | |||
|---|---|---|---|---|---|---|---|---|---|
| J0941+0518 | 145.3435481 | 5.3069880 | 21.39, 17.44, 18,51 | PopMix, OutlierSel | ESI, OSIRIS | 1.54 | 0.343 | ||
| J2211+1929 | 332.8763774 | 19.4869926 | 15.41 | PopMix | EFOSC2, ESI, NIRC2 | 1.07 | |||
|
Lens |
J2257+2349 | 344.3558623 | 23.8251034 | 17.67 | OutlierSel | EFOSC2, NIRC2 | 2.11 | ||
| J0048+2505 | 12.1457148 | 25.0896541 | 18.77 | OutlierSel | NIRC2 | two point sources | |||
| J0118+4718 | 19.7397002 | 47.3147867 | 18.21 | OutlierSel | NIRC2 | two point sources | |||
| J0130+4110 | 22.5096548 | 41.1693817 | 18.22 | OutlierSel | NIRC2 | two point sources | |||
| J0213+1306 | 33.3262661 | 13.1121799 | 18.47 | OutlierSel | NIRC2 | bad AO correction | |||
| J0252+3420 | 43.0729962 | 34.3382372 | 16.16, 15.96 | OutlierSel | NIRC2 | two point sources | |||
| J02520855 | 43.0879945 | -8.9210091 | 17.79 | OutlierSel | NIRC2 | two point sources | |||
| J08520148 | 133.2245838 | -1.8139580 | 19.42, 18.59 | PopMix | ESI, SAM | two point sources | |||
| J0930+4614 | 142.5881738 | 46.2396842 | 18.25 | OutlierSel | ESI | two traces visible, but too faint to confirm | 2.38 | ||
| J0932+0722 | 143.0298040 | 7.3809231 | 18.94 | OutlierSel | EFOSC2, SAM | two point sources | 1.99 | ||
| J1010+5705 | 152.7130546 | 57.0919030 | 16.93 | PopMix | ESI | one obvious, possibly two blended traces | 1.97 | ||
|
Inconclusive |
J1013+1041 | 153.4169237 | 10.6877941 | 18.44, 17.39 | PopMix | SAM | two point sources | ||
| J1700+0058 | 255.1000485 | 0.9708746 | 16.13 | OutlierSel | NIRC2 | two point sources | |||
| J2103+1100 | 315.8419650 | 11.0053179 | 18.82 | OutlierSel | NIRC2 | two point sources | |||
| J2209+0045 | 332.2788165 | 0.7621817 | 19.50, 19.78 | OutlierSel | NIRC2, EFOSC2, SAM | two point sources | |||
| J2246+3118 | 341.6917100 | 31.3047196 | 19.46, 20.51 | OutlierSel | NIRC2 | two point sources | |||
| J2352+0105 | 358.1586989 | 1.0978733 | 17.16 | PopMix | ESI | one obvious trace | 2.15 | 0.83? | |
| J23530539 | 358.4625516 | -5.6655170 | 18.11, 18.40, 16.52 | PopMix | NIRC2, EFOSC2 | QSO + star | |||
| J0037+0111 | 9.3326860 | 1.1874153 | 18.21 | OutlierSel | NIRC2 | point source + galaxy | |||
| J0120+2654 | 20.0190333 | 26.9153290 | 17.15 | OutlierSel | NIRC2 | point source + galaxy | |||
| J0141+0007 | 25.4609249 | 0.1317267 | 19.06 | PopMix | EFOSC2, ESI, SAM, NIRC2 | QSO + galaxy, | 1.35 | ||
| J02550051 | 43.9399327 | -0.8650315 | 16.79, 19.12 | PopMix | NIRC2 | large separation, no sign of lens | |||
| J0739+1350 | 114.9568004 | 13.8366667 | 16.85, 18.83 | PopMix | ESI | QSO + star | |||
| J08060135 | 121.6793365 | -1.5952567 | 18.22, 17.00 | PopMix | ESI | QSO + star | |||
| J08080051 | 122.0369752 | -0.8643357 | 18.52, 16.60 | PopMix | ESI | QSO + star | |||
| J0808+0118 | 122.1946461 | 1.3110056 | 19.62, 16.03 | PopMix | Goodman, SAM, SAM | 3 stars | |||
| J0836+4841 | 129.2064862 | 48.6983237 | 18.11, 19.03 | OutlierSel | ESI | QSO + AGN pair | |||
|
Not a lens |
J0841+0312 | 130.2782996 | 3.2019064 | 16.04, 18.05 | PopMix | ESI | QSO + star | ||
| J09400249 | 145.1593119 | -2.8267049 | 17.28 | PopMix | ESI | ||||
| J1704+1817 | 256.1354746 | 18.2910172 | 18.36, 20.19, 18.88 | OutlierSel | NIRC2 | three point sources | |||
| J1810+6344 | 272.5184057 | 63.7407189 | 18.99, 18.52 | PopMix | NIRC2 | point source + galaxy | |||
| J20361801 | 309.2195540 | -18.0292749 | 18.04, 17.69 | OutlierSel | NIRC2, EFOSC2 | QSO + star | 2.32 | ||
| J2044+0314 | 311.2035735 | 3.2486361 | 17.22 | PopMix | NIRC2 | three souces in wrong configuration | |||
| J20550515 | 313.8753026 | -5.2504530 | 18.46, 19.01 | OutlierSel | NIRC2, EFOSC2 | QSO + star | |||
| J23500749 | 357.5107284 | -7.8258943 | 18.18, 18.57 | OutlierSel | NIRC2, EFOSC2 | star forming galaxy | |||
| J0001+1411 | 0.3166458 | 14.1897373 | 18.49 | OutlierSel | NIRC2 | SDSS - QSO | |||
| J0005+2031 | 1.4974794 | 20.5235499 | 17.10 | OutlierSel | NIRC2 | ||||
| J0024+0032 | 6.1838018 | 0.5393054 | 17.02 | PopMix, OutlierSel | NIRC2 | SDSS - QSO | |||
| J0116+4241 | 19.0677562 | 42.6953976 | 16.86 | OutlierSel | NIRC2 | ||||
| J0128+0055 | 22.0456250 | 0.9317422 | 17.88 | OutlierSel | NIRC2 | SDSS - QSO | |||
| J02090028 | 32.4458329 | -0.4781211 | 18.86 | PopMix | EFOSC2, SAM | QSO | 1.31 | ||
| J0242+0057 | 40.6679989 | 0.9575364 | 16.59 | OutlierSel | NIRC2 | SDSS - QSO | |||
| J0340+0057 | 55.1983256 | 0.9599661 | 17.81 | OutlierSel | NIRC2 | ||||
| J0502+1310 | 75.6155639 | 13.1822185 | 18.33 | OutlierSel | NIRC2 | ||||
| J1738+3222 | 264.7017777 | 32.3767753 | 17.41 | OutlierSel | NIRC2 | ||||
| J20450101 | 311.4023578 | -1.0299982 | 16.42 | PopMix | NIRC2 | SDSS - QSO | |||
| J21110012 | 317.7877331 | -0.2164685 | 18.38 | OutlierSel | NIRC2 | SDSS - QSO | |||
| J21210005 | 320.3755890 | -0.0908685 | 17.00 | OutlierSel | NIRC2 | SDSS - QSO | |||
|
Not a lens, single source |
J21230050 | 320.8727805 | -0.8480401 | 16.34 | PopMix | NIRC2 | SDSS - QSO | ||
| J2146+0009 | 326.5554674 | 0.1585651 | 19.74 | OutlierSel | NIRC2 | SDSS - QSO | |||
| J2158+1526 | 329.6736308 | 15.4374749 | 17.47 | OutlierSel | NIRC2 | ||||
| J2238+2718 | 339.5371608 | 27.3136765 | 18.08 | OutlierSel | NIRC2 | ||||
| J23580136 | 359.5858434 | -1.6029082 | 16.71 | OutlierSel | NIRC2 |