The light pollution as a surrogate for urban population of the US cities
Abstract
We show that the definition of the city boundaries can have a dramatic influence on the scaling behavior of the night-time light (NTL) as a function of population (POP) in the US. Precisely, our results show that the arbitrary geopolitical definition based on the Metropolitan/Consolidated Metropolitan Statistical Areas (MSA/CMSA) leads to a sublinear power-law growth of NTL with POP. On the other hand, when cities are defined according to a more natural agglomeration criteria, namely, the City Clustering Algorithm (CCA), an isometric relation emerges between NTL and population. This discrepancy is compatible with results from previous works showing that the scaling behaviors of various urban indicators with population can be substantially different for distinct definitions of city boundaries. Moreover, considering the CCA definition as more adequate than the MSA/CMSA one because the former does not violate the expected extensivity between land population and area of their generated clusters, we conclude that, without loss of generality, the CCA measures of light pollution and population could be interchangeably utilized in future studies.
Introduction
More than 80% of the world and more than 90% of the US and European populations live under light-polluted skies (exposition to light at night) falchi2016 . Since the first electric-powered illumination in the second half of the 19th century, the world has become covered by artificial electric light, changing drastically the night view of the Earth from space. The spreading of artificial electric light plays an important role on the duration of the productive day, not only for working but also for recreational activities. If in one hand the benefits of artificial light are quite evident, on the other hand, scientific researches suggest that the exposition to light at night could have adverse effects on both human and wildlife health kerenyi1990 ; blask2005 ; reiter2006 ; navara2007 ; reiter2007 ; chepesiuk2009 ; salgado-delgado2011 ; aube2013 . For example, in humans, the pineal and blood melatonin rhythms are quickly disturbed by light pollution. Such studies argue that the night light exposure have two major physiological effects: they disrupt the circadian rhythms and suppress the production of melatonin salgado-delgado2011 . This repeated suppression may have large consequences for the mammals health. For instance, it was shown that the suppression of the melatonin at night accelerates the metabolic activity and growth of rat hepatoma navara2007 and human breast cancer blask2005 . Moreover, the disruption of circadian rhythms made by the exposure of light at night might plays a crucial role in the etiology of depression salgado-delgado2011 .
The significant consequences of the exposure to night-time light (NTL) with the fact that 54% of world’s population lives in urban areas stimulates the interest in understanding how the light pollution evolves with the size of the US cities un2014 . Bettencourt et al. found the cities in the US exhibit three different types of allometric laws for urban indicators with population size bettencourt2007 : (i) Superlinear . The superlinear urban indicators increase proportionally more than the population of the cities. Such behavior is intrinsically associated with the social currency of a city, indicating that larger cities are associated with optimal levels of human productivity and quality of life. Doubling the city size leads to a larger-than-double increment in productivity and life standards bettencourt2007 ; bettencourt2010a ; Bettencourt2010b . For example, wages, income, growth domestic product (GDP), bank deposits, as well as rates of invention measured by the number of patents and employment in creative sectors show a superlinear behavior bettencourt2007 . (ii) Linear or isometric relation. The increasing of the linear urban indicators is proportional to the increasing of the population reflecting the common individual human needs, like the number of jobs, houses, and water consumption bettencourt2007 . (iii) Sublinear. The sublinear urban indicators increase proportionally less than the population of the cities. This case is a manifestation of the economy of scale. The sublinearity is found in the number of gasoline stations, length of electrical cables, and road surfaces (material and infrastructure) cases bettencourt2007 . From the results shown by Bettencourt et al., several studies have been carried out on the allometry of urban indicators in different levels of human aggregation melo2014 ; oliveira2014 ; bettencourt2016 ; caminha2017 . Following this aim, we analyze and classify the allometric law between the NTL and the population of the US cities.
Here, we use three geo-referenced dataset: the population dataset, the NTL dataset and the Metropolitan/Consolidated Metropolitan Statistical Area (MSA/CMSA). In order to define the boundaries of each US city, we use two methods: the City Clustering Algorithm (CCA) makse1995 ; rozenfeld2008 ; rozenfeld2011 and the MSA/CMSA censusbureau2014 . Finally, we find the allometric scaling between the NTL and the population for the two applied methods. Furthermore, to compare them, we analyze the allometric scaling between area and population.
Materials and Method
Population dataset (GPWv4)
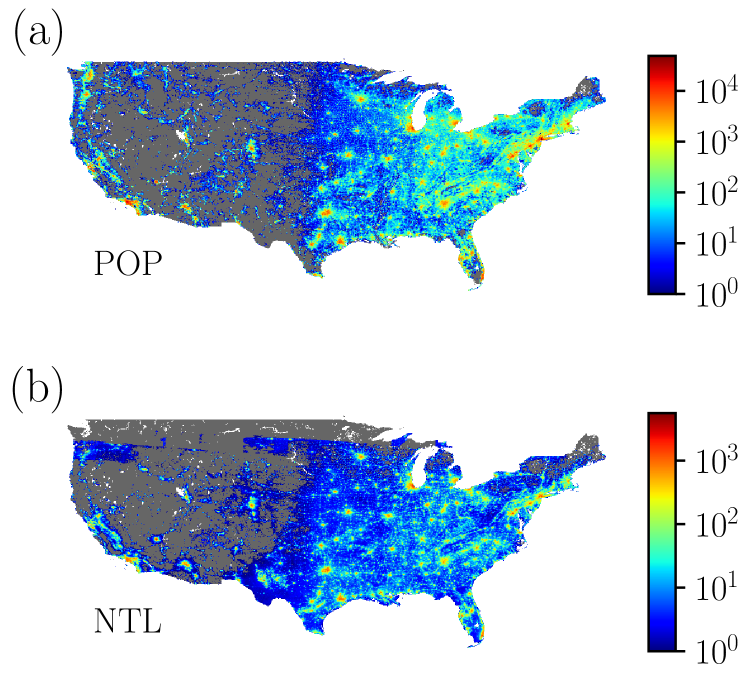
The population dataset is extracted from the fourth version of the Gridded Population of the World (GPWv4) doxsey-whitfield2015 ; sedac2016 from the Center for International Earth Science Information Network (CIESIN) at the Columbia University. The GPWv4 models the human population distribution on a continuous surface at high resolution. Population input data is collected through several censuses around the US, between 2005 and 2014. Data are provided in grid form, where each cell is formed by 30 arc-second angles (approximately 1 km 1 km at the Equator line). We use the US population count data, measured in number of people, for the year 2015, as depicted in Fig. 1a.
The method successively introduced requires the population density of each grid cell. Therefore, we calculated the area of each grid cell dividing them into two spherical triangles. The area of a spherical triangle with edges , and is given by,
| (1) |
where km is the Earth’s radius and the spherical excess is defined by the following expression:
| (2) |
with , , , and . In this context, the distance between two points, and , on the Earth’s surface is calculated by,
| (3) |
with
| (4) |
In this formalism, the values of () and ( are the longitude and latitude, respectively, of the point (), measured in radians.
Night-time light dataset (NTL)
The NTL dataset is given by the night-time light radiance emission data from the National Centers for Environmental Information (NCEI) ncei2016 . The NTL dataset is defined by the monthly average of radiance, measured in , using the night-time data from the scanning radiometer Visible Infrared Imaging Radiometer Suite (VIIRS) Day/Night Band (DNB) mills2013 ; ncei2016 ; viirs2016 . The VIIRS DNB data are processed and filtered in order to exclude data impacted by the lunar illumination, lightning and cloud-cover, but they are susceptible to other temporal lights, e.g. aurora, fires, and boats mills2013 ; ncei2016 . Such data span through the entire globe with a resolution of 15 arc-second (approximately 500 m 500 m at the Equator line) between the latitudes 75∘ North and 65∘ South. We use the US data for the year 2015 (April), as shown in Fig. 1b.
Metropolitan Statistical Area (MSA), Primary Metropolitan Statistical Area (PMSA) and Consolidated Metropolitan Statistical Area (CMSA)
The MSA are geographic entities with high degree of socioeconomic integration and population over 50,000 people. The PMSA are quite similar to MSA, however they present population over 1,000,000 people. The CMSA are metropolitan regions defined by the agglomeration of some PMSA. They are all delineated by the Office of Management and Budget (OMB) and provided by the US Census Bureau censusbureau2014 .
Data processing
In order to superimpose the datasets, we perform two processes: (i) As the NTL grid has a higher resolution than the GPWv4 grid, we sum the values of all NTL grid cells, which their geolocated centers are within the same geolocated GPWv4 grid cell. Therefore, we produce a new NTL grid with the same positioning and resolution of the GPWv4 dataset; (ii) For the MSA/CMSA case, we use the same approach of (i), even though the MSA/CMSA are complex polygons. To deal with this problem, we use the even-odd rule algorithm shimrat1962 . Thus, we define the NTL value for each MSA/CMSA.
City Clustering Algorithm (CCA)
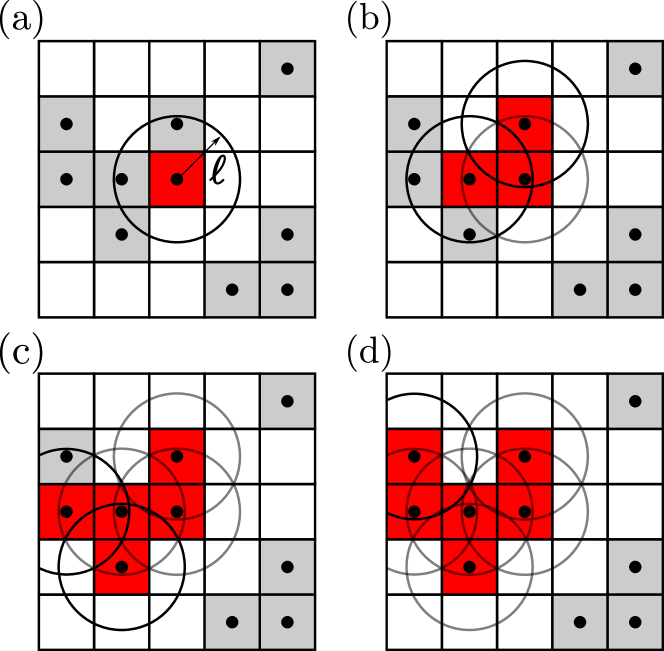
We define the boundaries of each US city by applying the CCA to the population grid makse1995 ; rozenfeld2008 ; rozenfeld2011 . We use the continuum CCA that depends on two parameters, namely, a population density threshold, and a cutoff length, rozenfeld2011 . For the -th grid cell, the population density is geo-referenced in its geometric center (shown as small black circles in Fig. 2). If , the -th grid cell is populated. In Fig. 2 the populated cells are shown in grey and red. Next, the algorithm selects a populated cell (red cell in Fig. 2a) and aggregates in the same cluster all nearest populated cells which are within a distance from each (red cells in Figs. 2b, 2c and 2d). The Fig. 2 shows the four steps to determine the red cluster.
Results
We apply the CCA to the population grid varying (in ), from 0 to 10000, and (in ), from 1 to 20. For all pairs of parameters, we find that it is possible to statistically correlate through power-law relations the area and the population as well as the NTL and the population of the US cities,
| (5) |
| (6) |
The exponents and are obtained through Ordinary Least Square (OLS) montgomery2015 fitting to the data for different values of the parameters and . The ranges of compatibility and the consistency of the CCA technique are investigated in Figs. 3a-d.
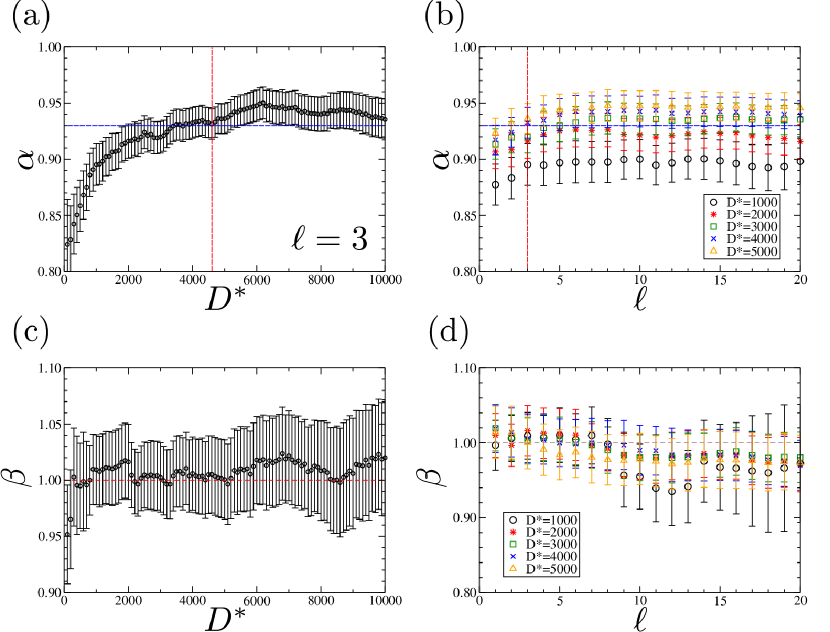
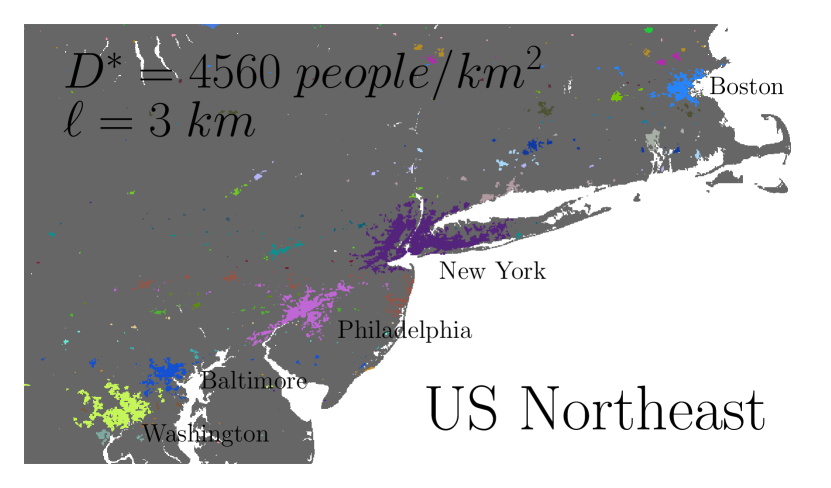
Indeed, the definition of the parameters and of the CCA affects the dimension and the geometry of the cities, but from the Figs. 3c and 3d, it can be seen that it does not affect the allometric exponent . Here, our starting strategy is to determine a range of parameters and for which the relation between area and population is isometric rozenfeld2008 ; rozenfeld2011 ; oliveira2014 ; caminha2017 . We find that for and the allometric exponent is between and and we consider this relation approximately linear. Inside this range, we analyze the result of the CCA using and , where the five larger cities in the US Northeast Coast naturally emerge, as depicted in Fig. 4. We believe that, the lack of an exactly linearity, also inside this range, is due to the high density of some downtowns, specifically, of the most populated urban centers of the US Northeast Coast.
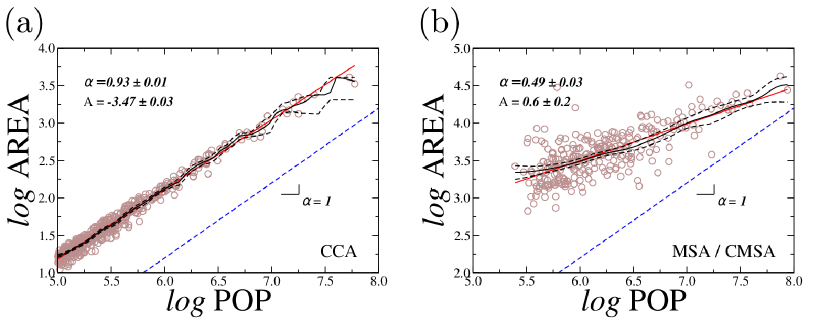
For the pair of parameters, and , we find a allometric exponent (Figs. 5a) and a linear scaling between NTL and the population with exponent (Figure 6a). Alternatively, others parameters inside this range could be analyzed without affecting the allometric exponent (as shown in Figs. 3c and 3d).
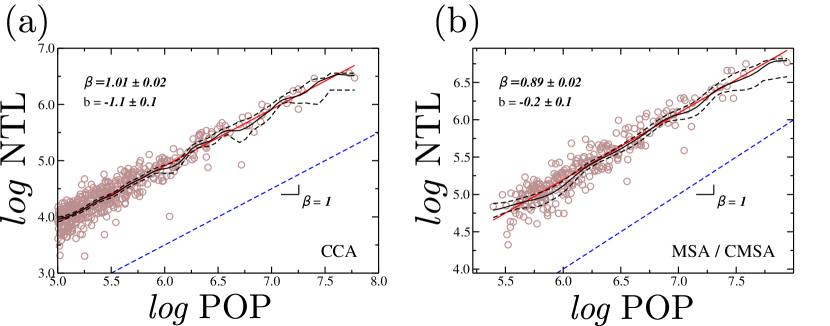
By analyzing the allometric scaling of the NTL with the population of the US cities using the MSA/CMSA (Fig. 6b), we obtain the allometric exponent . Such an exponent characterizes a sublinear relation between the NTL and the population, in contrast with the CCA result.
As shown in Fig. 5b, the sublinear scaling behavior of the MSA/CMSA areas as a function of their corresponding populations, , clearly suggests that this might not be the most adequate definition of a city agglomerate to be adopted in our study.
As indicated by Oliveira et al. oliveira2014 , the arbitrary geopolitical concept behind the MSA/CMSA seems to overestimate the natural limits of urban areas. In order to illustrate this fact, we show in Fig. 7 the MSA/CMSA of the five most populated US regions, namely, New York-Northern New Jersey-Long Island (NY, NJ, CT, PA), Los Angeles-Riverside-Orange County (CA), Chicago-Gary-Kenosha (IL,IN,WI) and Houston-Galveston-Brazoria (TX). The first and second columns show respectively the detailed maps of the population and the NTL datasets. The third column exhibits the cities defined by the CCA with =4560 and =3, as well as the discrepancy between the urban areas belonging to MSA/CMSA and CCA.

Conclusions
We analyzed the allometric scaling behavior of the NTL as a function of the population of the US cities. Our results corroborate previous works showing that the scaling behaviors of urban indicators with population can be substantially different for distinct definitions of city boundaries. Precisely, using the MSA/CMSA definition, we found a sublinear allometric scaling exponent . Applying the CCA, we found an exponent which indicates an isometric relation between the light pollution and the population of the US urban agglomerations, in clear contrast with the exponent obtained using the MSA/CMSA. Considering the consistency of the CCA definition in terms of the extensivity between land population and area of their generated clusters, as demonstrated in previous studies for other urban indicators oliveira2014 , we come to the conclusion that the proportionality between light pollution and population is indeed correct, as intuitively expected li2015 . Under this framework and without loss of generality, it is therefore plausible to utilize NTL as a surrogate for city population in future studies.
The isometric relation between NTL and population of the US urban agglomeration, obtained applying the CCA, imply that small and large cities are proportionally indistinguishable in terms of light pollution. In other words, there is no economy of scale or sublinearity concerning the NTL in US cities. Our result shows that a growth of the US cities will aggravate the light pollution and therefore the possible negative effects of the light pollution for the humans and the wildlife health.
Acknowledgments
We gratefully acknowledge CNPq, CAPES, FUNCAP and the National Institute of Science and Technology for Complex Systems in Brazil for financial support. We especially thank our colleagues and friends H. P. M. Melo and T. A. Amor for the help and the discussions.
References
References
- (1) F. Falchi, P. Cinzano, D. Duriscoe, C. C. M. Kyba, C. D. Elvidge, K. Baugh, B. A. Portnov, N. A. Rybnikova, R. Furgoni, The new world atlas of artificial night sky brightness, Science Advances 2 (6) (2016) e1600377.
- (2) N. A. Kerenyi, E. Pandula, G. Feuer, Why the incidence of cancer is increasing: The role of light pollution, Medical Hypotheses 33 (2) (1990) 75.
- (3) D. E. Blask, G. C. Brainard, R. T. Dauchy, J. P. Hanifin, L. K. Davidson, J. A. Krause, L. A. Sauer, M. A. Rivera-Bermudez, M. L. Dubocovich, S. A. Jasser, D. T. Lynch, M. D. Rollag, F. Zalatan, Melatonin-depleted blood from premenopausal women exposed to light at night stimulates growth of human breast cancer xenografts in nude rats, Cancer Research 65 (23) (2005) 11174.
- (4) R. J. Reiter, F. Gultekin, L. C. Manchester, D. Tan, Light pollution, melatonin suppression and cancer growth, Journal of Pineal Research 40 (4) (2006) 357.
- (5) K. J. Navara, R. J. Nelson, The dark side of light at night: Physiological, epidemiological, and ecological consequences, Journal of Pineal Research 43 (3) (2007) 215.
- (6) R. J. Reiter, D. Tan, A. Korkmaz, T. C. Erren, C. Piekarski, H. Tamura, L. C. Manchester, Light at Night, Chronodisruption, Melatonin Suppression, and Cancer Risk: A Review, Critical Reviews in Oncogenesis 13 (4) (2007) 303.
- (7) R. Chepesiuk, Missing the Dark: Health Effects of Light Pollution, Environmental Health Perspectives 117 (1) (2009) A20.
- (8) R. Salgado-Delgado, A. Tapia Osorio, N. Saderi, C. Escobar, Disruption of circadian rhythms: A crucial factor in the etiology of depression, Depression Research and Treatment 2011 (839743) (2011) 1.
- (9) M. Aubé, J. Roby, M. Kocifaj, Evaluating Potential Spectral Impacts of Various Artificial Lights on Melatonin Suppression, Photosynthesis, and Star Visibility, PLoS ONE 8 (7) (2013) 1.
- (10) United Nations, World’s population increasingly urban with more than half living in urban areas, accessed: 2017-06-01 (2014). http://www.un.org/en/development/desa/news/population/world-urbanization-prospects-2014.html
- (11) L. M. A. Bettencourt, J. Lobo, D. Helbing, C. Kühnert, G. B. West, Growth, innovation, scaling, and the pace of life in cities, Proceedings of the National Academy of Sciences of the United States of America 104 (17) (2007) 7301.
- (12) L. M. A. Bettencourt, G. B. West, A unified theory of urban living, Nature 467 (7318) (2010) 912.
- (13) L. M. A. Bettencourt, J. Lobo, D. Strumsky, G. B. West, Urban scaling and its deviations: Revealing the structure of wealth, innovation and crime across cities, PLoS ONE 5 (11) (2010) 20.
- (14) H. P. M. Melo, A. A. Moreira, É. Batista, H. A. Makse, J. S. Andrade, Statistical signs of social influence on suicides, Scientific reports 4 (6239) (2014) 1.
- (15) E. A. Oliveira, J. S. Andrade, H. A. Makse, Large cities are less green, Scientific reports 4 (4235) (2014) 1.
- (16) L. M. A. Bettencourt, J. Lobo, Urban scaling in Europe, Journal of The Royal Society Interface 13 (116) (2016) 1.
- (17) C. Caminha, V. Furtado, T. H. C. Pequeno, C. Ponte, H. P. M. Melo, E. A. Oliveira, J. S. Andrade, Human mobility in large cities as a proxy for crime, PLoS ONE 12 (2) (2017) e0171609.
- (18) H. A. Makse, S. Havlin, H. E. Stanley, Modelling urban growth patterns, Nature 377 (6550) (1995) 608.
- (19) H. D. Rozenfeld, D. Rybski, J. S. Andrade, M. Batty, H. E. Stanley, H. A. Makse, Laws of population growth., Proceedings of the National Academy of Sciences of the United States of America 105 (48) (2008) 18702.
- (20) H. D. Rozenfeld, D. Rybski, X. Gabaix, H. A. Makse, The area and population of cities: New insights from a different perspective on cities, American Economic Review 101 (5) (2011) 2205.
- (21) US Census Bureau, Cartographic Boundary Files, accessed: 2017-06-01 (2014). http://www.census.gov
- (22) E. Doxsey-Whitfield, K. MacManus, S. B. Adamo, L. Pistolesi, J. Squires, O. Borkovska, S. R. Baptista, Taking Advantage of the Improved Availability of Census Data: A First Look at the Gridded Population of the World, Version 4, Papers in Applied Geography 1 (3) (2015) 226.
- (23) Socioeconomic data and application center (SEDAC), Gridded Population of the World, Version 4 (GPWv4), accessed: 2017-06-01 (2016). http://sedac.ciesin.columbia.edu
- (24) S. Mills, S. Weiss, C. Liang, VIIRS day/night band (DNB) stray light characterization and correction, SPIE Optical Engineering Applications 8866 (88661P) (2013) 1.
- (25) National Centers for Environmental Information (NCEI), Visible Infrared Imaging Radiometer Suite (VIIRS), accessed: 2017-06-01 (2016). http://www.ngdc.noaa.gov/eog/viirs.html
- (26) National Aeronautics and Space Administration (NASA), Visible Infrared Imaging Radiometer Suite (VIIRS), accessed: 2017-06-01 (2016). http://npp.gsfc.nasa.gov/viirs.html
- (27) M. Shimrat, Algorithm 112: Position of point relative to polygon, Communications of the ACM 5 (8) (1962) 434.
- (28) D. C. Montgomery, E. A. Peck, G. G. Vining, Introduction to linear regression analysis, John Wiley & Sons, 2015.
- (29) E. A. Nadaraya, On estimating regression, Theory of Probability & Its Applications 9 (1) (1964) 141.
- (30) G. S. Watson, Smooth regression analysis, Sankhyā: The Indian Journal of Statistics, Series A (1964) 359.
- (31) X. Li, X. Wang, J. Zhang, L. Wu, Allometric scaling, size distribution and pattern formation of natural cities, Palgrave Communications 1 (15017) (2015) 1.