Microstructural and magnetic property evolution with different heat-treatment conditions in an alnico alloy
Abstract
Further property enhancement of alnico, an attractive near-term, non-rare-earth permanent magnet alloy system, primarily composed of Al, Ni, Co, and Fe, relies on improved morphology control and size refinement of its complex spinodally decomposed nanostructure that forms during heat-treatment. Using a combination of transmission electron microscopy and atom probe tomography techniques, this study evaluates the magnetic properties and microstructures of an isotropic 32.4Fe-38.1Co-12.9Ni-7.3Al-6.4Ti-3.0Cu (wt.) alloy in terms of processing parameters such as annealing temperature, annealing time, application of an external magnetic field, as well as low-temperature “draw” annealing. Optimal spinodal morphology and spacing is formed within a narrow temperature and time range ( and ) during thermal-magnetic annealing (MA). The ideal morphology is a mosaic structure consisting of periodically arrayed diameter (Fe-Co)-rich rods ( phase) embedded in an (Al-Ni)-rich ( phase) matrix. A Cu-enriched phase with a size of is located at the corners of two adjacent facets of the phase. The MA process significantly increased remanence () () of the alloy due to biased elongation of the phase along the crystallographic direction, which is closest in orientation to the applied magnetic field. The optimum magnetic properties of the alloy with an intrinsic coercivity () of and a maximum energy product () of were attributed to the uniformity of the mosaic structure.
keywords:
permanent Magnet, alnico, spinodal decomposition , transmission electron microscopy1 Introduction
Permanent magnets (PM) are widely used in daily life, e.g. loudspeakers, electric motors in air conditioners, washing machines, and hybrid cars. PMs are also used in technological applications, such as traveling wave tubes, Hall-effect sensors, and sorting or separation equipment [1, 2]. The PM family is mainly composed of ferrites, rare-earth based PM (Nd-Fe-B and Sm-Co), and alnico [1, 2]. Alnico is an alloy system composed mainly of Al, Ni, Co, Fe and a small amount of Ti and Cu. Alnico magnets have attracted recent attention due to their good performance at high temperature and worldwide abundance of their elemental components [1, 2, 3]. Alnico was discovered in the 1930s and had been continuously developed and optimized until the 1970s. Currently, the commercial alnico alloys with the highest coercivity and energy product () are alnico 8H with coercivity () of and alnico 9 with a of , respectively [2, 4]. The commercial alloys consist of periodically distributed and crystallographically oriented (Fe-Co)-rich () rods embedded in an (Al-Ni)-rich () matrix form by spinodal decomposition (SD) within an applied magnetic field [4]. Microstructural details depend on specific alloy chemistry and processing [4]. Shape anisotropy of the rods is currently understood to provide a basic level of coercivity to the alloys [5]. The relatively high magnetic energy product of alnico 9 is derived from a directional solidification process used to cast the magnet that provides overall microstructural alignment and magnetic hysteresis loop “squareness”. Theoretical simulations performed for similar systems suggest that alnico may be able to double its energy product if the rods can be controlled with a volume fraction of and a diameter of [6, 7].
Alnico alloys achieve their best magnetic properties after a complicated heat-treatment (HT) process, which includes a high temperature () solution treatment, followed by short-time thermal-magnetic annealing () and a long-time lower temperature stepped drawing () [8]. Previous studies indicated that the magnetic properties of alnico are sensitive to the time and temperature of the magnetic field annealing (MA), as well as to the constituent elements of the alloy, including minor additions [4, 8, 9, 10, 11, 12, 13, 14, 15]. However, a comprehensive investigation on how different HT parameters affect the microstructure and magnetic property evolution of alnico is lacking. Better understanding of the effect of the various processing steps on morphology and chemistry of the SD phase separation process for alnico is required in order to achieve the alloy’s theoretical limit. In this study, we have delved further into unraveling the complex nanostructures that control the alloy properties by careful microstructural evaluation of an isotropic alnico alloy with different HT process conditions. In particular, we analyzed the effects of annealing time, annealing temperature, as well as the presence of an external magnetic field. A combination of transmission electron microscopy (TEM) and atom probe tomography (APT) techniques were used to characterize both the morphology and chemistry of phases in the alloy.
2 Experimental details
Using commercial alnico 8H as a model composition, a powder having a composition of 7.3Al-13.0Ni-38.0Co-32.3Fe-3.0Cu-6.4Ti (wt.) was produced by close-coupled gas-atomization. The spherical gas atomized powders provide a uniform starting material. Sieved powders, in diameter, were loaded into a stainless steel can for hot isostatic pressing (HIP). Before sealing, the powders were outgassed at for under vacuum (). The HIP can was sealed under vacuum by electron beam welding. The HIP process was performed under a pressure of at for . Center sections of the HIP consolidated alnico were cut into cylinders ( diameter and length) using electrical discharge machining. The resulting alloy was polycrystalline with random grain orientations.
Since the HIP samples undergo slow cooling, the nanostructures were reset by reheating the cylindrical samples at for in vacuum () and quenched using an oil bath. The samples were then annealed between and for different periods of time (0.5 to ) with and without an external applied magnetic field of . Some samples also went through an additional multi-stepped low temperature annealing or ‘drawing process’ that is typically used in industry. The first step was at for and the second step was at for . The HT process that includes both magnetic field annealing and multi-stepped drawing is termed “full heat treatment (FHT) condition”. To capture the effect of applying an external field on the morphology of SD phases at the early stage of phase separation, APT analysis was performed on two samples, which were annealed at for only with and without an external applied field of , followed by a water quench to room temperature. All other samples were furnace cooled to room temperature after their HT process. Samples labeled as to were selected for TEM analysis and their heat-treatment conditions are summarized in Table 1.
| Samples | MA | Draw | ||||
| Temperature | Time | Magnetic | ||||
| () | () | Field | ||||
| 800 | 10 | Yes | ||||
| 840 | 10 | Yes | ||||
| 860 | 10 | Yes | ||||
| 800 | 10 | Yes | Yes | |||
| 840 | 10 | Yes | Yes | |||
| 860 | 10 | Yes | Yes | |||
| 840 | 1.5 | Yes | ||||
| 840 | 60 | Yes | ||||
| 800 | 10 | |||||
| 840 | 10 | |||||
| 860 | 10 | |||||
The magnetic properties were measured using a Laboratorio Elettrofisico Engineering Walker LDJ Scientific AMH-5 Hysteresis graph with a coil and a maximum applied field of at room temperature in a closed-loop setup. TEM samples were prepared by mechanical wedge-polishing followed by a short time, low-voltage Ar ion-milling with a liquid-nitrogen-cold stage. TEM analysis was performed on transverse (observation along the magnetic field direction during annealing) and longitudinal (observation perpendicular to the magnetic field direction during annealing) orientations. An FEI Tecnai F20 (, equipped with a field-emission gun (FEG)) was used for microstructural characterization. Scanning electron microscopy (SEM) was performed using an FEI Nova FEG-SEM. For the MA sample, APT tips were lifted out from a grain with its crystallographic direction parallel to the external magnetic field direction. The orientation of that grain was identified using orientation imaging microscopy (OIM) on an Amray 1845 FEG-SEM. An FEI Nova 200 dual-beam focused ion beam (FIB) instrument was used to perform lift-outs and annular milling of targeted grains to fabricate the needle-shaped APT specimens. A wedge shaped lift-out geometry was used to mount multiple samples on a Si “microtip” array to enable the fabrication of several needles from one wedge lift-out [16]. APT was performed with a local electrode atom probe (CAMECA LEAP 4000X HR). Samples were run in voltage mode with a base temperature of and pulse fraction at a repetition rate of . The datasets were reconstructed and analyzed using the IVAS 3.6.12 software (CAMECA Instruments) [17, 18].
3 Experimental results
3.1 Effect of magnetic field annealing temperature
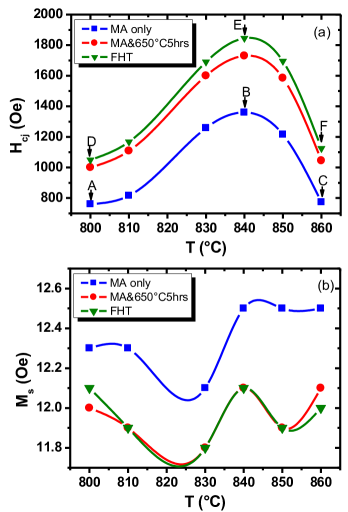
The effect of MA temperature on the intrinsic coercivity () and saturation magnetization () is shown in Fig. 1. The and of MA-only, MA + ( draw), and FHT samples are indicated by the blue, red, and green lines, respectively. For all samples, it is obvious that is very sensitive to the MA temperature. The maximizes at at for MA-only and at after FHT. Note that low-temperature drawing consistently increases and the peak position remains at . Each of the two annealing steps results with a nearly constant increase. The first draw after MA caused a slight decrease of , but there is no obvious further change of after the final drawing. To better understand how the applied magnetic field and various annealing steps affect magnetic properties, microstructure evolution of select samples, labeled as through in Fig. 1 were examined in detail.
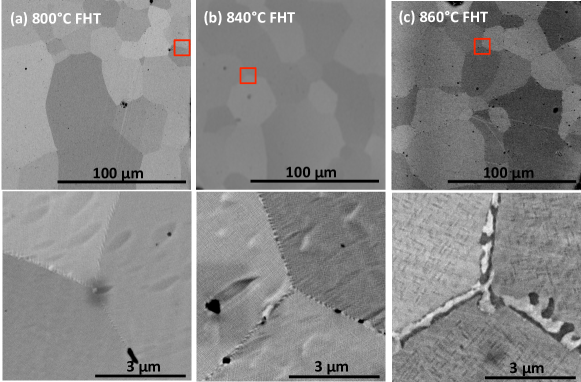
SEM images of the FHT samples subjected to MA at (samples , , and , respectively), are shown in Fig. 2. For all samples, an average grain size of was observed. The variation of contrast between grains is due to their random orientation. At higher magnification, a small phase fraction of mixed phases at the grain boundaries (GBs) can be observed. The thickness and, therefore, volume fraction of these GB phases increase with increasing MA temperature. Energy dispersive X-ray analysis (EDX) of sample shows that the bright region in the grain boundary is (Fe-Co)-rich, while the gray region is (Al-Ni)-rich.
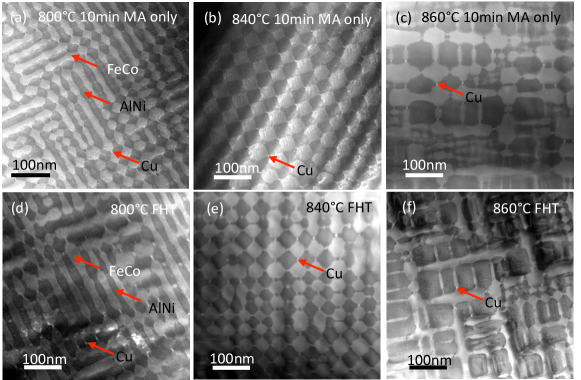
TEM examination of samples through was performed along both the transverse and longitudinal directions. High-angle-annular-dark-field (HAADF) scanning transmission electron microscopy (STEM) imaging (-contrast imaging) was used to minimize strain contrast and to differentiate phase morphology. HAADF-STEM imaging is sensitive to the atomic number , i.e., elements with higher atomic number will exhibit brighter contrast in the image because of greater electron scattering at large detector collection angles [19]. Samples , , and were subjected to MA for at , respectively, followed by furnace cooling. STEM observations along the transverse direction showed that diamond shaped ( diameter) and rod shaped ( diameter and length) phases coexisted in sample (Fig. 3a). Also, Cu-enriched particles are observed at the corners of the two facets of the diamond shape phases [4]. The longer axis of the rod shape phase is aligned along the crystallographic direction but formed nearly orthogonal to the applied magnetic field. Sample has a well-defined “mosaic” patterned structure (Fig. 3b), similar to commercial alnico 8 [4]. The phase has a diameter of , indicating an increase in the rod diameter with a higher annealing temperature. A further increase of MA temperature to destroys the well-defined mosaic pattern, as shown in sample (Fig. 3c), and the morphology of phase becomes irregular. Both large regions with sizes up to and small phases with a diameter of were observed. Cu-enriched particles were sometimes observed between two phases. Samples through were subjected to an additional lower temperature drawing process (@ followed by @), after MA at different temperatures. Compared to the MA-only samples treated at the same temperature, no significant morphology modification was observed along the transverse direction after drawing, as shown in Fig. 3d–f. However, there are some subtle contrast changes in the and phases and morphology changes in the Cu-rich phases as discussed below.
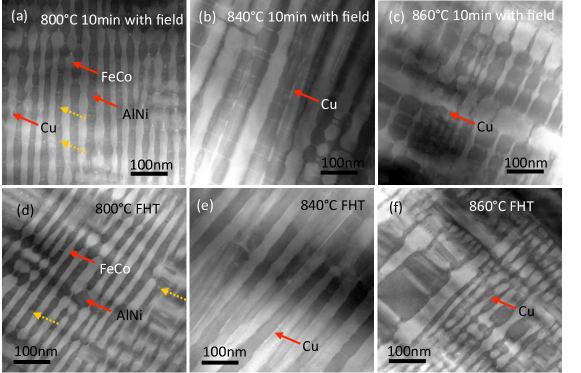
Observation along the longitudinal direction (Fig. 4) showed that the phase is elongated for all samples ( through ), though less consistently for the samples subject to MA at . For sample , the diameter of the elongated phase is . Small precipitates (), as indicated by dotted yellow arrows in Fig. 4a and confirmed by EDS point analysis, were commonly observed inside the phase between two elongated rods. Small precipitates agglomerate and form slightly bigger particles after the drawing process, as exhibited by sample (Fig. 4d). For samples treated at , the rods are wide and up to long. Cu-enriched rods with a length of precipitated along the edge of the rods in sample (Fig. 4b). After the lower temperature drawing process, the length of the Cu-enriched rods increases to , as shown in sample (Fig. 4e). For the sample subject to MA at (sample ), small particles tended to coarsen after drawing. The length of rods had a wide size range between tens of nanometers and up to , as shown in Fig. 4f.
3.2 Effect of magnetic field annealing time
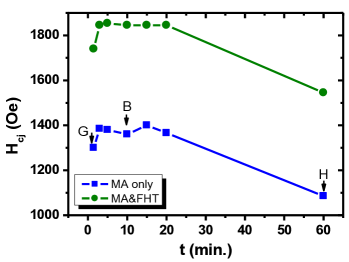
Since MA at is critical for the formation of a well-defined mosaic pattern that produces maximum , experiments were designed to study the effect of the MA time at on the magnetic properties. Samples were treated at for time ranging from to , followed by furnace cooling. The measured values are shown in Fig. 5. The blue line denotes samples with the MA treatment only, while the green line denotes samples treated with the FHT process. The first increases to as MA time increases from to . Between and , the stays relatively constant. After a MA, the decreases to . Drawing improves the of all samples and the increase of with low temperature annealing for the drawn samples follows the same trend as that for samples without drawing. Samples labeled as and in Fig. 5 were selected for further TEM analysis.
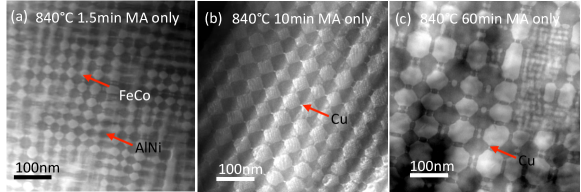
Figure 6 shows the SD morphologies viewed along the transverse direction of samples , (same as in Fig.3 but used again here for comparison), and with MA time of , respectively. The diameter of the phase increases from to with increasing MA time from to , respectively. Most of the area imaged in sample (Fig. 6a) formed a mosaic pattern, but some regions exhibited a blurry contrast, which appears to originate from incomplete phase separation. Increasing the MA time to drastically modifies the SD morphology, as shown in Fig. 6c (sample ). The size of the phase transformed into a bimodal distribution during the extended MA. The morphology consists of a larger phase with a size of and a smaller round (non-faceted) phase with a size of . The larger phase has alternating and facets. Some of the smaller phases are located at the regions between two facets of the bigger phases and some of them form clusters. Cu-enriched phases were also observed at the corners of two larger facets, but these Cu-enriched phases are slightly smaller compared to those in sample .
3.3 Effect of magnetic field
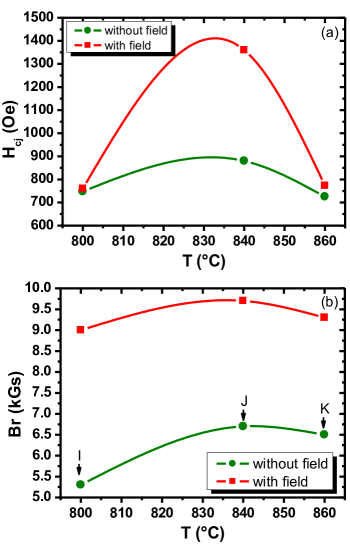
Finally, the magnetic field effect was analyzed by comparing the magnetic properties ( and ) of samples treated with/without external magnetic fields at different temperatures, as shown in Fig. 7. Samples treated in the absence of a magnetic field at are labeled as , , and , respectively, and are compared to samples , , and in Fig. 7. For both sets of samples, there is a maximum at , but the of sample is , which is smaller than that of sample . The presence of an external magnetic field barely affects the of samples treated at 800 and . On the other hand, all samples treated using a magnetic field have an obviously higher () compared with those treated without a magnetic field, as shown in Fig. 7b.
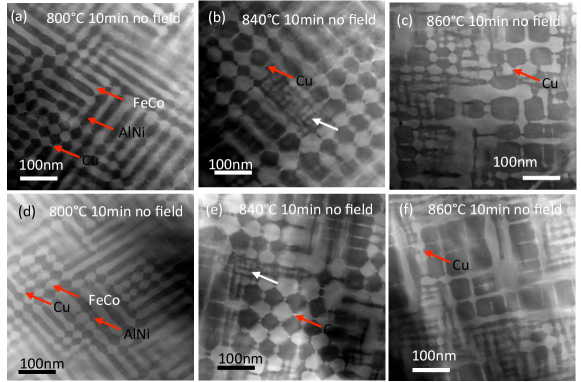
TEM analysis along the transverse direction shows that the morphology of the SD phases in samples and (Fig. 8a and 8c, respectively) is similar to that of samples and (Fig. 3a and 3c), indicating no biasing of the microstructure along the transverse direction if MA is performed away from the optimum temperature (). However, a SD morphology difference (Fig. 3b and Fig. 8b) was observed between sample and sample . Only some areas of sample exhibit a mosaic pattern. The faceting of rods is not as well defined as those in sample . Moreover, between regions with a mosaic pattern, there are clusters of the phase with smaller diameters, as indicated by the white arrow in Fig. 8b. Viewing samples along the longitudinal direction showed that the SD phase morphology is similar to that observed along the transverse direction, which obviously suggests that the phases in samples (, , and ) are oriented isotropically, as expected without an external field biasing effect.
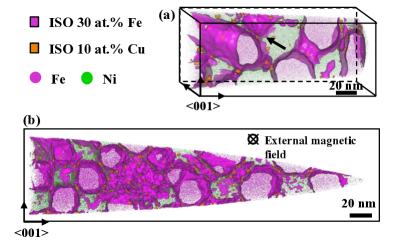
The effects of external magnetic field on the morphology of SD phases at the early stage of SD are shown in the 3D APT reconstructed iso-surfaces in Fig. 9. The non-field annealed (Non-MA) sample has rods with their longer axis aligned along all three orthogonal directions (Fig. 9a) [20]. In contrast, in the MA sample, the phase is much longer and preferentially elongates along the direction closest to the external magnetic field direction (Fig. 9b). The APT bulk composition from the center of the and phases of both samples (Table 2) shows similar concentrations in the two and phases, indicating that the field mainly biases the morphology of the SD phases and has no obvious effects on their chemistry.
| Phase | Sample | Al | Ti | Fe | Co | Ni | Cu |
|---|---|---|---|---|---|---|---|
| MA | 4.28 | 1.01 | 52.47 | 36.48 | 4.55 | 1.22 | |
| Non-MA | 4.35 | 1.04 | 51.92 | 36.65 | 4.79 | 1.22 | |
| MA | 22.45 | 14.98 | 13.08 | 33.36 | 14.29 | 1.86 | |
| Non-MA | 22.06 | 14.52 | 13.72 | 33.08 | 14.69 | 1.89 |
4 Discussion
The results presented clearly show that the magnetic properties of alnico are closely related to the morphology of the SD phases, which in turn are sensitive to both thermal MA and post-MA processing. The best magnetic properties are promoted by well-aligned rods of the phase in a uniformly spaced mosaic pattern. This pattern is observed only if a magnetic field is applied in a very narrow temperature range for a limited time (e.g. for for this alloy). Subsequent low temperature anneals are required to further increase the coercivity, which can be increased as much as . There are no apparent morphological changes corresponding to the increase in the coercivity, except for the elongation of the Cu-enriched phase.
These results suggest that there is likely several mechanisms at play in addition to SD. For alloys with a miscibility gap, a two-phase mixture can be formed by either classical nucleation and growth (NG) or by an SD path [21]. The NG path arises with small undercooling (low supersaturation) and requires relatively large localized composition fluctuations [21]. The size of the nucleated second phase grows with phase separation time. The SD path occurs at large undercooling and the transformation occurs homogeneously throughout the alloy by continuous growth of initially small compositional fluctuations [21]. Theoretical studies on magnetic aging of the SD alloy showed that early in the SD process, the composition wave length is determined by the interplay of chemical free energy, elastic energy, and magnetic energy [22, 23]. The elastic energy suppresses the system SD, while the magnetic energy suppresses the development of composition waves along the external field direction [23]. The magnetic energy can have a serious effect on the SD process only when the alloy is annealed just below the Curie temperature, where the change of magnetic energy is the largest [23]. Our experiments showed that the MA process is very effective in forming uniformly spaced rods only when MA is conducted at a specific temperature range ( for this alloy, samples and in Table 1), which tends to support this prediction.
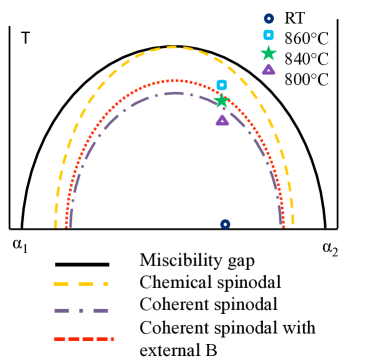
Considering alnico as a pseudo-binary alloy that consists of
and phases with a miscibility gap, its phase diagram may be
illustrated schematically in Fig. 10. The chemical spinodal line
is defined by the inflexion point of the isothermal free energy ()
composition curve
(=). The
coherent SD line is defined by the displacement of the SD curve due to
strain energy. Since the SD process is homogeneous and the SD phase is
typically uniform within a grain [21], it
is reasonable to assume that a homogeneous structure with a periodic
pattern in the alloy implies that the alloy decomposes along the path
of SD. Transverse observations from TEM indicate that samples
, , and (MA @ or
lower) follow a SD path, while samples , , and
(MA@ ) follow a NG path. As a result,
the SD coherent spinodal line shifts upward due to application of an
external field, as outlined in Fig. 9. This may be because the
application of an external magnetic field promotes elongation of the
phase along the field direction substantially at
, which can slightly modify the strain energy of the
system and change the phase separation mechanism perpendicular to the
field direction from NG to SD.
The similarity in the SD morphologies of samples treated with MA only (samples , , and in Table 1) and FHT processes (samples , , and in Table 1) reveals that the shape of the phase is established during the MA stage by SD. Drawing may further “tune” the chemistry differences between the and phases, which can cause larger magnetization differences between and phases. This is because at a much lower temperature (draw annealing), the long-range kinetic effects during MA are suppressed, but the chemical driving forces still allow for small, but important chemical separation to continue. As a result, there is a large increase in with FHT. Details on the morphology and chemistry changes, as well as the evolution of Cu-enriched phase during MA at and the drawing process, will be reported elsewhere.
The changes of the magnetic properties and microstructures with different MA time at (samples , , and ) suggest that the mosaic structure set by the MA process after , which gives the best magnetic properties, is a metastable structure. The phase will grow into a different morphology if the sample is subjected to MA for a long enough time. The mosaic structure may be temporarily stabilized by the Cu-enriched phase at the corners of rods, which introduces a large amount of strain and constrains the growth of the phase. Observation of the Cu-enriched phase with a smaller size in sample tends to support the hypothesis that the phase can grow larger only after the Cu-enriched phase is broken into smaller particles by extended magnetic annealing.
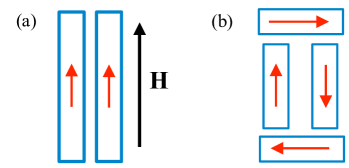
Particle elongation during MA seems to be driven by magnetostatic interaction, which is the same provider of magnetic shape anisotropy and coercivity in alnico. For shape anisotropy, the shape of the elongated magnetic particles is fixed and the magnetization tends to align along the longer axis of the particles to lower magnetostatic energy. Similarly, for particle elongation during MA, the magnetization vectors of the magnetic phase are fixed along the field direction (For simplicity, we assume that a saturated field is applied along the [001] direction.) and the magnetic phases tend to evolve into elongated shapes with their long axes along or close to the field direction.
The two major phases in alnico, and , have coherent lattices and the corresponding interfacial energy is relatively small [23, 24, 25]. This results in a high sensitivity of the microstructure to the external magnetic field during MA, especially at the onset of SD and just below the Curie temperature, when the composition difference between two phases is still small, but the magnetization difference may be large. The composition waves along the field direction are thus effectively suppressed at the initial stage of SD [23]. Thus, a well-defined mosaic pattern is developed within a short time during MA (Fig. 11a) perpendicular to the field direction. After the SD phases become fully developed, the composition difference between the two phases and their interfacial energy both increase. For an extended MA, rods may become larger and more round (with both and faceting), as shown in Fig. 6c, to minimize the interfacial energy. In the absence of an external magnetic field, the phase may still elongate along a direction and form closed loops to minimize the magnetostatic energy. Elongated phases embedded in phases still form in three dimensions, but the overall microstructure is isotropic, as illustrated in Fig. 11b.
5 Conclusions
The correlations between magnetic properties, microstructure and HT conditions have been comprehensively studied for alnico. The morphology of SD phases is very sensitive to MA temperature and time for the alnico composition in this study. A structure formed by uniformly spaced, (diameter), faceted rods in a matrix can only be achieved for a narrow MA temperature range (), and within limited MA time (), resulting in suitable magnetic properties, similar to commercial magnets of this type. The external magnetic field aids the formation of a well-faceted mosaic structure only at the optimal temperature (). MA at different temperatures causes elongation of the phase as well, which improves of alnico, but has no obvious effect on . Low temperature drawing can further increase the alloy’s coercivity by modifying local chemistry in the and phases and their interfaces, without substantially changing the rod diameter and spacing.
Acknowledgments
Research was supported by U.S. DOE, Office of Energy Efficiency and Renewable Energy (EERE), under its Vehicle Technologies Office, Electric Drive Technology Program, through the Ames Laboratory, Iowa State University under contract DE-AC02-07CH11358. APT research was conducted as part of a user project at ORNL’s Center for Nanophase Materials Sciences (CNMS), which is a DOE Office of Science User Facility.
References
References
- McCallum et al. [2014] R. McCallum, L. Lewis, R. Skomski, M. Kramer, I. Anderson, Practical aspects of modern and future permanent magnets, Annual Review of Materials Research 44 (2014) 451–477.
- Kramer et al. [2012] M. Kramer, R. McCallum, I. Anderson, S. Constantinides, Prospects for non-rare earth permanent magnets for traction motors and generators, JOM Journal of the Minerals, Metals and Materials Society 64 (2012) 752–763.
- Anderson et al. [2015] I. E. Anderson, A. G. Kassen, E. M. H. White, L. Zhou, W. Tang, A. Palasyuk, K. W. Dennis, R. W. McCallum, M. J. Kramer, Novel pre-alloyed powder processing of modified alnico 8: Correlation of microstructure and magnetic properties, Journal of Applied Physics 117 (2015) 17D138.
- Zhou et al. [2014] L. Zhou, M. Miller, P. Lu, L. Ke, R. Skomski, H. Dillon, Q. Xing, A. Palasyuk, M. McCartney, D. Smith, S. Constantinides, R. McCallum, I. Anderson, V. Antropov, M. Kramer, Architecture and magnetism of alnico, Acta Materialia 74 (2014) 224–233.
- Matutes-Aquino et al. [1999] J. A. Matutes-Aquino, C. Domínguez Ríos, M. Miki Yoshida, O. Ayala Valenzuela, Magnetic properties and microstructure of the alnico 8, in: Magnetism, Magnetic Materials and their Applications, volume 302 of Materials Science Forum, Trans Tech Publications, 1999, pp. 329–333.
- Zeng et al. [2002] H. Zeng, R. Skomski, L. Menon, Y. Liu, S. Bandyopadhyay, D. J. Sellmyer, Structure and magnetic properties of ferromagnetic nanowires in self-assembled arrays, Phys. Rev. B 65 (2002) 134426.
- Skomski et al. [2010] R. Skomski, Y. Liu, J. E. Shield, G. C. Hadjipanayis, D. J. Sellmyer, Permanent magnetism of dense-packed nanostructures, Journal of Applied Physics 107 (2010) 09A739.
- McCurrie [1982] R. McCurrie, Chapter 3 the structure and properties of alnico permanent magnet alloys, volume 3 of Handbook of Ferromagnetic Materials, Elsevier, 1982, pp. 107–188.
- Szymura et al. [1975] S. Szymura, B. Wyslocki, J. Bailon, Effect of treatment on the domain structures and magnetic properties of alnico alloys, Acta Phys. Polon. (1975) 177–181.
- Sergeyev and Bulygina [1970] V. Sergeyev, T. Bulygina, Magnetic properties of alnico 5 and alnico 8 phases at the sequential stages of heat treatment in a field, Magnetics, IEEE Transactions on 6 (1970) 194–198.
- Sergeyev and Bulygina [1969] V. Sergeyev, T. Bulygina, Magnetic properties of alnico alloy phases and temperature instability of permanent magnets, Journal of Applied Physics 40 (1969) 1307–1307.
- Iwama and Takeuchi [1974] Y. Iwama, M. Takeuchi, Spinodal decomposition in alnico 8 magnet alloy, Transactions of the Japan Institute of Metals 15 (1974) 371–377.
- Iwama et al. [1970] Y. Iwama, M. Inagaki, T. Miyamoto, Effects of titanium in alnico 8-type magnet alloys, Transactions of the Japan Institute of Metals 11 (1970) 268–274.
- Iwama [1967] Y. Iwama, Magnetic properties of alnico-type magnet alloys at elevated temperatures, Transactions of the Japan Institute of Metals 8 (1967) 18–25.
- Tang et al. [2015] W. Tang, L. Zhou, A. G. Kassen, A. Palasyuk, E. M. White, K. W. Dennis, M. J. Kramer, R. W. McCallum, I. E. Anderson, New alnico magnets fabricated from pre-alloyed gas-atomized powder through diverse consolidation techniques, IEEE Transactions on Magnetics 51 (2015) 1–3.
- Thompson et al. [2007] K. Thompson, D. Lawrence, D. Larson, J. Olson, T. Kelly, B. Gorman, In situ site-specific specimen preparation for atom probe tomography, Ultramicroscopy 107 (2007) 131–139.
- Miller and Russell [2007] M. K. Miller, K. F. Russell, Performance of a local electrode atom probe, Surface and Interface Analysis 39 (2007) 262–267.
- Guo et al. [2016] W. Guo, D. A. Garfinkel, J. D. Tucker, D. Haley, G. A. Young, J. D. Poplawsky, An atom probe perspective on phase separation and precipitation in duplex stainless steels, Nanotechnology 27 (2016) 254004.
- Williams and Carter [1996] D. B. Williams, C. B. Carter, The Transmission Electron Microscope, Springer US, Boston, MA, 1996, pp. 3–17.
- Guo et al. [2016] W. Guo, B. T. Sneed, L. Zhou, W. Tang, M. J. Kramer, D. A. Cullen, J. D. Poplawsky, Correlative energy-dispersive x-ray spectroscopic tomography and atom probe tomography of the phase separation in an alnico 8 alloy, Microscopy and Microanalysis 22 (2016) 1251–260.
- Laughlin and Soffa [1985] D. E. Laughlin, W. Soffa, Spinodal structures, ASM Handbook 9 (1985) 652–654.
- Cahn [1961] J. W. Cahn, On spinodal decomposition, Acta Metallurgica 9 (1961) 795–801.
- Cahn [1963] J. W. Cahn, Magnetic aging of spinodal alloys, Journal of Applied Physics 34 (1963) 3581–3586.
- Zijlstra [1962] H. Zijlstra, Magnetic annealing of “ticonal” g magnet steel, Z. Angew. Phys. 14 (1962) 251–253.
- Néel [1947] Néel, Compt. rend. 224 (1947) 1488–1550.