11email: bjornemonts@gmail.com 22institutetext: National Radio Astronomy Observatory, 520 Edgemont Road, Charlottesville, VA 22903 33institutetext: Observatorio Astronómico Nacional (OAN), Observatorio de Madrid, Alfonso XII, 3, 28014, Madrid, Spain 44institutetext: Department of Physics, University of Oxford, Keble Road, Oxford, OX1 3RH, UK
Outflows of hot molecular gas in ultra-luminous infra-red galaxies mapped with VLT-SINFONI
We present the detection and morphological characterization of hot molecular gas outflows in nearby ultra-luminous infra-red galaxies (ULIRGs), using the Spectrograph for Integral Field Observations in the Near Infrared (SINFONI) on the Very Large Telescope (VLT). We detect outflows observed in the 2.12m H2 1-0 S(1) line for three out of four ULIRGs that we analyzed, namely IRAS 12112+0305, IRAS 14348-1447, and IRAS 22491-1808. The outflows are mapped on scales of kpc, show typical outflow velocities of 300500 km s-1, and appear to originate from the nuclear region. The outflows comprise hot molecular gas masses of M 68 103 M⊙. Assuming a hot-to-cold molecular gas mass ratio of 6 10-5, as found in nearby luminous infrared galaxies, the total (hot+cold) molecular gas mass in these outflows is expected to be M 1 108 M⊙. This translates into molecular mass outflow rates of Ṁ M⊙ yr-1, which is a factor of a few lower than the star formation rate in these ULIRGs. In addition, most of the outflowing molecular gas does not reach the escape velocity of these merger systems, which implies that the bulk of the outflowing molecular gas is re-distributed within the system and thus remains available for future star formation. The fastest H2 outflow is seen in the Compton-thick AGN of IRAS 14348-1447, reaching a maximum outflow velocity of 900 km s-1. Another ULIRG, IRAS 17208-0014, shows asymmetric H2 line profiles different from the outflows seen in the other three ULIRGs. We discuss several alternative explanations for the line asymmetries in this system, including a very gentle galactic wind, internal gas dynamics, low-velocity gas outside the disk, or two superposed gas disks. We do not detect the hot molecular counterpart to the outflow previously detected in CO(2-1) in IRAS 17208-0014, but we note that our SINFONI data are not sensitive enough to detect this outflow if it has a small hot-to-cold molecular gas mass ratio of 9 10-6.
Key Words.:
Galaxies: interactions — Galaxies: individual: IRAS 12112+0305 — Galaxies: individual: IRAS 14348-1447 — Galaxies: individual: IRAS 22491-1808 — Galaxies: individual: IRAS 17208-0014 — ISM: jets and outflows1 Introduction
Ultra-luminous infra-red galaxies (ULIRGs) are dust-enshrouded galaxies with massive starbursts and often a deeply buried active galactic nucleus (AGN), which may have been triggered by a gas-rich galaxy merger (Sanders & Mirabel, 1996). ULIRGs emit the bulk of their radiation at mid- and far-IR wavelengths (), where light from the starburst and AGN is absorbed and re-radiated by dust. While ULIRGs are rare in the nearby Universe and contribute at most a few percent of the infrared emission at low redshifts (Soifer & Neugebauer, 1991), they are major contributors to the star-formation activity of the Universe at high redshifts (e.g., Le Floc’h et al., 2005; Pérez-González et al., 2005; Caputi et al., 2006; Magnelli et al., 2013; Novak et al., 2017). Thus, studying the evolution of ULIRGs at low redshifts, where we can resolve the physical processes that drive these systems, is crucial for understanding the dusty, IR-luminous phase in the evolution of galaxies throughout the Universe.
A crucial aspect in the evolution of ULIRGs has been the discovery of massive gas outflows driven by starburst or AGN activity. These outflows have been extensively studied in both ionized and neutral gas (e.g., Heckman et al., 1990; Lehnert & Heckman, 1996; Rupke & Veilleux, 2011; Westmoquette et al., 2012; Bellocchi et al., 2013; Rupke & Veilleux, 2013a, 2015; Morganti et al., 2013; Rodríguez Zaurín et al., 2013; Feruglio et al., 2015; Arribas et al., 2014; Cazzoli et al., 2014; Cazzoli et al., 2016). With the discovery of outflows of neutral gas also came the realization that the mass, momentum, and energy of galactic winds and AGN-driven outflows are much higher in the neutral than in the ionized phase (Morganti et al., 2005; Emonts et al., 2005; Rupke & Veilleux, 2013a; Mahony et al., 2013). However, the full impact of outflows in ULIRGs has only been revealed with the discovery of massive outflows of molecular gas.
Molecular hydrogen is the raw fuel for star formation, and studies have revealed that molecular outflows can halt star formation, at least in the central regions of ULIRGs. These studies focused on the coldest phase of molecular outflows, by using strong tracers like CO and OH 119m (e.g., Feruglio et al., 2010, 2015; Fischer et al., 2010; Chung et al., 2011; Sturm et al., 2011; Spoon et al., 2013; Veilleux et al., 2013; Dasyra & Combes, 2012; Dasyra et al., 2014; Cicone et al., 2014; Sakamoto et al., 2014; García-Burillo et al., 2015; Aalto et al., 2015; Pereira-Santaella et al., 2016; González-Alfonso et al., 2017). Direct measurements of molecular hydrogen in outflows rely on detecting warm and hot H2 emission in the mid- to near-IR (e.g., Valentijn & van der Werf, 1999; Ogle et al., 2010; Dasyra & Combes, 2011; Guillard et al., 2012). Because these H2 lines are relatively weak compared to CO, studies of H2 outflows are limited to low redshift galaxies (e.g., van der Werf et al., 1993; Tadhunter et al., 2014; Hill & Zakamska, 2014), and only few studies exist that provide information on the geometry of spatially extended H2 outflows (Rupke & Veilleux, 2013b; Emonts et al., 2014; Dasyra et al., 2015; Pereira-Santaella et al., 2016). However, the detection of H2 in massive galaxies at with the Spitzer Space Telescope shows the potential for studying the hot molecular Universe with the James Webb Space Telescope (JWST) (Ogle et al., 2012; Guillard et al., 2015).
In this paper, we study the complex kinematics of the hot molecular H2 gas in a sample of four nearby ULIRGs (). By performing a multi-Gaussian decomposition of the 2.1218 m H2 1-0S(1) line, we discovered that three of these systems show evidence for an outflow of hot molecular gas, which we resolve both spatially and kinematically with sub-kpc scale resolution.
2 Sample and data
We used near-IR data from four ULIRGs at 0.043 0.083 obtained with the Spectrograph for Integral Field Observations in the Near Infrared (SINFONI) on the Very Large Telescope (VLT). These are IRAS 12112+0305, IRAS 14348-1447, IRAS 17208-0014, and IRAS 22491-1808. They are the four closest ULIRGs from a representative sample that was previously published by Piqueras López et al. 2012 (hereafter PL12). Three of the four ULIRGs consist of two galaxies that are in a pre-coalescent stage of the merger, with the individual nuclei still clearly separated by at least several kpc. Therefore, our sample of four ULIRGs consists of seven (merging) galaxies.
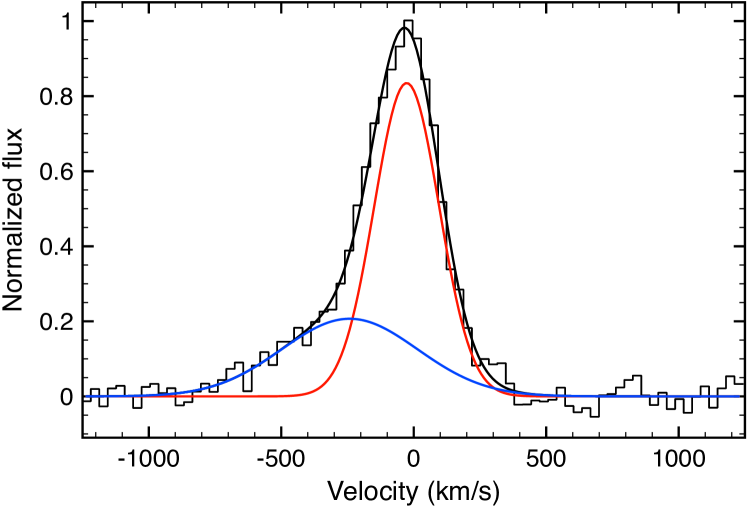
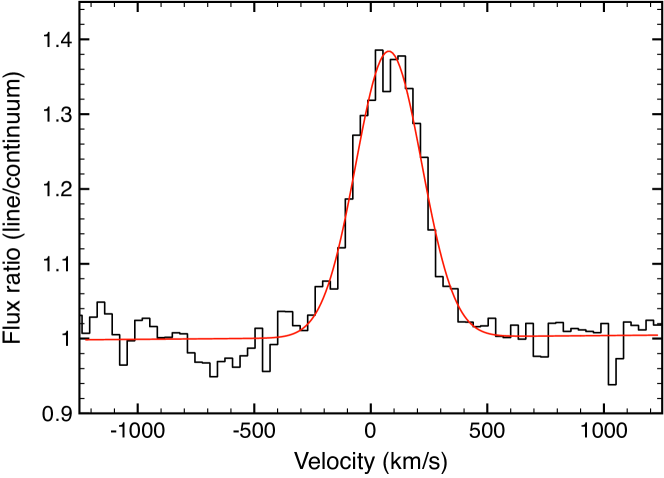
The data were previously presented in PL12 and have a spaxel-size of 0.125′′, seeing of 0.6′′, and dispersion of 2.45 Å pixel-1. The spectral resolution is 6.40.6 Å, which corresponds to 90 8 km s-1 for the H2 1-0 S(1) emission line at 2.1218 m. PL12 fitted a single Gaussian to the spatially resolved H2 1-0 S(1) line to retrieve the global kinematics of the molecular gas. However, in the four ULIRGs that we describe in this paper, the kinematic structure of the hot molecular gas appeared more complex than that. To more accurately derive the gas kinematics, we modified the data analysis routine of PL12 to fit a second Gaussian component to the H2 line profiles of these ULIRGs (Fig. 1). This routine was compiled for the Interactive Data Language (IDL) and uses the MPFIT package for the minimization (Markwardt, 2009). We placed no constraints on the fitting parameters and visually inspected all fits to ensure their validity. For each component we created a flux, velocity, and dispersion map, which were boxcar-smoothed spatially by three pixels.
3 Results
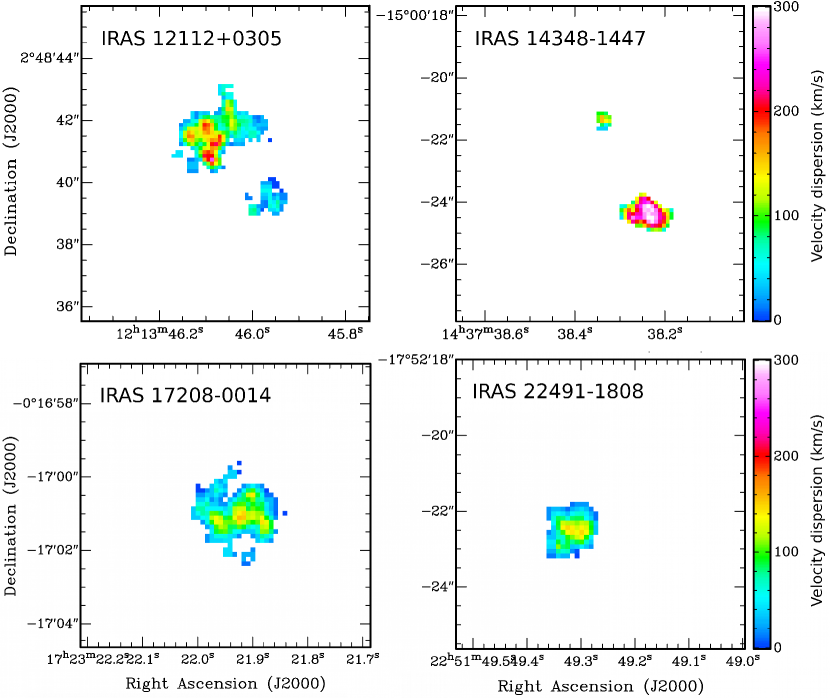
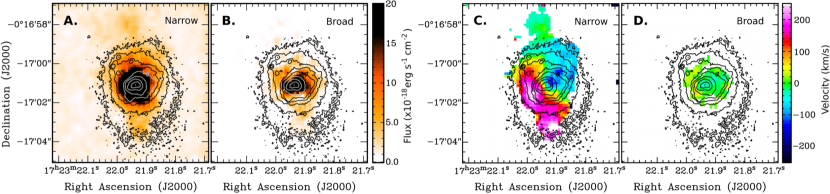
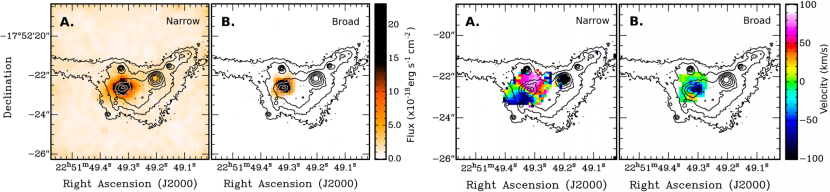
Figures 2 5 show the results of our two-component Gaussian fit to the H2 1-0 S(1) line in IRAS 12112+0305, IRAS 14348-1447, IRAS 17208-0014, and IRAS 22491-1808. In all four ULIRGs, the Gaussian component with the highest peak flux is typically also the narrowest of the two components, with a full width at half the maximum intensity (FWHM) in the range of 180280 km s-1. This component unambiguously traces the gas disk that was previously discussed in these ULIRGs by PL12. We will refer to this primary Gaussian component as the ‘narrow’ component. The secondary Gaussian component reveals emission in the wings of the H2 line profile, and is typically broader and less luminous than the primary disk component. We therefore refer to this secondary Gaussian component as the ‘broad’ component, with the caveat that in those spaxels where this secondary component is weak, it may appear narrower than the primary component. This broad-component emission reveals gas features that were not previously found by the single-component Gaussian approach of PL12. In Appendix A we describe the basic properties of the broad-component emission in each ULIRG.
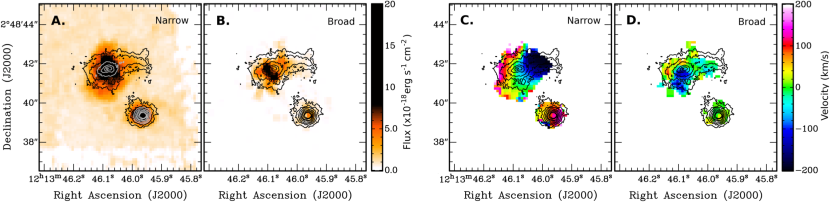
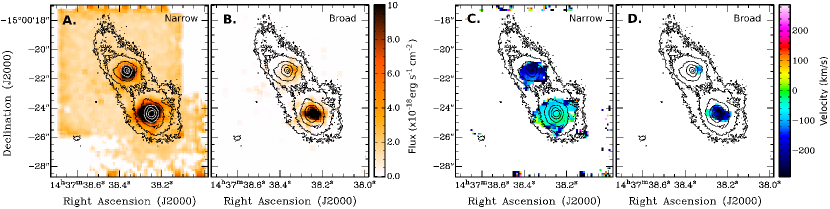
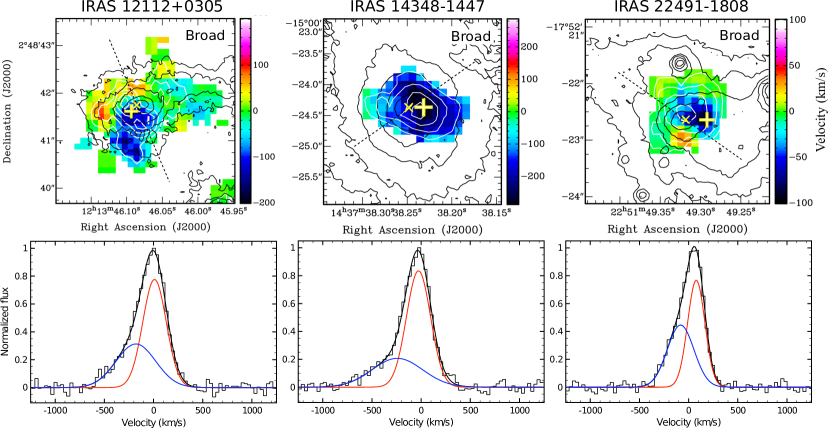
The broad-component emission in the NE galaxy in the IRAS 12112+0305 pair (Fig. 2), the SW galaxy in the IRAS 14348-1447 pair (Fig. 3), and the E galaxy in the IRAS 22491-1808 pair (Fig. 5) is shown in more detail in Fig. 6. We find that in these systems the broad-component gas is decoupled from the narrow-component disk for two reasons: a) at the location of the most blueshifted emission in the maps of Fig. 6, the difference between the peak velocity of the broad and the narrow component in the emission-line profile exceeds the maximum rotational velocity of the narrow-component disk; b) the broad-component gas is blueshifted in the regions where the narrow-component disk is either redshifted or at the systemic velocity. We therefore argue that these three ULIRGs show an outflow of hot molecular H2 gas. The emission-line profiles of the H2 outflows stretch up to a maximum blueshifted velocity at zero intensity of 700 km s-1 for IRAS 12112+0305, 900 km s-1 for IRAS 14348-1447, and 500 km s-1 for IRAS 22491-1808 (Fig. 6). In Sect. 3.1, we will discuss in detail the geometry and mass of the outflows.
As a note of caution, in Appendix B we show that the velocity dispersion of the broad-component emission is significantly lower in IRAS 22491-1808 than it is in IRAS 12112+0305 and IRAS 14348-1447. Although the broad-component emission in IRAS 22491-1808 appears to be an outflow that is de-coupled from the slowly rotating narrow-component disk (Fig. 5), the relatively low velocities imply that future observations with JWST or the Atacama Large Millimeter/submillimeter Array (ALMA) are needed to completely rule out internal gas kinematics playing a role in producing the broad-component emission in IRAS 22491-1808.
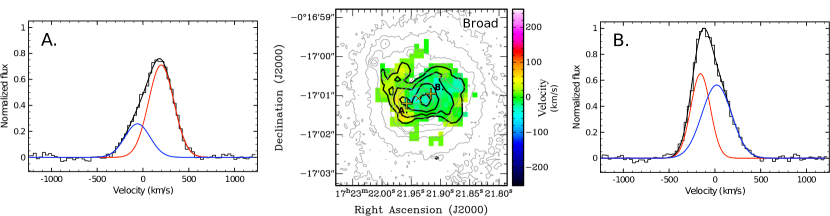
The fourth target in our sample, IRAS 17208-0014, shows broad-component emission that is clearly spatially resolved, but has velocities close to the systemic velocity of the galaxy. The nature of the broad-component emission in IRAS 17208-0014 is far less clear than it is in IRAS 12112+0305, 14348-1447, and 22491-1808. We will discuss IRAS 17208-0014 in detail in Sect. 3.2.
3.1 Physical parameters of the H2 outflows
The outflows that we detect in IRAS 12112+0305, IRAS 14348-1447, and IRAS 22491-1808 (Fig. 6) are resolved both kinematically and spatially, which makes our SINFONI data ideal for further investigating the physical properties of these outflows. Table 1 shows the physical parameters that we derive from our measurements. Errors in the Gaussian fitting procedure, as well as the redshift determination, can affect the measurement of the integrated flux of the broad component and associated mass of the outflow. This is particularly true when the velocity difference between the broad and narrow component is small. Therefore, simply summing up the flux of the broad-component in Figs. 2, 3, and 5 likely provides a firm upper limit on the total flux of the outflows. A conservative lower limit is given by summing the broad-component flux only in those spaxels where the broad and narrow component are clearly separated kinematically. For this, we only take into account the total broad-component line emission in those spaxels where the difference in central peak velocity between the broad and narrow component, as shown in Figs. 2, 3, and 5, is v 100 km s-1. In Table 1, is the average value between the upper- and the lower-limit calculation, with corresponding uncertainties reflecting the difference between the two approaches.
The temperature of the H2 gas in the outflows can in principle be estimated if multiple rovibrational H2 lines are measured (e.g., Davies et al., 2003). In the case of IRAS 12112+0305, IRAS 14348-1447, and IRAS 22491-1808 we cannot determine the H2 temperature from our SINFONI data, because the H2 1-0 S(0) ( = 2.22) and 2-1 S(1) ( = 2.25m) lines are faint and fall in a region of the spectrum that is dominated by strong sky lines. This makes it impossible to derive an accurate flux of the broad-component emission from H2 1-0 S(0) and H2 2-1 S(1).
| 12112+0305 (NE) | 14348-1447 (SW) | 22491-1808 (E) | 17208-0014 | |
|---|---|---|---|---|
| 0.07310 | 0.08300 | 0.07776 | 0.04281 | |
| DL (Mpc) | 336 | 382 | 347 | 189 |
| (10-16 erg s-1 cm-2) | 5.0 2.6 | 6.4 1.5 | 5.8 1.8 | 22 8 |
| v (km s-1) | -190 65 | -215 55 | -160 75 | |
| FWHMnarrow (km s-1)† | 265 20 | 275 15 | 185 25 | 25520 |
| FWHMbroad (km s-1)† | 465 50 | 600 60 | 310 75 | 34040 |
| vmax(broad) (km s-1) | -430 | -520 | -320 | |
| Sizebroad (kpc) | 1.6 (1.0′′) | 0.9 (0.5′′) | 0.7 (0.4′′) | 1.9 (2.1′′) |
| M (M⊙) | (6.83.7) 103 | (8.42.2) 103 | (5.91.9) 103 | (7.5 2.7) 103 |
| Ṁ (M⊙ yr-1)‡ | 30 | 85 | 45 |
3.1.1 Geometry and kinematics of the outflows
The measured size of the outflow region in IRAS 12112+0305, IRAS 14348-1447, and IRAS 22491-1808 ranges from 0.7 1.6 kpc. These are strict lower limits, given that we do not know, and thus do not corrrect for, the inclination of the outflow. The outflows do not extend across the entire area of the narrow-component disk. In fact, their morphologies suggest that the outflows originate from the nuclear region (see Sect. A for details).
Figure 6 suggests that the outflows in IRAS 12112+0305 and IRAS 22491-1808 appear to be aligned somewhat closer to the minor than to the major axis of the galaxies, although not to such an extent that we draw any firm conclusions from this. For IRAS 14348-1447, the galaxy appears to be oriented close to face-on, while the high radial velocity and small spatial extent of the outflow likely indicate that the gas is flowing mostly along our line of sight. For all three ULIRGs, the outflow velocity reaches a maximum at roughly 0.5 kpc distance from the core. These properties are similar to those of the conical, nuclear H2 outflow that was first imaged with near-IR integral-field spectroscopy in QSO F08572+3915 (Rupke & Veilleux, 2013b).
The velocity FWHM of the broad-component emission in the outflows is roughly twice that of the narrow-component emission in the disk. In part, this may be related to a backflow of gas, or to the fact that the opening angle of the outflowing gas causes a superposition of radial velocities along our line of sight. However, in particular in the case of IRAS 12112+0305, the conical outflow appears to have a modest opening angle of 40∘ (Sect. A). It is therefore more likely that the turbulence of the H2 gas in the outflow is higher than that in the narrow-component disk. With a 2 larger FWHM, the turbulent kinetic energy of the gas in the outflow, ( = FWHM/2.35), is up to a factor of four higher than that of the gas in the disk.
3.1.2 H2 mass of the outflows
To estimate the mass of the hot molecular gas that is locked up in the broad-component emission, we follow Scoville et al. (1982) and Mazzalay et al. (2013):
| (1) |
where M is the hot molecular H2 mass in M⊙, DL is the luminosity distance to the galaxy, and A2.2μm is the extinction at 2.2m. In this case, we substitute for the flux of the broad component ( in Table 1). This approach assumes thermalized gas conditions and T = 2000 K, with a population fraction in the () = (1,3) level of . If a fraction of the H2 gas was sub-thermally excited, would be lower and Equation 1 would thus give a lower limit to the H2 mass. Following Piqueras López et al. (2013), A AV, with AV the visual extinction, based on the extinction law described by Calzetti et al. (2000) (see also, e.g., Rieke & Lebofsky, 1985; Fitzpatrick, 1999; Indebetouw et al., 2005). Because the broad-component H2 emission is resolved on scales of a few kpc, we use AV,R(eff) from Piqueras López et al. (2013), which is the visual extinction within the effective radius of the H emission (Arribas et al., 2012). We note, however, that this implicitly assumes that the extinction in the outflow is similar to that inferred from the overall (narrow+broad component) H2 gas in this region.
Based on Equation 1, the broad-component emission in IRAS 12112+0305, IRAS 14348-1447, and IRAS 22491-1808 represents outflows of hot molecular gas with masses of MH2(hot) 68 103 M⊙ (Table 1). The total mass of the outflowing molecular gas consists of a hot and cold component. Recently, we derived hot-to-cold molecular gas mass ratios of 67 10-5 for H2 outflows in two nearby luminous infra-red galaxies (LIRGs; 1011 1012 ), by comparing SINFONI and ALMA data (Emonts et al., 2014; Pereira-Santaella et al., 2016). The most prominent of these two outflows, in the LIRG NGC 3256, has a hot molecular gas mass of 1200 M⊙, which is roughly a factor of six lower than what we observe in our ULIRGs. If we assume a similar hot-to-cold molecular gas mass ratio of 6 10-5, then the total molecular gas masses involved in the ULIRG outflows are of the order of MH2 1 108 M⊙. This corresponds to mass outflow rates of Ṁ = 3085 tan(i) M⊙ yr-1, where Routflow is the size of the outflow region, vmax the maximum outflow velocity (Table 1), and i the line-of-sight inclination.111Because we do not know the inclination of these systems, we will ignore the inclination effects in the remainder of this paper. Upcoming CO observations in the millimeter regime will be able to confirm these estimates.
3.2 IRAS 17208-0014
IRAS 17208-0014 shows broad-component emission that is clearly spatially resolved, but shows little kinematic structure. The overall H2 kinematics in IRAS 17208-0014 appear to follow the CO(2-1) kinematics of cold molecular gas discussed in detail by García-Burillo et al. (2015). We argue that it is unlikely that the broad-component H2 emission represents an outflow similar to what we see in IRAS 12112+0305, IRAS 14348-1447, and IRAS 22491-1808. The reason is that the broad-component gas in IRAS 17208-0014 has a velocity that is close to the systemic velocity across the narrow-component disk. Moreover, the broad-component emission is spread across a large fraction of the narrow-component disk. Therefore, if this broad-component emission represents an outflow, it would have to be gentle and widespread, reminiscent of a galactic wind with very low radial velocity. It is interesting to note that a widespread outflow of neutral gas has been reported in Na D absorption across several kpc (Martin, 2006; Rupke & Veilleux, 2013a). To the contrary, there is no observational evidence for a similar widespread outflow in the ionized gas phase (e.g., Arribas Colina 2003, Westmoquette et al. 2012, Rupke & Veilleux 2013a; see Sect. A.3).
However, it is good to keep in mind that the broad-component emission is separated from the narrow-component emission as a result of our Gaussian fitting procedure. In fact, in the central kpc-scale region, the morphology of the broad-component emission seems to resemble the structure seen with the Near Infrared Camera and Multi-Object Spectrometer (NICMOS) on the Hubble Space Telescope (HST), while fainter broad-component emission further out shows tentative indications for a spiral-like morphology (Figs. 4 and 7). It is therefore possible that the broad-component emission is merely a low-velocity wing to the narrow-component gas, perhaps representing internal gas dynamics or gas falling into the center of the galaxy. Alternatively, the broad-component H2 emission could present low-velocity gas outside the galaxy disk, which was previously deposited through a galactic-scale outflow and possibly mixed with low-angular-momentum gas from the halo (see, e.g., Fraternali & Binney, 2006). Similar low-velocity gas has been seen outside the disks of nearby galaxies in neutral hydrogen gas (e.g., Boomsma et al. 2005, Oosterloo et al. 2007), and bears resemblance to the low-velocity Na D component seen in the LIRG IRAS F11506-3851 by Cazzoli et al. (2014). Finally, Medling et al. (2014) argue that the core of IRAS 17208-0014 consists of two close nuclei separated by 200 pc. It is interesting to speculate that the narrow- and broad-component emission result from two superposed gas disks. Based on Fig. 4, the dominant narrow-component disk would be substantially inclined. To the contrary, the lack of line-of-sight kinematics among the broad-component emission indicates that this would represent a face-on disk with a size of at least 2 kpc and possible spiral-type morphology. While the nature of the broad-component emission in IRAS 17208-0014 remains unclear, detailed observations with ALMA or JWST will be able to discern between the different scenarios.
3.2.1 Upper limit on the H2 outflow in IRAS 17208-0014
García-Burillo et al. (2015) also discovered a faint, blueshifted CO(2-1) outflow in IRAS 17208-0014. Figure 8 shows the H2 1-0 S(1) spectrum extracted across a circular aperture with an area of 13 spaxels at the location where the CO outflow was found. We do not detect an H2 counterpart to this CO outflow in our SINFONI data. Figure 8 shows that any potential outflow is buried well within the noise, and affected by features within the near-IR continuum. The CO outflow stretches roughly from -500 to -700 km s-1, which is outside the line profile of the narrow-component H2 1-0 S(1) emission that we observe with SINFONI (Fig. 7). Our SINFONI data show an rms noise level of 8 10-16 erg s-1 cm-2 m-1 per 0.125′′ spaxel and per 2.45Å (35 km s-1) resolution element in the dispersion direction. We set a conservative upper limit on the integrated line flux of a spatially unresolved H2 1-0 S(1) outflow across 200 km s-1 by assuming a 10 detection when binning the data across 200 km s-1 (six pixels) in dispersion direction and across the 0.6′′ (18 pixels) seeing-disk in spatial directions. This is equivalent to 1 per raw pixel in the unbinned data for a signal distributed across the seeing-disk and across 200 km s-1. Following Sect. 3.1.2, this results in an upper limit on the outflow in hot molecular H2 gas of MH2-hot 400 M⊙. For comparison, the H2 emission from the shaded region in Fig. 8 only comprises MH2-hot 110 M⊙. Given the underlying near-IR continuum emission, we therefore argue that MH2-hot 400 M⊙ is a conservative upper limit.
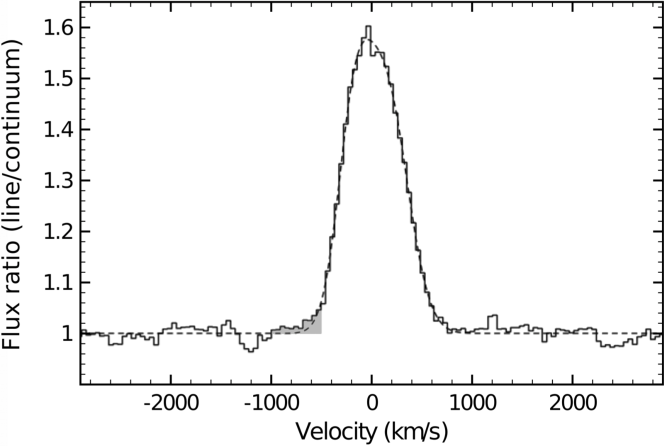
With our assumed hot-to-cold molecular gas mass ratio of 6 10-5 (Sect. 3.1.2), the corresponding upper mass limit on the total (hot+cold) molecular outflow is Moutflow 6.7106 M⊙, which is about a factor of seven lower than the CO outflow of Moutflow 4.6107 M⊙ observed by García-Burillo et al. (2015). To bring both observations into agreement, we would have to put an upper limit on the hot-to-cold molecular gas mass ratio of 9 10-6. This is substantially lower than the hot-to-cold molecular gas mass ratios of 67 10-5 measured directly in the outflows of two nearby LIRGs with SINFONI and ALMA (Emonts et al., 2014; Pereira-Santaella et al., 2016). Nevertheless, it is within the 10-7 10-5 range of generic values previously found by Dale et al. (2005) in samples of starburst galaxies and AGN. Therefore, our SINFONI data are not sensitive enough to either verify or rule out the existence of a hot H2 counterpart to the CO outflow found by García-Burillo et al. (2015).
4 Discussion
We discovered massive outflows of hot molecular H2 gas from three of four nearby ULIRGs (75), namely IRAS 12112 (NE), IRAS 14348 (SW), and IRAS 22491 (E). These three systems are all in a pre-coalescent stage, and for all three we detect an outflow in only one of the two merging galaxies. We therefore detect a hot molecular outflow in three of the seven individual galaxies in our sample (43). However, we stress that our SINFONI data are only sensitive to tracing molecular gas outflows of M 108 M⊙ with outflow velocities vmax several 100 km s-1 (Table 1). For example, we lack the sensitivity to trace the hot H2 counterpart to the molecular outflow that was previously discovered in CO in the fourth ULIRG in our sample, IRAS 17208-0014 (García-Burillo et al., 2015, see Sect. 3.2.1). Sensitive near-IR integral-field spectroscopy of larger samples of ULIRGs is needed to derive meaningful conclusions about the detection rate of hot molecular H2 outflows in ULIRGs.
4.1 Link to starburst/AGN activity
IRAS 12112+0305, IRAS 14348-1447, IRAS 17208-0014, and IRAS 22491-1808 all have a prominent starburst component. Their nuclei are all radio-quiet, and have been classified as either low ionization nuclear emission-line regions (LINERs) or starburst/H II regions (e.g., Veilleux et al., 1999; Franceschini et al., 2003; Nardini et al., 2010). From high-resolution IR spectroscopy, Alonso-Herrero et al. (2016) show that IRAS 14348-1447 and IRAS 17208-0014 contain a faint AGN at mid-IR wavelengths.
However, X-ray observations classify the SW nucleus of IRAS 14348-1447 as a Compton-thick AGN candidate (Iwasawa et al., 2011). Previous work revealed that ionized and molecular gas outflows are on average faster and more massive in the presence of an AGN (Spoon et al., 2013; Arribas et al., 2014; Cicone et al., 2014; Hill & Zakamska, 2014, see also models by Narayanan et al. 2008). The fact that IRAS 14348-1447 (SW) shows the fastest mass outflow among our sample sources is in agreement with this previous work, and suggests that the H2 outflow in IRAS 14348-1447 is driven by the Compton-thick AGN.
The energetics in IRAS 14348-1447 are also consistent with this scenario. Iwasawa et al. (2011) estimate that the X-ray luminosity of the SW galaxy of IRAS 14348-1447 is 5.4 1041 erg s-1. Following Elvis et al. (1994) and Ho (2008), the expected bolometric output of the AGN is roughly 20 , or 1.11043 erg s-1. The H2 outflow has a bulk flow of 200 km s-1, which means that it has taken roughly 5 106 yr for the flow to reach 1 kpc distance (Table 1). In 5 106 yr, the estimated energy output of the Compthon thick AGN is EAGN 1.7 1057 erg. This is likely a lower limit, given that the 0.510 keV emission could be heavily absorbed. The total (bulk + turbulent) kinetic energy of the outflow is = 3.4 0.9 1056 erg (following Table 1). This is a strict lower limit, given that the inclination is likely to be large. Nevertheless, the energy output of the Compton-thick AGN appears to be sufficient to drive the outflow in IRAS 14348-1447.
4.2 Effect on galaxy evolution
Based on spectral energy distributions from the ultra-violet to far-infrared, da Cunha et al. (2010) derive stellar masses of 2.2, 13.5, and 4.2 1010 M⊙ for IRAS 12112+0305, IRAS 17208-0014, and IRAS 22491-1808, respectively. Assuming that this stellar mass is distributed equally between the merging galaxies in each ULIRG, the escape velocity at 2 kpc distance from the galaxy ranges from 220 km s-1 for IRAS 12112+0305 (NE) to 300 km s-1 for IRAS 22491-1808 (E). Arribas et al. (2014) instead derive dynamical masses of 4.6, 7.4, 2.1, and 3.4 1010 M⊙ for IRAS 12112+0305, IRAS 14348-1447, IRAS 17208-0014, and IRAS 22491-1808, respectively. Following Equation 7 of Arribas et al. (2014), assuming r = 2 kpc and an isothermal sphere with truncation radio rmax = 20 kpc, this results in vesc 465, 590, and 400 for the merging ULIRGs IRAS 12112+0305, 14348, and 22491-1808, respectively. Therefore, while a small fraction of the outflowing molecular gas may escape the ULIRGs, the bulk of the outflowing molecular gas in IRAS 12112-0305 and IRAS 14348-1447, and possibly all of it in IRAS 22491-1808, will remain bound to the merging system. The outflows that we observe will therefore mainly re-distribute the gas within the ULIRGs, which may contribute to the dynamical processes that delay the formation of stars. However, the molecular gas itself will remain available within the system to fuel future star formation.
Moreover, Evans et al. (2002) and García-Marín et al. (2009) derive star formation rates of the order of 200 400 M⊙ yr-1 for IRAS 12112-0305 and IRAS 14348-1447, based on infrared, radio, and H observations. Our estimated molecular outflow rates of Ṁ 30 85 M⊙ yr-1 are at least a factor of a few lower than the star formation rates. This suggests that the effects that the molecular outflow have on delaying star formation are rather modest.
4.3 Multi-phase gas outflows
Multi-phase gas outflows, down to the lowest temperatures of molecular gas, can be an important aspect in the evolution of ULIRGs. A demonstration of this are the detailed studies done on the nearby quasar-type ULIRG MRK 231 (e.g., Rupke & Veilleux, 2011; Aalto et al., 2015; Alatalo, 2015; Feruglio et al., 2015; Morganti et al., 2016; Veilleux et al., 2016). Such multi-phase gas outflows are likely to have cold, dense clouds entrained and accelerated by a flow of warm and hot gas (e.g., Wagner et al., 2012; Zubovas & King, 2014). A clumpy outflow of cold molecular gas was recently observed with ALMA in the LIRG IRAS F11506-3851, where CO-emitting clouds with sizes between 60 and 150 pc are part of a multi-phase outflow (Pereira-Santaella et al., 2016).
The best studied phase of outflows is the ionized gas phase, as traced by optical emission lines. While a detailed discussion of ionized outflows is beyond the scope of this paper, it is interesting to note that among a large sample of nearby LIRGs and ULIRGs, Arribas et al. (2014) found that outflows are nearly ubiquitous in (U)LIRGs. The outflow velocities that they observe are similar to what we detect in H2 in our small sample of ULIRGs, while also the ionized gas outflows do not reach the escape velocity in all but the least massive systems (Arribas et al., 2014).
Considering the molecular gas, the nearby LIRG NGC 3256 was the first galaxy where we imaged a bi-conical molecular outflow both in the hot and cold molecular phase at 100 pc resolution (Emonts et al., 2014, see also Sakamoto et al. 2014). The hot and cold components share a similar morphology and kinematics, which suggests that the hot and cold phase trace the same gas features. In NGC 3256 we derived a hot-to-cold molecular gas mass ratio of 6 10-5, which is similar to that found in another nearby LIRG (Pereira-Santaella et al., 2016). The total molecular mass outflow rate of at least Ṁ 20 M⊙ yr-1 in the LIRG NGC 3256 is similar to that of the H2 outflows that we identified in the ULIRGs studied in this paper.
On the other hand, Cicone et al. (2014) studied molecular outflows through observations of CO in a sample of nearby ULIRGs. They find the presence of molecular outflows with mass outflow rates of several 100 M⊙ yr-1, which are similar or larger than the star formation rates in these systems. For the ULIRGs that we study in this paper, we derive outflow rates of molecular gas that are a factor of a few lower than the star formation rates (Sect. 4.1). Therefore, our H2 results appear at odds with the CO results from Cicone et al. (2014). Of course, the H2 2.12m line only traces a small fraction of the total molecular gas mass, and its strength is subject to the local gas temperature and excitation (see, e.g., Rigopoulou et al., 2002). Complementary CO or mid-IR H2 observations of our sample sources are needed to further investigate the hot-to-cold molecular gas mass ratio.
Some of the most spectacular molecular gas outflows in ULIRGs have been detected with the Herschel Space Observatory in the OH line (e.g., Sturm et al., 2011; Spoon et al., 2013; Veilleux et al., 2013; González-Alfonso et al., 2017). The outflow velocities that we observe in the H2 line with SINFONI are within the range of the OH outflows detected with Herschel. However, the mass outflow rates derived from OH measurements by Sturm et al. (2011) and González-Alfonso et al. (2017) are nearly ubiquitously Ṁ 100 M⊙ yr-1. Our SINFONI data suggest also here that either molecular outflow rates in nearby ULIRGs are much more moderate than predicted based on OH studies, or that our assumed hot-to-cold gas mass ratio for H2 outflows in ULIRGs is too large. Alternatively, the OH studies may trace faster outflows that originate closer to the galaxy core, with higher vmax and smaller Routflow. González-Alfonso et al. (2017) indeed found evidence for higher maximum outflow velocities seen in OH compared to CO in several nearby ULIRGs. According to González-Alfonso et al. (2017), this could suggest that OH and CO trace outflows in different regions of the galaxy. After all, they argue that as the outflowing gas expands and breaks up into clumps, it will “cover a decreasing fraction of the far-IR continuum”. Unlike the CO, the OH molecules are radiatively excited, and hence “produce lower absorption and emission” the further out the gas flows (González-Alfonso et al., 2017). This scenario may also explain the fact that the molecular mass outflow rates that we derive from H2 appear on average lower than those based on OH studies.
Our results suggest that consensus has yet to be reached on how effective molecular gas outflows are in influencing the star formation properties of nearby ULIRGs. We argue that detailed 3D-imaging of the different gas phases is a valuable tool to help determine the evolutionary role of multi-phase gas ouflow in the evolution of these IR-luminous galaxies.
5 Conclusions
We presented the detection and characterization of massive outflows of hot molecular gas in three out of four nearby ULIRGs. We imaged the molecular outflows at sub-kpc resolution with VLT-SINFONI, using the H2 1-0 S(1) 2.12m line. We derive the following conclusions:
The H2 outflows spread from the nuclear region out to scales of 0.71.6 kpc;
The H2 outflows contain a hot molecular gas mass of MH2(hot) 68 103 M⊙. Assuming a hot-to-cold H2 ratio of 6 10-5, as previously found in outflows from LIRGs, this corresponds to total molecular gas masses of MH2 108 M⊙;
The corresponding total mass outflow rates of molecular gas are ṀH2 3085 M⊙ yr-1, which is a factor of five to ten lower than the star formation rates in these systems;
The typical outflow velocities range from 300 500 km s-1, which suggests that a large fraction of outflowing gas remains gravitationally bound and is merely re-distributed within the ULIRGs;
The fastest outflow is associated with the Compton-thick AGN candidate IRAS 14348-1447, with a velocity-wing in the emission-line profile that stretches out to 900 km s-1 at zero intensity.
We do not find convincing evidence that the molecular outflows that we discovered in the H2 2.12m line in three of the nearest ULIRGs dramatically change the evolution of these systems. Future studies with JWST and ALMA will provide the sensitivity to further investigate how common and how destructive molecular outflows are in ULIRGs throughout the Universe.
Acknowledgements.
We thank the anonymous referee for valuable feedback that helped improve the paper. The research leading to these results was funded by the Spanish Ministerio de Economía y Competitividad (MINECO) under grants AYA2012-32295, ESP2015-68964-P, AYA2016-76682-C3-2-P, and AYA2015-54346-C2-1-P. Based on observations collected at the European Organisation for Astronomical Research in the Southern Hemisphere, Chile, progs. 077.B-0151A and 081.B-0042A. Based on observations made with the NASA/ESA Hubble Space Telescope, and obtained from the Hubble Legacy Archive, which is a collaboration between the Space Telescope Science Institute (STScI/NASA), the Space Telescope European Coordinating Facility (ST-ECF/ESA), and the Canadian Astronomy Data Centre (CADC/NRC/CSA). The National Radio Astronomy Observatory is a facility of the National Science Foundation operated under cooperative agreement by Associated Universities, Inc.References
- Aalto et al. (2015) Aalto S., Garcia-Burillo S., Muller S., et al., 2015, AA, 574, A85
- Alatalo (2015) Alatalo K., 2015, ApJL, 801, L17
- Alonso-Herrero et al. (2016) Alonso-Herrero, A., Poulton, R., Roche, P. F., et al. 2016, MNRAS, 463, 2405
- Arribas Colina (2003) Arribas, S., & Colina, L. 2003, ApJ, 591, 791
- Arribas et al. (2012) Arribas S., Colina L., Alonso-Herrero A., et al., 2012, AA, 541, A20
- Arribas et al. (2014) Arribas S., Colina L., Bellocchi E., Maiolino R., Villar-Martin M., 2014, AA, 568, 14
- Bellocchi et al. (2013) Bellocchi E., Arribas S., Colina L., Miralles-Caballero D., 2013, AA, 557, A59
- Boomsma et al. (2005) Boomsma, R., Oosterloo, T. A., Fraternali, F., van der Hulst, J. M., & Sancisi, R. 2005, AA, 431, 65
- Calzetti et al. (2000) Calzetti, D., Armus, L., Bohlin, R. C., et al. 2000, ApJ, 533, 682
- Caputi et al. (2006) Caputi, K. I., Dole, H., Lagache, G., et al. 2006, AA, 454, 143
- Cazzoli et al. (2014) Cazzoli S., Arribas S., Colina L., et al., 2014, AA, 569, A14
- Cazzoli et al. (2016) Cazzoli S., Arribas S., Maiolino R., Colina L., 2016, AA, 590, A125
- Chung et al. (2011) Chung A., Yun M. S., Naraynan G., Heyer M., Erickson N. R., 2011, ApJL, 732, L15
- Cicone et al. (2014) Cicone C., Maiolino R., Sturm E., et al., 2014, AA, 562, 21
- da Cunha et al. (2010) da Cunha E., Charmandaris V., Díaz-Santos T., et al., 2010, AA, 523, A78
- Dale et al. (2005) Dale D. A., Sheth K., Helou G., Regan M. W., Hüttemeister S., 2005, AJ, 129, 2197
- Dasyra et al. (2015) Dasyra K. M., Bostrom A. C., Combes F., Vlahakis N., 2015, ApJ, 815, 34
- Dasyra & Combes (2011) Dasyra K. M., Combes F., 2011, AA, 533, L10
- Dasyra & Combes (2012) Dasyra K. M., Combes F., 2012, AA, 541, L7
- Dasyra et al. (2014) Dasyra K. M., Combes F., Novak G. S., et al., 2014, AA, 565, A46
- Davies et al. (2003) Davies, R. I., Sternberg, A., Lehnert, M., & Tacconi-Garman, L. E. 2003, ApJ, 597, 907
- Elvis et al. (1994) Elvis, M., Wilkes, B. J., McDowell, J. C., et al. 1994, ApJS, 95, 1
- Emonts et al. (2005) Emonts, B. H. C., Morganti, R., Tadhunter, C. N., et al. 2005, MNRAS, 362, 931
- Emonts et al. (2014) Emonts B. H. C., Piqueras-López J., Colina L., et al., 2014, AA, 572, A40
- Evans et al. (2002) Evans A. S., Mazzarella J. M., Surace J. A., Sanders D. B., 2002, ApJ, 580, 749
- Feruglio et al. (2015) Feruglio C., Fiore F., Carniani S., et al. 2015, AA, 583, 99
- Feruglio et al. (2010) Feruglio C., Maiolino R., Piconcelli E., et al., 2010, AA, 518, L155
- Fischer et al. (2010) Fischer J., Sturm E., González-Alfonso E., et al., 2010, AA, 518, L41
- Fitzpatrick (1999) Fitzpatrick E. L., 1999, PASP, 111, 63
- Franceschini et al. (2003) Franceschini A., Braito V., Persic M., et al., 2003, MNRAS, 343, 1181
- Fraternali & Binney (2006) Fraternali, F., & Binney, J. J. 2006, MNRAS, 366, 449
- García-Burillo et al. (2015) García-Burillo S., Combes F., Usero A., et al., 2015, AA, 580, A35
- García-Marín et al. (2009) García-Marín M., Colina L., Arribas S., 2009, AA, 505, 1017
- González-Alfonso et al. (2017) González-Alfonso E., Fischer J., Spoon H. W. W., et al. 2017, ApJ, 836, 11
- Guillard et al. (2015) Guillard P., Boulanger F., Lehnert M. D., Appleton P. N., Pineau des Forêts G., 2015, SF2A-2015: Proceedings of the Annual meeting of the French Society of Astronomy and Astrophysics: Warm molecular Hydrogen at high redshift with the James Webb Space Telescope, eds. Martins F., Boissier S., Buat V., Cambrésy L., Petit P., pp 81–85
- Guillard et al. (2012) Guillard P., Ogle P. M., Emonts B. H. C., et al., 2012, ApJ, 747, 95
- Ho (2008) Ho, L. C. 2008, ARAA, 46, 475
- Heckman et al. (1990) Heckman T. M., Armus L., Miley G. K., 1990, ApJS, 74, 833
- Hill & Zakamska (2014) Hill M. J., Zakamska N. L., 2014, MNRAS, 439, 2701
- Indebetouw et al. (2005) Indebetouw R., Mathis J. S., Babler B. L., et al. 2005, ApJ, 619, 931
- Iwasawa et al. (2011) Iwasawa K., Sanders D. B., Teng S. H., et al., 2011, AA, 529, A106
- Le Floc’h et al. (2005) Le Floc’h E., Papovich C., Dole H., et al. 2005, ApJ, 632, 169
- Lehnert & Heckman (1996) Lehnert M. D., Heckman T. M., 1996, ApJ, 462, 651
- Magnelli et al. (2013) Magnelli B., Popesso P., Berta S., et al. 2013, AA, 553, A132
- Mahony et al. (2013) Mahony, E. K., Morganti, R., Emonts, B. H. C., Oosterloo, T. A., & Tadhunter, C. 2013, MNRAS, 435, L58
- Markwardt (2009) Markwardt C. B., 2009, ASP Conf. Ser., Astronomical Data Analysis Software and Systems XVIII, eds. Bohlender D. A., Durand D., Dowler P., 411, 251
- Martin (2006) Martin, C. L. 2006, ApJ, 647, 222
- Mazzalay et al. (2013) Mazzalay X., Saglia R. P., Erwin P., et al., 2013, MNRAS, 428, 2389
- Medling et al. (2014) Medling, A. M., U, V., Guedes, J., et al. 2014, ApJ, 784, 70
- Medling et al. (2015) Medling, A. M., U, V., Rich, J. A., et al. 2015, MNRAS, 448, 2301
- Morganti et al. (2013) Morganti R., Fogasy J., Paragi Z., Oosterloo T., Orienti M., 2013, Science, 341, 1082
- Morganti et al. (2005) Morganti R., Oosterloo T. A., Tadhunter C. N., van Moorsel G., Emonts B., 2005, AA, 439, 521
- Morganti et al. (2016) Morganti R., Veilleux S., Oosterloo T., Teng S. H., Rupke D., 2016, AA, 593, A30
- Narayanan et al. (2008) Narayanan D., Cox T. J., Kelly B., et al., 2008, ApJS, 176, 331
- Nardini et al. (2010) Nardini E., Risaliti G., Watabe Y., Salvati M., Sani E., 2010, MNRAS, 405, 2505
- Novak et al. (2017) Novak, M., Smolcic, V., Delhaize, J., et al. 2017, AA, in press (arXiv:1703.09724)
- Ogle et al. (2010) Ogle P., Boulanger F., Guillard P., et al., 2010, ApJ, 724, 1193
- Ogle et al. (2012) Ogle P., Davies J. E., Appleton P. N., et al., 2012, ApJ, 751, 13
- Oosterloo et al. (2007) Oosterloo, T., Fraternali, F., & Sancisi, R. 2007, AJ, 134, 1019
- Pereira-Santaella et al. (2016) Pereira-Santaella M., Colina L., García-Burillo S., et al. 2016, AA, 594, A81
- Pérez-González et al. (2005) Pérez-González, P. G., Rieke, G. H., Egami, E., et al. 2005, ApJ, 630, 82
- Piqueras López et al. (2013) Piqueras López J., Colina L., Arribas S., Alonso-Herrero A., 2013, AA, 553, A85
- Piqueras López et al. (2012) Piqueras López J., Colina L., Arribas S., Alonso-Herrero A., Bedregal A. G., 2012, AA, 546, A64
- Rieke & Lebofsky (1985) Rieke G. H., Lebofsky M. J., 1985, ApJ, 288, 618
- Rigopoulou et al. (2002) Rigopoulou, D., Kunze, D., Lutz, D., Genzel, R., & Moorwood, A. F. M. 2002, AA, 389, 374
- Rodríguez Zaurín et al. (2013) Rodríguez Zaurín J., Tadhunter C. N., Rose M., Holt J., 2013, MNRAS, 432, 138
- Rupke et al. (2005) Rupke D. S., Veilleux S., Sanders D. B., 2005, ApJS, 160, 115
- Rupke & Veilleux (2011) Rupke D. S. N., Veilleux S., 2011, ApJ, 729, L27
- Rupke & Veilleux (2013a) Rupke D. S. N., Veilleux S., 2013a, ApJ, 768, 75
- Rupke & Veilleux (2013b) Rupke D. S. N., Veilleux S., 2013b, ApJL, 775, L15
- Rupke & Veilleux (2015) Rupke D. S. N., Veilleux S., 2015, ApJ, 801, 126
- Sakamoto et al. (2014) Sakamoto K., Aalto S., Combes F., Evans A., Peck A., 2014, ApJ, 797, 90
- Sanders & Mirabel (1996) Sanders D. B., Mirabel I. F., 1996, ARAA, 34, 749
- Scoville et al. (1982) Scoville N. Z., Hall D. N. B., Ridgway S. T., Kleinmann S. G., 1982, ApJ, 253, 136
- Scoville et al. (2000) Scoville, N. Z., Evans, A. S., Thompson, R., et al. 2000, AJ, 119, 991
- Soifer & Neugebauer (1991) Soifer B. T., Neugebauer G., 1991, AJ, 101, 354
- Soto Martin (2012) Soto, K. T., & Martin, C. L. 2012, ApJS, 203, 3
- Spoon et al. (2013) Spoon H. W. W., Farrah D., Lebouteiller V., et al. 2013, ApJ, 775, 127
- Sturm et al. (2011) Sturm E., González-Alfonso E., Veilleux S., et al. 2011, ApJL, 733, L16
- Tadhunter et al. (2014) Tadhunter C., Morganti R., Rose M., Oonk J. B. R., Oosterloo T., 2014, Nature, 511, 440
- Valentijn & van der Werf (1999) Valentijn E. A., van der Werf P. P., 1999, ApJL, 522, L29
- van der Werf et al. (1993) van der Werf P. P., Genzel R., Krabbe A., et al., 1993, ApJ, 405, 522
- Veilleux et al. (1999) Veilleux S., Kim D.-C., Sanders D. B., 1999, ApJ, 522, 113
- Veilleux et al. (2013) Veilleux S., Melendez M., Sturm E., et al. 2013, ApJ, 776, 27
- Veilleux et al. (2016) Veilleux S., Meléndez M., Tripp T. M., Hamann F., Rupke D. S. N., 2016, ApJ, 825, 42
- Wagner et al. (2012) Wagner, A. Y., Bicknell, G. V., & Umemura, M. 2012, ApJ, 757, 136
- Westmoquette et al. (2012) Westmoquette M. S., Clements D. L., Bendo G. J., Khan S. A., 2012, MNRAS, 424, 416
- Zubovas & King (2014) Zubovas, K., & King, A. R. 2014, MNRAS, 439, 400
Appendix A Individual sources
In the following sections we provide detailed information regarding the broad component H2 emission in IRAS 12112+0305, IRAS 14348-1447, IRAS 17208-0014, and IRAS 22491-1808.
A.1 IRAS 12112+0305
The broad-component emission is seen in the NE galaxy of this galaxy-pair. The broad-component emission is blueshifted and found in the region where the narrow-component disk is redshifted or at the systemic velocity. The broad-component emission appears to originate from the nuclear region, is only seen on one side of the nucleus, and stretches out to 1.6 kpc. The narrow-component disk shows a 0 km s-1 iso-velocity contour, which position angle (PA) changes from PA 0∘ to PA 23∘. We argue that the latter is the most likely PA of the minor axis of the galaxy, given that it is perpendicular to the elongated morphology of the galaxy in the HST/NICMOS imaging (Fig. 6). This means that the outflow spans a cone that is oriented about 1555 degrees off the minor axis. The outflow peaks in intensity and velocity roughly 0.5 kpc from the core. Here the outflow has a bulk velocity of 200 km s-1 with respect to the systemic velocity, which it maintains out to a distance of 1.6 kpc. The wing of the broad component stretches out to -700 km s-1 at zero-intensity. Table 1 gives more details. Figure 2 suggests that the SW galaxy of this ULIRG also shows faint broad-component emission, but Fig. 9 clarifies that this merely reflects our uncertainty in the Gaussian fitting procedure due to the underlying strong continuum emission of this source.
A.2 IRAS 14348-1447
The broad-component emission is seen in the SW galaxy of this galaxy-pair, which hosts an AGN that is likely to be Compton-thick (Iwasawa et al., 2011). The broad component shows the most blueshifted emission of the four galaxies in our sample, stretching out to -900 km s-1 at zero-intensity. Previous work showed that gas outflows are on average faster in the presence of an AGN (Spoon et al., 2013; Arribas et al., 2014; Cicone et al., 2014; Hill & Zakamska, 2014, see also models by Narayanan et al. 2008). The fact that this is also the case when comparing IRAS 14348-1447 with the other ULIRGs in our sample strongly suggests that the outflow in IRAS 14348-1447 originates from the nuclear region. The broad component is resolved only marginally in a westerly direction, with a size of 0.9 kpc. However, the fact that the narrow-component emission is close to the systemic velocity throughout the disk suggests that the galaxy disk is aligned close to face-on. This makes our estimated PA-55∘ for the minor axis, as based on the 0 km s-1 iso-velocity contour and HST/NICMOS morphology, rather uncertain. Nevertheless, if the outflow traced by the broad component were aligned along the minor axis of the galaxy, it would mostly propagate along our line of sight, which means that the true extent and velocity of the broad-component emission may be significantly larger. More details are given in Table 1.
A.3 IRAS 17208-0014
IRAS 17208-0014 has been associated with multi-phase gas outflows by various authors (Rupke et al., 2005; Martin, 2006; Sturm et al., 2011; Arribas et al., 2014; Soto Martin, 2012; Medling et al., 2015). However, several integral-field studies did not find evidence for such outflows in the ionized phase (Arribas Colina, 2003; Westmoquette et al., 2012; Rupke & Veilleux, 2013a), and Arribas Colina (2003) even argued the presence of gas inflows. In our SINFONI data, the overall H2 kinematics appear to follow the CO kinematics of cold molecular gas discussed in detail by García-Burillo et al. (2015). The broad-component H2 emission is only seen near the systemic velocity, and spreads across 2 kpc, which is a substantial fraction of the narrow-component disk. In Sect. 3.2, we discuss that this broad-component emission is not likely to be related to an outflow, although its true nature remains unclear.
We do not detect a hot H2 counterpart to the cold molecular outflow previously discovered in CO by García-Burillo et al. (2015). As shown in Sect. 3.2.1, we derive a firm upper limit on the outflow of hot molecular H2 gas of MH2-hot 400 M⊙, which results in a hot-to-cold molecular gas mass ratio of 9 10-6.
A.4 IRAS 22491-1808
The broad-component emission is seen in the E galaxy of this galaxy pair. The broad component is most prominent and blueshifted west of the nucleus. It spans a cone that is aligned roughly 1065∘ off the minor axis of the narrow-component disk, which we estimate has PA50∘, based on the 0 km s-1 iso-velocity contour. A faint redshifted counterpart could be present towards the south, but this needs to be verified. The broad-component emission stretches 0.7 kpc from the nucleus, where it also shows the highest bulk velocities of roughly -100 km s-1 with respect to the systemic velocity. The maximum velocity of the outflow reaches only -500 km s-1 at zero-intensity. Table 1 and Sect. 3 give more details.
Appendix B Velocity dispersion maps