NEOWISE Reactivation Mission Year Three: Asteroid Diameters and Albedos
Abstract
The Near-Earth Object Wide-field Infrared Survey Explorer (NEOWISE) reactivation mission has completed its third year of surveying the sky in the thermal infrared for near-Earth asteroids and comets. NEOWISE collects simultaneous observations at m and m of solar system objects passing through its field of regard. These data allow for the determination of total thermal emission from bodies in the inner solar system, and thus the sizes of these objects. In this paper we present thermal model fits of asteroid diameters for NEOs and MBAs detected during the third year of the survey, as well as the associated optical geometric albedos. We compare our results with previous thermal model results from NEOWISE for overlapping sample sets, as well as diameters determined through other independent methods, and find that our diameter measurements for NEOs agree to within (1-) of previously measured values. Diameters for the MBAs are within (1-). This brings the total number of unique near-Earth objects characterized by the NEOWISE survey to , surpassing the number observed during the fully cryogenic mission in 2010.
1 Introduction
The Near-Earth Object Wide-field Infrared Survey Explorer (NEOWISE) reactivation mission is a NASA Planetary Science-funded survey using an Earth-orbiting infrared telescope to detect and characterize asteroids and comets in our solar system. NEOWISE makes use of the Wide-field Infrared Survey Explorer (WISE) spacecraft, which conducted a 4-band thermal infrared survey of the entire sky from January 2010 until the exhaustion of cryogens in September 2010 (Wright et al., 2010). Over the course of the primary mission, WISE detected over 150,000 asteroids and comets, characterizing their thermal infrared properties and discovering over 30,000 new objects (Mainzer et al., 2011a, c; Masiero et al., 2011; Grav et al., 2011, 2012; Bauer et al., 2013). The mission was continued through February 2011 under the direction of NASA’s Planetary Science Division (Mainzer et al., 2012; Masiero et al., 2012) at which point the telescope was put into hibernation. The telescope was reactivated at the request of NASA’s Planetary Science Division in 2013 to continue searching for new near-Earth objects (NEOs) and to provide thermal infrared characterization of the observed NEOs (Mainzer et al., 2014). Oversight of NEOWISE was assumed by NASA’s Planetary Defense Coordination Office in 2016.
NEOWISE calibrated images and source detection catalog data are released to the public annually through the NASA Infrared Processing and Analysis Center (IPAC) Infrared Science Archive (IRSA111http://irsa.ipac.caltech.edu). Concurrently, the NEOWISE science team has published tables of derived physical properties for the NEOs and Main Belt asteroids (MBAs) observed during that year (see Nugent et al., 2015, 2016, for Year 1 and Year 2 data, respectively). Previously published physical property data (up to NEOWISE Year 1) have been archived in the NASA Planetary Data System (Mainzer et al., 2016); this archive will be updated again at the end of the NEOWISE mission. In this publication, we present our derived physical properties from the NEOWISE Year 3 dataset.
2 Observations and Followup
NEOWISE is in a low-Earth, polar orbit, near the terminator. Since the exhaustion of cryogenic coolant in September 2010 the NEOWISE detectors and telescope have been passively cooled via radiation to deep space. To facilitate this, NEOWISE is limited to pointing at solar elongations larger than , and surveying near zenith to minimize the heat-load from the Earth. During the primary mission zenith pointing coincided with solar elongation; however, as the orbit has precessed in the years following launch the survey strategy has been modified to accommodate these shifts. On the side of the orbit precessing toward the Sun, the telescope is actively pointed to scan at elongation at the expense of additional heat load from the Earth, while on the other side of the orbit the survey continues at zenith, drifting a few degrees from the nominal elongation of . In addition to these long-term changes, NEOWISE conducts toggles of a few degrees during each quarter moon to avoid scanning over the moon and to minimize the impact of lunar scattered light. For more information, refer to the NEOWISE Explanatory Supplement that is updated with each annual data release (Cutri et al., 2015).
The NEOWISE telescope uses beamsplitters and co-aligned detectors to simultaneously image the same area of sky onto two focal plane detectors with sensitivities centered at m and m. Each detector records the incident flux for second exposures, followed by a second slew of the scan mirror that keeps the image stationary on the detectors during exposures. Exposures are separated by seconds, and have a overlap in the scan direction. The nominal survey pattern results in most detections of moving objects being spaced hours apart over a hour period.
NEOWISE conducts a regular search of the survey data stream for known and new moving objects through use of the WISE Moving Object Processing System (WMOPS, Mainzer et al., 2011a). Objects detected in a minimum of 5 exposures are submitted to the IAU’s Minor Planet Center (MPC)222http://www.minorplanetcenter.net for archiving. The majority of objects detected by NEOWISE are recovery observations of known objects linked by the MPC. New objects with potential NEO-like orbits are posted to the MPC’s Near-Earth Object Confirmation Page (NEOCP) for community followup, while new objects only having MBA orbital solutions are archived and await future incidental followup. The latter frequently have short orbital arcs (arcyears) and uncertain orbit solutions, and as such are excluded from physical property analysis.
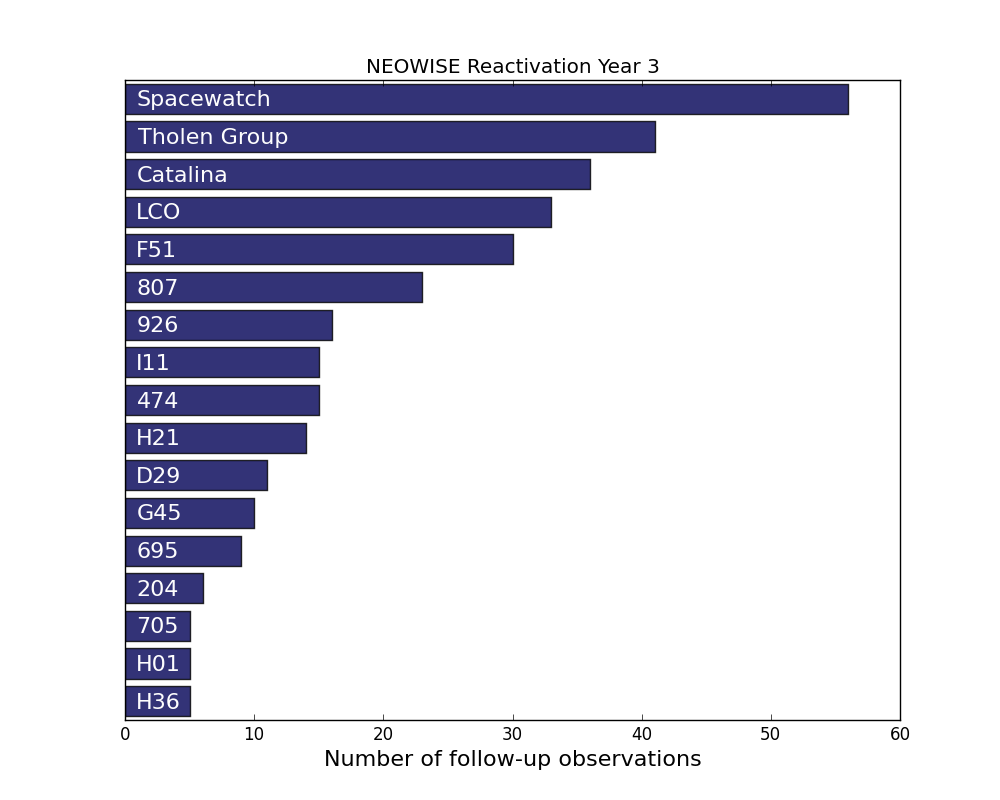
For objects posted to the NEOCP, rapid followup observations from telescopes around the world are critical to confirming the orbit and determining the visible magnitude. In Figure 1 we present a record of the ground-based followup observations of NEOs discovered by the NEOWISE survey in the third year of reactivation. We note that the top seven followup programs are all funded by NASA’s Near-Earth Object Observations program as NEO discovery or followup surveys, while the eighth (code I11) is a Gemini Large and Long Program led by the first author to ensure recovery of faint NEO candidates at southern declinations not observable by followup telescopes in the northern hemisphere.
3 Thermal Modeling Technique
To determine asteroid physical properties from the measured infrared flux values, we perform thermal modeling of the observed bodies using their derived orbital parameters. With our model of the thermal behavior of the surface, we can constrain the diameter of the body by comparing the predicted and measured thermal emission. When optical measurements are available in the literature or from ground-based followup observations we also can constrain the albedo of the body. During the NEOWISE mission only the m and m channels (hereafter W1 and W2) are operational; measurements at these wavelengths can only constrain the Wien side of the blackbody emission, resulting in larger diameter uncertainties than seen for data from the WISE/NEOWISE primary mission when longer wavelength measurements (m and m) were available (c.f. Mainzer et al., 2012; Masiero et al., 2012; Nugent et al., 2015, 2016, and discussion below). These previous publications have detailed our thermal modeling technique, so here we only present a synopsis of our methods, noting procedures that have been updated.
3.1 Data
We extracted all detections from NEOWISE (observatory code C51) recorded in the MPC’s Observations Catalog333http://minorplanetcenter.net/iau/ECS/MPCAT-OBS/MPCAT-OBS.html with observation dates between 13 December 2015 00:00 UT and 12 December 2016 23:59:59 UT. This is done to provide a detection table that has been vetted twice: once by the NEOWISE WMOPS system and a second when linked by the MPC for orbit fitting. WMOPS actively removes stars and galaxies from the input detection list based on real-time stationary detections in the data and the catalogs produced from stacking of the cryogenic mission data. This minimizes the number of incorrect associations or bad detections included in our thermal fitting. These sets of Right Ascension-Declination-Time data are used as input for a search of the NEOWISE Single-exposure detection database hosted by the NASA/IPAC Infrared Science Archive (IRSA).
Although this provides the best input dataset in terms of reliability, it may lack in completeness, particularly for objects near the NEOWISE detection threshold. Objects near this limit that vary in flux due to rotation will only be detected at the brightest points in their light curve. This will result in a potential over-estimation of the diameters for faint objects. For individual objects, it is possible to search the single-exposure database at the predicted position for the object in each frame and recover detections at SNRs below the single-exposure limit of used by WMOPS for automated searches. This more complete data set is critical for thermophysical modeling of objects seen at multiple apparitions (e.g. 2015 QM3; Wright et al. 2017, in prep), but searching for additional low SNR data for all the objects presented here is beyond the scope of this work. However, it is important to recognize the potential bias to larger sizes in our fits of objects near the WMOPS detection limit.
In addition to extracting measured W1 and W2 magnitudes and errors, the IRSA query of the NEOWISE Single-exposure detection database also returns associated sources in the AllWISE 4-band Source Catalog within . This provides an extra level of filtering of static sources beyond what is used by WMOPS. We use these data to remove asteroid detections that may be confused with background astrophysical objects, such as faint stars and galaxies. We remove any detection from our input list that is coincident (within the search radius) to a background object with SNR in either the W1 or W2 bands in the AllWISE Catalog. As the AllWISE detections are made on coadded images of at least 8 Single-exposures this SNR cut corresponds to a flux limit well below the single-exposure SNR of that WMOPS uses in the search for moving objects. However, we set a restriction that the background object can be no more than magnitudes fainter (in the AllWISE detection) than the detection associated with the asteroid; this prevents faint background sources from triggering the loss of valid detections of much brighter solar system objects. Static sources that show extreme brightening between the AllWISE Catalog and the Year 3 observation will not be eliminated by the cut, but these cases are expected to be rare and will not significantly affect the results of our thermal modeling.
In order to mitigate the effects of cosmic rays striking very close to the measured or predicted positions of asteroids in our images, we also restricted the w2rchi2 parameter of the detections to before carrying out our thermal fitting. The parameter measures the goodness-of-fit of the model PSF for each band to the source extracted by the pipeline. The mean value of w2rchi2 for all detections is , and of our detections have (before filtering). W2 is the dominant thermal band in all of our fits, and thus cosmic ray strikes contaminating this band will lead to large errors in diameter. As an example, Main Belt asteroid (9190) was observed twice in Year 3, roughly five months apart. One detection in the second epoch was contaminated by a bright cosmic ray strike, resulting in a spurious thermal model fit an order of magnitude larger than both the other epoch and the diameter reported in Mainzer et al. (2016). This single detection had a , while the remaining detections were all near unity. Because the cosmic ray happened to strike the detector at nearly exactly the location predicted for (9190), it was discarded by neither WMOPS nor the MPC, but is eliminated by our filtering on the w2rchi2 parameter.
To determine the heliocentric and geocentric distances at the time of observation, we use the orbital elements for each object published by the Minor Planet Center. We restrict our input set to objects with orbital arcs longer than years. This is to ensure that the orbit of the object is sufficiently constrained to produce accurate distances. This cut removes NEOs and MBAs from our fitting list. These objects received no optical followup, meaning the day arc of observations from NEOWISE was the only positional data available.
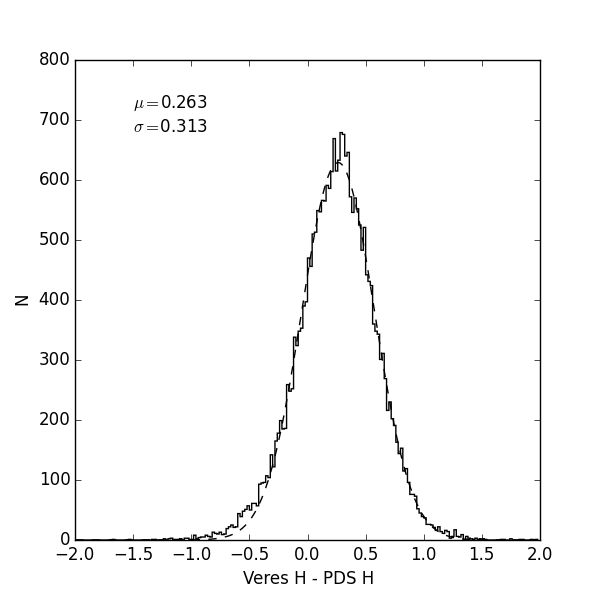
The positions of the spacecraft with respect to Earth for each detection are drawn from the submitted data in the MPC Observations Catalog. Additionally, an estimate of the visible brightness at the time of NEOWISE observations is required to determine a visible-wavelength albedo. We use the absolute magnitude and phase slope parameter to calculate this expected brightness. When available, we use the and values derived from the Pan-STARRS photometric dataset by Vereš et al. (2015) so long as they spanned of phase (a total of objects). Otherwise, we use the and values published in the MPC orbital element file. Pravec et al. (2012) highlighted specific systematic problems with the and determinations for some objects due to improper photometric calibration of some surveys in the past. However recent photometry from calibrated surveys (e.g. Pan-STARRS) has mitigated the majority of these issues.
We note that there is a significant, systematic offset in the absolute magnitude of the asteroids in our sample as reported by Vereš et al. (2015) compared with the values drawn from the MPC used for thermal fitting by previous work (e.g. Masiero et al., 2011). We find an offset of mag for objects previously fit by NEOWISE, as shown in Figure 2, comparable to the mag reported for the total population by Vereš et al. (2015). This offset will result in the predicted visual brightness at the time of NEOWISE observation being lower on average when using the Vereš et al. (2015) values, and thus the calculated visible albedo being comparably lower. We discuss further the effects of this systematic change in below.
We assume an uncertainty of mag for for the Main Belt, and mag for NEOs. The latter is consistent with the observed uncertainty in the MPC orbital catalog as well as typical asteroid rotation amplitudes, however for some well-characterized bodies this over-estimates the uncertainty. Thus we use a smaller assumed error for the Main Belt asteroids as this population is dominated by low-numbered objects. Our fitting routine simultaneously constrains the NEOWISE-measured infrared magnitudes and the visible magnitude by varying the diameter and albedo of the modeled object. As the optical flux has effectively one measurement () and one unknown ( assuming diameter is constrained by the infrared), the majority of fits reproduce the input magnitude exactly. However, for cases where the NEOWISE measurement has a very high SNR in both W1 and W2, the least-squares minimizer can fall into a local minimum where the reflected flux in W1 drives the optical albedo fit to unphysical values. For these cases, which tend to be bright asteroids with well-constrained optical parameters, we assume an error on of mag for the NEOs and mag for the MBAs. This typically succeeds in driving the fit out of the local minimum to the true global best-fit.
3.2 NEATM
We apply the Near Earth Asteroid Thermal Model (NEATM Harris et al., 1998) to a faceted sphere with the same orbital state as the asteroid at the time of observation. In order to account for uncertainties in the thermophysical parameters of the asteroid surface such as emissivity and conductivity, NEATM employs a variable ‘beaming parameter’ () to adjust the thermal behavior of the surface from the idealized state. This parameter acts as a sink for uncertainties due to physical variation among objects as well as random and systematic model errors. NEATM is by necessity a simple approximation of the real thermal behavior of asteroid surfaces; more detailed thermophysical modeling (e.g. Spencer, 1990; Lagerros, 1997; Wright, 2007; Alí-Lagoa et al., 2014; Koren et al., 2015; Hanuš et al., 2016; Nugent et al., 2017) can provide improved constraints on the physical and thermal properties of an asteroid if multiple viewing geometries are available, though at the expense of greatly increased computation time. We provide NEATM-derived physical properties here as a springboard for more detailed modeling of targets of interest.
Our general thermal fitting procedure is as follows: our routine reads in the times, magnitudes, and spacecraft positions for each detection returned from our search of the NEOWISE Year 3 data. Detections in the saturated non-linear regime (c.f. Cutri et al., 2015) are rejected, as are any detections coincident with stationary sources in the AllWISE catalog (see above). The most recent orbit for the object is read in from the Minor Planet Center’s MPCORB file, and the position of the object with respect to the sun and spacecraft is calculated for each time of observation. For each object, detections are clustered into 10-day-long sets. For distant objects (e.g. MBAs) this results in multiple epochs of observations being fitted separately. For NEOs that follow the survey pattern and thus remain in the field of view for long periods of time, this breaks up the single set of detections into multiple subsets to accommodate any potential change in viewing geometry over the course of the observations. Our routine then attempts to fit the diameter and albedo of each object with at least three observations in one band, using assumed beaming parameters and infrared-to-visible albedo ratios.
Our routine only uses detections with magnitude errors less than (effectively restricting to brighter than SNR), will only fit objects with at least 3 detections, and will only use the W1 band for fitting if the number of valid W1 detections is greater than of the detections in W2. During the fit, the visible and infrared albedos are required to remain between and and the beaming is required to remain between and (the theoretical maximum for NEATM). Based on this initial fit, our routine checks the reflected and emitted light components in each band. If more than of the light in W1 is from reflected light, the code reruns the fitting routine allowing the infrared albedo to be a fitted parameter. If instead both bands have at least three detections and more than of the modeled flux based on the initial fit is from thermal emission, the code reruns the fitting routine allowing beaming parameter to be a fitted parameter.
These initial fits were then checked to verify that the modeled visible flux matched the predicted flux based on the and phase function parameters, that the visible albedo was larger than and smaller than , and that at least one band had of its modeled flux from thermal emission. Fits that did not pass these tests were rerun or dropped, as described below.
The values for inner solar system objects typically span the range between (Mainzer et al., 2011c; Masiero et al., 2011). Lower values result in a higher modeled subsolar temperature, leading to a larger modeled flux per facet and a smaller modeled diameter. Objects with larger values have lower modeled subsolar temperatures and larger modeled diameters. During the cryogenic phase of the WISE/NEOWISE survey, detections in multiple thermally-dominated bands could be used to constrain the shape of an asteroid’s spectral energy distribution (SED), and thus the beaming parameter. Using only the and m channels, only a handful of detected objects were thermally dominated in both bands W1 and W2. Thus, an assumed value of the beaming parameter had to be used for a majority of the detected objects. For objects that did have thermal emission in W1, W1 and W2 combined provide only a modest constraint on the shape of the SED as both sample points that are close together on the blackbody curve. For objects where the fitted beaming parameter resulted in unphysical results we force the model to use the assumed beaming parameter (due to an uncertain reflected light component in the W1 flux). When assuming a beaming value, we use the average value found for the NEOs and MBAs from the cryogenic WISE/NEOWISE survey for each population: , (Mainzer et al., 2011c; Masiero et al., 2011, respectively). For a subset of objects the initial NEATM fit resulted in an unnaturally low albedo (), indicating that the beaming assumption had resulted in an inaccurate diameter. For these objects we use different assumed beaming values of to obtain our best fit, and indicate them in Tables 1-2.
In order to estimate the contribution of reflected light to the W1 and W2 bands, we use an assumed infrared-to-optical geometric albedo ratio of for the NEOs and for the MBAs. These ratios are drawn from the average values for those populations with fitted using, at a minimum, the and m channels from the fully cryogenic WISE/NEOWISE data (Mainzer et al., 2011c; Masiero et al., 2011). We assume that the albedos in W1 and W2 are the same.
To determine the statistical error component on our fitted parameters, we perform 25 Monte Carlo trials of the fit, varying the three measurements (H, W1, W2) by their respective error bars (, , ), while the assumed parameters (pIR, ) were varied by their estimated uncertainties. In each trial, the measured/assumed value is taken as the mean of a Gaussian, while the uncertainty on each is used as the standard deviation; a new value for each parameter is drawn randomly and independently from these Gaussian distributions for each Monte Carlo trial. Our thermal model is then applied to these new input parameters, and the output best-fit values are recorded. Our quoted error on each parameter is the standard deviation of the fitted values for that parameter in all of the Monte Carlo runs.
In the trials, we vary the input infrared magnitude based on the measurement error published in the single-exposure database. Absolute magnitude used error bar of mag for NEOs and mag for MBAs, though as discussed above in some cases smaller errors were used to reject solutions at a local minimum. Assumed parameters were assigned error values that were also varied according to their uncertainties in the Monte Carlo trials. Beaming parameter errors were based on the spread of best fit beaming parameters found during the cryogenic WISE/NEOWISE survey (Mainzer et al., 2011c; Masiero et al., 2011). Similarly, errors on the ratio between the infrared and visible albedo were based on the range of fitted values in the cryogenic survey. Listed errors for diameter and albedo thus represent the range of best fit values for the Monte Carlo trials; these uncertainty values will not include systematic errors due to the difference between the NEATM model and the true thermal behavior of the asteroid. Thus quoted errors are a floor on the measurement error.
We note that due to a coding error in the tabulation of the uncertainty determinations for the NEOWISE Year 1 and 2 data (Nugent et al., 2015, 2016), a subset of fits were reported to have beaming uncertainties of , despite having assumed beaming parameters and thus assumed uncertainty values. In these cases, the assumed for each population (as above) was indeed used for the Monte Carlo uncertainty determination but this assumed uncertainty was not the value reported in the table. We have corrected this error in the current implementation of our thermal fitting software; it does not alter the outcome of the Monte Carlo determinations, and the only change to the previously published tables is to replace the published uncertainties for the assumed beaming parameters with the values describe in the text of those papers. This has been corrected for the results presented here.
4 Results
In Table 1 we present NEATM-derived diameters and albedos for unique NEOs. Table 2 gives NEATM-derived diameters and albedos for unique MBAs. These tables list the and values used as measurement inputs to the fitting routine, best-fit diameter and albedo with associated errors, the fitted or assumed beaming parameter (as indicated by the final column, where indicates a fitted beaming and an assumed value), the number of detections in each band used for the fit, and the average phase angle of the observations used. Objects listed multiple times were detected at multiple apparitions, and were fit independently. This was done because non-spherical objects can have different projected areas at different viewing geometries, even when averaging over rotational phase. Fits of different viewing geometries that result in different diameter values may be statistical noise, or may trace the true triaxial shape of the asteroid. Objects with different fitted diameters at multiple apparitions are candidates for more sophisticated thermophysical modeling.
In Tables 1 & 2, the format used to present the best-fit albedos differs from previous years. Here, we provide the best-fit albedo as a base 10 logarithm, with errors on that value. We make this change because the errors associated with our albedo determinations are inherently asymmetric and more accurately captured in log-space. Previously published albedo errors were determined by the range of solutions from the Monte Carlo trials, which naturally varied more in the positive direction than the negative direction. As such, some reported albedos appeared to have errors that encompassed negative values. These were accurate errors for the positive direction, but overestimated the negative error. This is corrected by use of log albedo, which shows that the errors are symmetric around the mean as percentages of the best-fit.
In Figure 3 we compare the diameters and albedos for NEOs that were discovered by the NEOWISE during the first three years of the reactivation survey to those of previously known NEOs that were detected by NEOWISE during this same time-period. NEOWISE preferentially discovers NEOs with low albedos (), filling in the larger (m), dark objects that are missed by ground based visible-light surveys due to their selection biases against low albedo objects. This includes NEOs with diameters measured to be larger than 1 km.
During the process of verifying the thermal fits, we found that a subset of objects showed unstable or unphysical solutions, and almost all had in common a non-zero reflected light component to the calculated W2 flux. For objects that have a very high albedo and/or are at large heliocentric distances at the time of detection, W2 may include significant flux from both thermal and reflected light, and the balance between these two components will depend very strongly on the assumed beaming parameter; small changes to can result in large changes in best-fit diameter. To remove these potentially erroneous fits, we discard any solution where the reflected light component of the W2 flux was greater than of the total flux. This resulted in NEOs and MBAs that were observed by NEOWISE during Year 3 not having fitted physical properties, and thus are not included in Tables 1 & 2. This cut is more strict than was applied to the NEOWISE reactivation Years 1 and 2 data but results in more robust diameter determinations. It is important to stress that this restriction has a significant impact on the albedo distribution of the MBAs reported here, causing a significant selection bias against high albedo MBAs (as these will have a larger contribution from reflected light at all wavelengths). Thus low albedo asteroids are over-represented in Table 2 compared to the results from the cryogenic survey ( vs respectively). This effect is less significant for NEOs as they tend to be closer to the Sun at the time of observation, thus warmer and with more emitted flux in W2. Any attempt to characterize the whole MBA population based on the fits from the Year 3 data will need to account for this bias. We note that this bias does not impact the data from the cryogenic portion of the original WISE survey (see Mainzer et al., 2011c), as the W3 and W4 fluxes were always entirely from thermal emission.
| Name | H | G | Diameter | beaming | nW1 | nW2 | phase | Fitted | |
|---|---|---|---|---|---|---|---|---|---|
| (mag) | (km) | (deg) | Beaming? | ||||||
| 01863 | 15.54 | 0.15 | 3.05 0.79 | -1.010 0.297 | 2.12 0.46 | 12 | 13 | 52.96 | 1 |
| 01864 | 14.85 | 0.15 | 2.53 0.45 | -0.504 0.142 | 1.27 0.24 | 5 | 6 | 63.36 | 1 |
| 01865 | 16.84 | 0.15 | 0.71 0.26 | -0.319 0.267 | 1.40 0.53 | 5 | 5 | 69.40 | 1 |
| 02100 | 16.05 | 0.12 | 3.05 0.37 | -1.242 0.317 | 2.56 0.26 | 32 | 33 | 60.30 | 1 |
| 02102 | 16.00 | 0.15 | 1.76 0.60 | -0.654 0.256 | 1.58 0.48 | 22 | 27 | 53.60 | 1 |
| 03360 | 15.90 | 0.15 | 2.56 1.14 | -0.930 0.341 | 1.40 0.50 | 0 | 8 | 40.98 | 0 |
| 03360 | 15.90 | 0.15 | 2.34 0.35 | -0.848 0.121 | 1.25 0.17 | 6 | 6 | 58.47 | 1 |
| 04179 | 15.30 | 0.10 | 1.79 0.38 | -0.392 0.166 | 1.01 0.22 | 6 | 6 | 47.91 | 1 |
| 04341 | 16.11 | 0.10 | 3.18 0.65 | -1.264 0.427 | 2.65 0.47 | 6 | 6 | 49.48 | 1 |
| 04769 | 16.90 | 0.15 | 1.40 0.03 | -1.036 0.062 | 2.72 0.05 | 5 | 5 | 61.91 | 1 |
| Name | H | G | Diameter | beaming | nW1 | nW2 | phase | Fitted | |
|---|---|---|---|---|---|---|---|---|---|
| (mag) | (km) | (deg) | Beaming? | ||||||
| 00013 | 6.74 | 0.15 | 216.06 54.78 | -1.313 0.198 | 0.95 0.20 | 12 | 12 | 24.55 | 0 |
| 00019 | 7.13 | 0.10 | 205.42 68.11 | -1.339 0.249 | 0.95 0.20 | 6 | 8 | 24.27 | 0 |
| 00034 | 8.51 | 0.15 | 113.26 30.34 | -1.412 0.295 | 0.95 0.20 | 13 | 14 | 21.84 | 0 |
| 00035 | 8.60 | 0.15 | 126.62 41.41 | -1.482 0.246 | 0.95 0.20 | 8 | 9 | 24.42 | 0 |
| 00035 | 8.60 | 0.15 | 140.67 47.03 | -1.537 0.251 | 0.95 0.20 | 10 | 11 | 24.91 | 0 |
| 00036 | 8.46 | 0.15 | 106.13 32.38 | -1.360 0.285 | 0.95 0.20 | 13 | 13 | 22.52 | 0 |
| 00041 | 7.12 | 0.10 | 184.78 60.20 | -1.286 0.320 | 0.95 0.20 | 9 | 9 | 23.54 | 0 |
| 00049 | 7.65 | 0.19 | 151.30 39.27 | -1.329 0.233 | 0.95 0.20 | 11 | 11 | 22.11 | 0 |
| 00050 | 9.24 | 0.15 | 87.92 27.53 | -1.428 0.368 | 0.95 0.20 | 7 | 7 | 22.83 | 0 |
| 00056 | 8.31 | 0.15 | 109.09 34.20 | -1.273 0.237 | 0.95 0.20 | 6 | 6 | 26.66 | 0 |

5 Comparison of Derived Properties to Literature Values
To quantify how accurately our modeled diameters reflect the actual effective spherical diameter of the asteroids observed, we compare the fits presented in this paper with diameter measurements of the same asteroids in three independent data sets. The first dataset is composed of a collection of diameters derived from radar reflection measurements (Hudson & Ostro, 1994; Magri et al., 1999; Shevchenko & Tedesco, 2006; Magri et al., 2007; Shepard et al., 2010; Naidu et al., 2015; Benner, priv comm), occultation timing chords (D̆urech et al., 2011; Dunham et al., 2016), and in situ spacecraft measurements, as discussed in Mainzer et al. (2011b). These techniques do not rely on thermal modeling to derive diameters, and thus allow us to probe any systematic issues with our thermal modeling technique. However, these calibrators are also the smallest in number of our three comparison sets, and mainly consist of only the largest asteroids.
Our second comparison set consists of objects with diameters fitted using data from the fully cryogenic portion of the original WISE/NEOWISE survey where the beaming parameter was a fitted value. As the m and m bandpasses were the most sensitive to thermal emission from asteroids, they typically provided high SNR measurements and allowed for the beaming parameter to be fitted. These diameter measurements use the same modeling techniques, allowing us to determine the effect of the assumed beaming parameter on the overall fit quality. Comparison diameters were obtained from the Planetary Data System (PDS) archive (Mainzer et al., 2016), which is a compilation of data from Mainzer et al. (2011c) and Masiero et al. (2011, 2012).
Our final comparison set is the collection of objects that were observed during Years 1 or 2 of the NEOWISE mission, as well as in Year 3. As these fits were conducted using nearly identical methods and assumptions, this comparison allows us to determine the effect of changing viewing geometry on the overall fit quality. Comparison diameters were obtained from the Mainzer et al. (2016) PDS archive which included fits from Nugent et al. (2015) as well as the fits presented by Nugent et al. (2016) of asteroids observed in the NEOWISE Year 2 data.
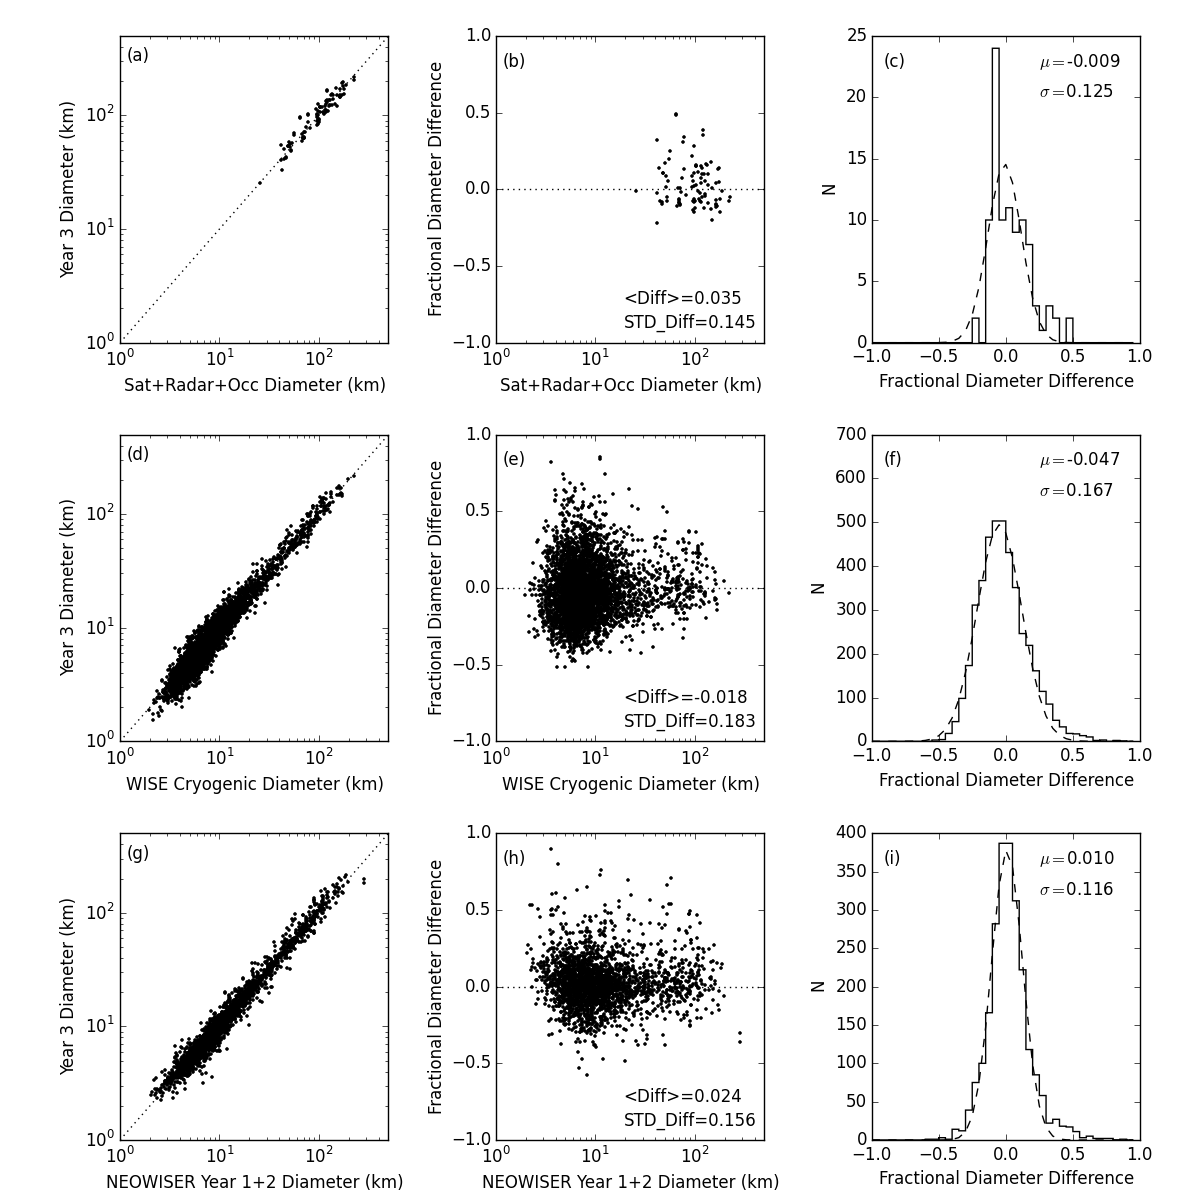
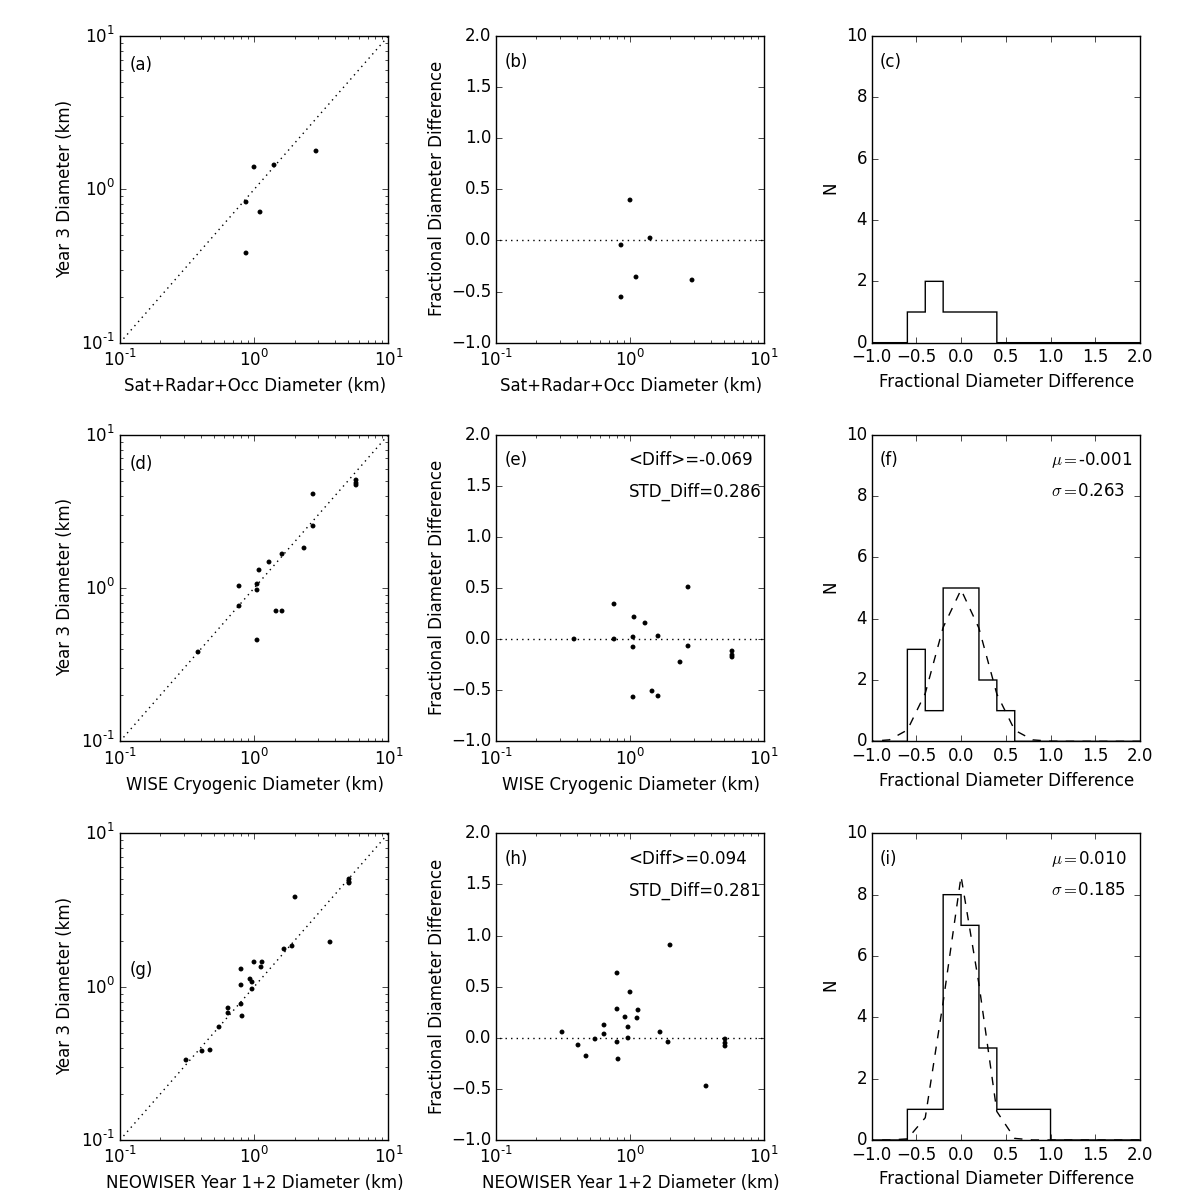
Figure 4 shows the comparison for the Main Belt asteroids of the diameters in the three independent sets with the diameters presented in this work. We present two different statistical assessments of the diameters we fit in this work. In panels (b), (e), and (h) we give the numerical mean “Diff” and standard deviation “STD_DIFF” of the fractional diameter differences between the Year 3 diameter and the comparison data. In panels (c), (f), and (i) we fit a Gaussian distribution to the histogram of the fractional diameter differences. This fit is shown as a dashed line, with the fitted and of the Gaussian shown in the each panel. We prefer the fitted Gaussian for our analysis as it is less affected by small numbers of outliers than the simple mean calculation, however we list both for completeness. From the comparison to satellite, radar, and occultation diameters, the largest objects have a diameter uncertainty spread of based on a Gaussian fit to the diameter differences. The overall diameter uncertainty is for all three comparison data sets. The systematic offset in mean diameter difference is at most a few percent for all cases.
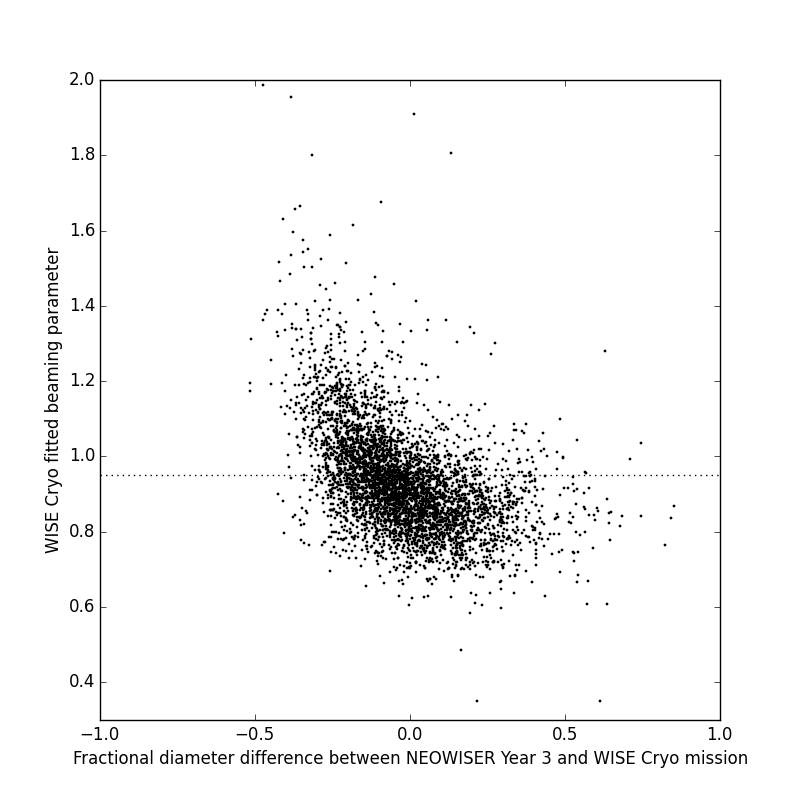
All three comparisons show an asymmetry in the fractional diameter difference, where the Year 3 diameters are skewed to larger sizes. This is a result of our assumed value for the beaming parameter. As shown in Figure 5, our assumed beaming value is near the mean for the population, but the difference between this value and the value measured during the cryogenic mission affects the diameter error in a non-random way. A true beaming value (that would be fit to an ideal data set fully sampling the spectral energy distribution) that is larger than our assumed one would result in a modeled peak surface temperature higher than the actual value () and thus a smaller diameter than would be found in the ideal case. Conversely, an actual beaming smaller than our assumption would result in a systematically larger fitted diameter value. Although beaming varies over a larger range above , the majority of objects observed during the Year 3 survey had previously measured beaming values below , resulting in the asymmetric distributions seen in Fig 4. We note, however, that the uncertainty on the assumed beaming parameter is captured in our Monte Carlo simulations used to derive the statistical diameter error, so much of this effect is represented in the quoted errors.
We show in Figure 6 the same comparison for NEOs. There are only a small number of overlapping objects in the satellite, radar, and occultation data set, making it impossible to draw robust conclusions from this comparison and thus we do not present the statistical metrics for this set. Comparison with the cryogenic NEOWISE fits shows an overall diameter uncertainty of , with a smaller dispersion for the comparison to previous years of NEOWISE reactivation data. As with the MBAs, the mean offset in for NEO diameters is less than a few percent. The diameter offset is larger when looking at the numerical mean of the fractional differences for both comparison sets, but the limited sample size makes this metric particularly sensitive to a small number of outliers.
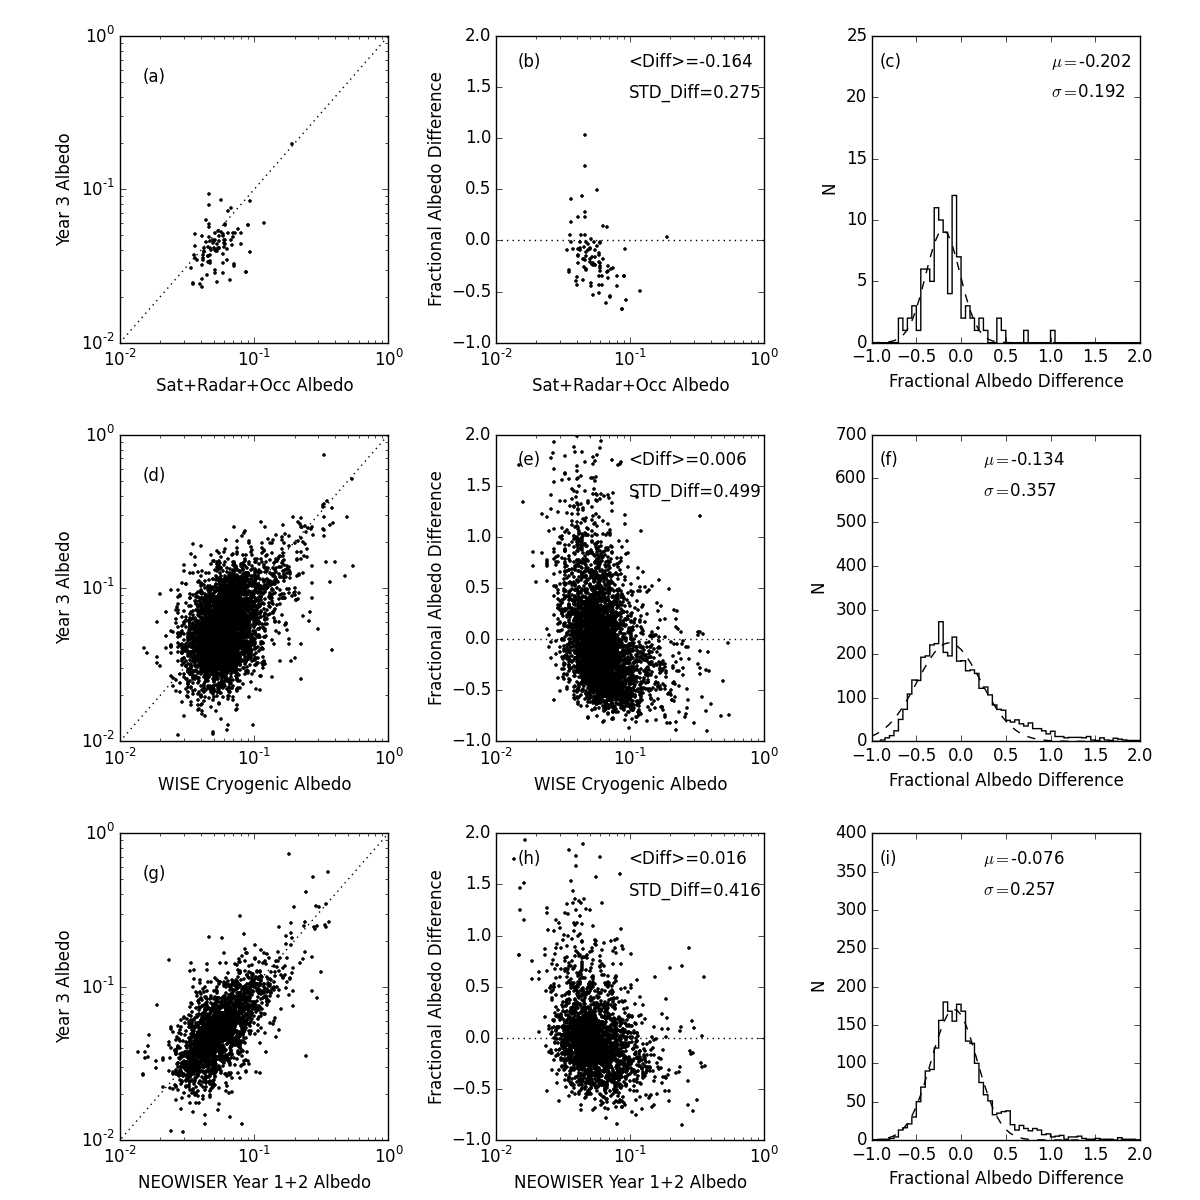
We also can compare the albedos we derive from our fits of the Year 3 data to the same calibration sets as for the diameters. We show this comparison in Figure 7. There is a strong systematic bias to lower albedos in our fits of the Year 3 data as compared to previous fits of the same objects. As discussed above, this is a result of the systematic offset in the absolute magnitudes published by Vereš et al. (2015) as compared to the MPC-derived magnitudes used for the thermal model fits by Masiero et al. (2011, 2012); Nugent et al. (2015). The MBA fits from Nugent et al. (2016) for NEOWISE Year 2 used magnitudes from Williams (2012), who revised the MPC photometric fits. A comparison of the magnitudes from Vereš et al. (2015) and Williams (2012) to those from the MPC used in the NEOWISE PDS release show a similar offset to fainter absolute magnitudes for both sets. This explains why the comparison of albedos from Year 3 to those from Years 1 and 2 shows a smaller offset than the comparison to the cryogenic data. As the albedos given for the objects with diameter measurements from satellite, radar, and occultations were also based older magnitude fits, they will also show an offset when compared to albedos derived from the updated values. As Figure 7 highlights, revisions to the literature absolute magnitudes can result in significant changes to the albedos determined from thermal modeling. However as shown in Figure 4 these changes in magnitude have no significant impact on the accuracy of the diameter determination.
6 Conclusions
We have presented NEATM thermal model fits for NEOs and MBAs detected by the NEOWISE mission during its third year of surveying. In total, there were NEOs and MBAs with sufficient data to constrain a diameter based on their thermal emission, and an albedo based on literature reflected visible light. We find that our Main Belt asteroid diameter fits have uncertainties of when compared to other published diameters. The NEOs have a larger uncertainty of . However this is based on a small number of objects. For the NEOWISE Year 3 data, we have tightened our selection requirements, rejecting any fits where more than of the modeled flux in W2 was from reflected light. This most severely impacted the number of Main Belt asteroids with published fits (rejecting nearly objects). However, we feel this improves the reliability of the remaining fits. This cut does introduce a strong bias against high albedo objects in the Main Belt, which are more likely to have a significant amount of reflected light in W2, resulting in the majority of our reported Main Belt asteroids being from the low-albedo complex.
NEOWISE is continuing its survey for asteroids and comets into its fourth year. Orbital precession will eventually make surveying impossible at some point following the end of the fourth year of survey, though this depends on the activity level of the Sun. It remains difficult to predict when conditions will inhibit high-quality data collection, but until that time the data remain highly useful for the characterization and discovery of near-Earth asteroids, Main Belt asteroids, and comets.
Acknowledgments
This publication makes use of data products from the Wide-field Infrared Survey Explorer, which is a joint project of the University of California, Los Angeles, and the Jet Propulsion Laboratory/California Institute of Technology, funded by the National Aeronautics and Space Administration. This publication also makes use of data products from NEOWISE, which is a project of the Jet Propulsion Laboratory/California Institute of Technology, funded by the Planetary Science Division of the National Aeronautics and Space Administration. This research has made use of data and services provided by the International Astronomical Union’s Minor Planet Center. This publication uses data obtained from the NASA Planetary Data System (PDS). This research has made use of the NASA/IPAC Infrared Science Archive, which is operated by the Jet Propulsion Laboratory, California Institute of Technology, under contract with the National Aeronautics and Space Administration. Based on observations obtained at the Gemini Observatory through a Gemini Large and Long Program, which is operated by the Association of Universities for Research in Astronomy, Inc., under a cooperative agreement with the NSF on behalf of the Gemini partnership: the National Science Foundation (United States), the National Research Council (Canada), CONICYT (Chile), Ministerio de Ciencia, Tecnología e Innovación Productiva (Argentina), and Ministério da Ciência, Tecnologia e Inovação (Brazil). Finally, the authors acknowledge the efforts of NEO followup observers around the world who provide time-critical astrometric measurements of newly discovered NEOs, enabling object recovery and computation of orbital elements. Many of these efforts would not be possible without the financial support of the NASA Near-Earth Object Observations Program.
References
- Alí-Lagoa et al. (2014) Alí-Lagoa, V., Lionni, L., Delbo, M., Gundlach, B., Blum, J., & Licandro, J. 2014, A&A, 561, 45.
- Bauer et al. (2013) Bauer, J.M., Grav, T., Blauvelt, E., Mainzer, A., Masiero, J., et al., 2013, ApJ, 773, 22.
- Benner (priv comm) Benner, L., priv. comm.
- Cutri et al. (2015) Cutri, R.M., Mainzer, A., Conrow, T., Masci, F., Bauer, J., et al., 2015, Explanatory Supplement to the NEOWISE Data Release Products, http://wise2.ipac.caltech.edu/docs/release/neowise/expsup
- Dunham et al. (2016) Dunham, D., Herald, D., Frappa, E., Hayamizu, T., Talbot, J., & Timerson, B. 2016, NASA Planetary Data System, EAR-A-3-RDR-OCCULTATIONS-V14.0.
- D̆urech et al. (2011) D̆urech, J., Kaasalainen, M., Herald, D., Dunham, D et al., 2011, Icarus, 214, 652.
- Grav et al. (2011) Grav, T., Mainzer, A.K., Bauer, J.M., Masiero, J., Spahr, T, et al., 2011, ApJ, 742, 40.
- Grav et al. (2012) Grav, T., Mainzer, A.K., Bauer, J.M., Masiero, J., Spahr, T., et al., 2012, ApJ, 744, 197.
- Hanuš et al. (2016) Hanuš, J., Delbo’, M, Vokrouhlický, D., Pravec, P., Emery, J., et al., 2016, A&A, 529, 34
- Harris et al. (1998) Harris, A.W., 1998, Icarus, 131, 291.
- Hudson & Ostro (1994) Hudson, R.S. & Ostro, S.J., 1994, Science, 263, 940.
- Koren et al. (2015) Koren, S., Wright, E.L., Mainzer, A., 2015, Icarus, 258, 82.
- Lagerros (1997) Lagerros, J.S.V., 1997, A&A, 325, 1226.
- Magri et al. (1999) Magri, C., Ostro, S., Rosema, K., Thomas, M., et al., 1999, Icarus, 140, 379.
- Magri et al. (2007) Magri, C., Nolan, M., Ostro, S. & Giorgini, J., 2007, Icarus, 186, 126.
- Mainzer et al. (2011a) Mainzer, A.K., Bauer, J.M., Grav, T., Masiero, J., et al., 2011a, ApJ, 731, 53.
- Mainzer et al. (2011b) Mainzer, A.K., Grav, T., Masiero, J., Bauer, J.M., et al., 2011b, ApJ, 736, 100.
- Mainzer et al. (2011c) Mainzer, A.K., Grav, T., Bauer, J.M., Masiero, J., et al., 2011c, ApJ, 743, 156.
- Mainzer et al. (2012) Mainzer, A.K., Grav, T., Masiero, J., Bauer, J.M., Cutri, R.M. et al., 2012, ApJL, 760, 12.
- Mainzer et al. (2014) Mainzer, A.K., Bauer, J., Grav, T., Cutri, R., Masiero, J., et al., 2014, ApJ, 792, 30.
- Mainzer et al. (2016) Mainzer, A.K., Bauer, J., Cutri, R., Grav, T., Kramer, E., et al., 2016, NASA Planetary Data System, EAR-A-COMPIL-5-NEOWISEDIAM-V1.0.
- Masiero et al. (2011) Masiero, J.R, Mainzer, A.K., Grav, T., Bauer, J.M., et al., 2011, ApJ, 741, 68.
- Masiero et al. (2012) Masiero, J.R, Mainzer, A.K., Grav, T., Bauer, J.M., Cutri, R.M. et al., 2012, ApJL, 759, 8.
- Masiero et al. (2012) Masiero, J.R, Grav, T., Mainzer, A.K., Nugent, C., Bauer, J., Stevenson, R., Sonnett, S., 2014, ApJ, 791, 121.
- Naidu et al. (2015) Naidu, S., Margot, J.L., Taylor, P.A., Nolan M. et al., 2015, AJ, 150, 54.
- Nugent et al. (2015) Nugent, C.R., Mainzer, A., Masiero, J., Bauer, J.M., Cutri, R.M. et al., 2015, ApJ, 814, 117.
- Nugent et al. (2016) Nugent, C.R., Mainzer, A., Bauer, J.M., Cutri, R.M., Kramer, E. et al., 2016, AJ, 152, 63.
- Nugent et al. (2017) Nugent, C.R., Mainzer, A., Masiero, J., Wright, E.L., Bauer, J.M. et al., 2017, AJ, 153, 90.
- Pravec et al. (2012) Pravec, P., Harris, A.W., Kus̆nirák, P., Galád, A. & Hornoch, K., 2012, Icarus, 221, 365.
- Shepard et al. (2010) Shepard, M., Clark, B., Ockert-Bell, M., Nolan, M. et al., 2010, Icarus, 208, 221.
- Shevchenko & Tedesco (2006) Shevchenko, V.G. & Tedesco, E.F., 2006, Icarus, 184, 211.
- Spencer (1990) Spencer, J.R., 1990, Icarus, 83, 27.
- Vereš et al. (2015) Vereš, P., Jedicke, R., Fitzsimmons, A., Denneau, L., Granvik, M. et al., 2015, Icarus, 261, 34.
- Williams (2012) Williams, G., 2012, PhD Thesis, Open University.
- Wright (2007) Wright, E.L., 2007, arXiv:0703085
- Wright et al. (2010) Wright, E.L., Eisenhardt, P., Mainzer, A.K., Ressler, M.E., Cutri, R.M., et al., 2010, AJ, 140, 1868.