Gamma-ray Flux Distribution and Non-linear behavior of Four LAT Bright AGNs
Abstract
We present a statistical characterization of the -ray emission from the four Fermi-LAT sources: FR I radio galaxy NGC 1275, BL Lac Mrk 421, FSRQs B2 1520+31 and PKS 1510-089 detected almost continuously over a time integration of 3-days between August 2008 - October 2015. The observed flux variation is large, spanning orders of magnitude between the extremes except for Mrk 421. We compute the flux distributions and compare with Gaussian and lognormal ones. We find that the 3 blazars have distribution consistent with a lognormal, suggesting that the variability is of a non-linear, multiplicative nature. This is further supported by the computation of the flux-rms relation, which is observed to be linear for the 3 blazars. However, for NGC 1275, the distribution does not seem to be represented either by a lognormal or a Gaussian, while its flux-rms relation is still found to be linear. We also compute the power spectra, which suggest the presence of a break, but are consistent with typical scale-free power-law shot noise. The results are broadly consistent with the statistical properties of the magnetic reconnection powered minijets-in-a-jet model. We discuss other possible scenarios and implications of these observations on jet processes and connections with the central engine.
1 INTRODUCTION
Active galactic nuclei (AGNs) refer to astrophysical objects classified on multiple, and often independent sets of criteria in different energy bands, but are believed to be powered by an accreting super-massive black hole (SMBH) residing in the core (Tadhunter, 2008). They are mainly characterized by high luminosity and persistent variability across the entire accessible electromagnetic spectrum, especially at high energies ( X-rays). The observed trends/features across spectral, temporal and spatial domains are highly energy dependent and can manifest at widely different scales in different energy bands. Despite the broad range of manifestations, AGNs, under the simplest unification scheme based on observable characteristics, have been primarily categorized on the basis of radio-loudness and the properties of optical-ultraviolet (UV) emission lines (Urry & Padovani, 1995; Tadhunter, 2008). The division is fully empirical with further hierarchical classification within each class based on other observed features. Observationally, AGNs are the most persistent but dynamic high energy emitters and thus, constitute a major fraction of extragalactic objects in surveys. At Fermi-LAT (Large Area Telescope) -ray energies, they constitute 70% of the total sources in the 3rd Fermi-LAT catalog (Acero et al., 2015).
The radio-loud AGNs, in general, are more dynamic than their corresponding radio-quiet (RQ) counterparts and exhibit extreme scales in all spectral, temporal, spatial, and polarization domains. Most prominently, they exhibit large scale (kpc/Mpc), highly collimated relativistic jets which are the primary features for further classifications based on its orientation and luminosity. Broadly, if the jet is orientated at close angles to the observer’s line of sight, they are classified as blazars, and are called radio galaxies otherwise. Further, within radio-galaxies, the low and high power sources are known as the Fanaroff and Riley I (FR I) and FR II objects (Fanaroff & Riley, 1974), respectively. The corresponding counterparts in the blazar subclass are, respectively, the BL Lacertae objects (BLLs) and the flat spectrum radio quasars (FSRQs), where the former show weak emission lines or a featureless optical-ultraviolet (UV) spectrum while the latter exhibits prominent broad emission lines (Urry & Padovani, 1995).
One of the important characteristics of accretion-powered sources, regardless of their mass and compactness, is the high, frequent and energy-dependent temporal variability e.g. AGNs (e.g. Gaskell, 2004; McHardy et al., 2004, 2005), galactic X-ray binaries (GXBs; e.g. Gandhi, 2009), micro-quasars (Cyg X-1; Uttley et al., 2005), cataclysmic variables and young stellar objects (YSOs; Scaringi et al., 2015; Van de Sande et al., 2015; Scaringi et al., 2012). Such sources are generally characterized by their power spectral density (PSD), flux distribution and excess-variability (RMS), and often show a (broken) power-law PSD, a log-normal flux distribution, and a linear rms-flux relation. These features, claimed as universal characteristics of accretion-powered sources (e.g. Scaringi et al., 2015, 2012), have also been observed in the emission of the most under-luminous SMBH Sgr A∗ located at the center of our galaxy (Meyer et al., 2014; Witzel et al., 2012; Dodds-Eden et al., 2011; Meyer et al., 2009). These phenomenological similarities across a wide range of mass scales ( 10 orders) have further led to the claim that the physics of accretion is universal, irrespective of accretor physical details.
At high energies in radio-loud sources, the primary contribution is believed to be mainly from the inner accretion disk, corona, and the relativistic jets. Since in RQAGNs and GXBs, the accretion disk (inner region) primarily emits in X-ray regime, a leading explanation (Uttley et al., 2005; McHardy et al., 2005) for the scale-free but similar behavior has been fluctuations in the accretion disk (Lyubarskii, 1997). The recent finding of similar behaviors in optical observation of compact objects like CVs and non-compact objects like YSOs seems consistent with this understanding as the accretion disk emission for these sources lies in optical/UV. Additionally, similar characteristics have been seen in the optical emission of few GXBs (Gandhi, 2009). However, on a completely different scale, the X-ray emission from the whole Solar surface shows similar behavior (Zhang, 2007) where the variability is well understood to be a manifestation of magnetic reconnection process. Moreover, all accreting compact systems are believed to have magnetic fields of varying degree, making the uniqueness claim ambiguous (see, for instance, a possible magnetic reconnection scenario for flares from microquasars and non-blazar low luminous AGNs in de Gouveia dal Pino & Lazarian, 2005; Kadowaki et al., 2015; Khiali et al., 2015; Singh et al., 2015). In blazars, almost all the emission, on the other hand, is understood to be originating primarily in the jet as a result of the interaction of jet plasma and magnetic field. Though a strong, large-scale magnetic field is believed to be the primary driver of jet formation and collimation, it is not clear whether only the BH spin, the accretion disk or both play a dynamic role in its origin and evolution. Further, current studies suggest that even small scale magnetic fields can efficiently power the jets (Parfrey et al., 2015; Contopoulos et al., 2015).
Time series analysis and characterization is a powerful tool to understand highly variable and unresolved sources and has been routinely used to explore the X-ray emission from AGNs and GXBs along with spectral studies. Similar attempts to statistically characterize -ray emission from blazars have been hampered due to the lack of continuous detection and inhomogeneous temporal coverage. This has been a major impediment, making the results and interpretation prone to biasing (e.g. H.E.S.S. Collaboration et al., 2010; Giebels & Degrange, 2009; Kushwaha et al., 2016).
In this work, we present the first systematic characterization of long-term -ray emission from four AGNs: BL Lac Mrk421 (z = 0.030), FSRQ B2 1520+10 (z = 1.487) and PKS 1510-089 (z = 0.36), and FR I radio galaxy NGC 1275 (z = 0.017559) using histogram, rms-flux relation, and PSD. An almost continuous detection () of these sources over a data time-bin of 3-days makes them ideal candidates to study these features and comparison vis-a-vis other AGNs and GXBs. The -ray being dominated by the jet carries the imprints of jet processes and magnetic field on the characteristics of the central source that, otherwise, could have been observed had the jet emission not overshadowed it. Thus, the similarity (dissimilarity) of features should contain important physics about the relative role of the central source features and magnetic field and/or jet processes, offering new insight into the central source and jet connection. In the next section, we present the details of the data and reduction procedures. In Section 3, the temporal and flux variability is presented along with the results. Implications and connections with AGNs and X-ray binaries are discussed in Section 4 with final conclusions in Section 5.
2 DATA REDUCTION
The LAT is an electron-positron pair conversion imaging instrument on board the Fermi Gamma-ray Space Telescope. It normally operates in scanning mode and covers the entire sky for -ray photon events from 20 MeV to 300 GeV every hours with a field of view of steradian (Atwood et al., 2009). It thus provides an almost uniform and continuous observation of both, persistent as well as transient -ray sources. The continuous survey since its launch in 2008 has resulted in one of the longest and most evenly sampled -ray data of the sky. Here, we have used the latest, PASS8 processed LAT data of four AGNs from August 05, 2008 (MJD 54683) to October 05, 2015 (MJD 57300) to generate the light curves over a time bin of 3-days. The choice of 3-day time bin is to minimize the non-detections at shorter time-bins which can bias the histograms and at the same time, provide maximum data cadence for the rms-flux and PSD analysis.
The analysis was performed with the latest Fermi Science Tool (v10r0p5) following the recommended procedure documented online111http://fermi.gsfc.nasa.gov/ssc/data/analysis/scitools/python_tutorial.html. For each time-bin, events tagged as “evclass=128, evtype=3” with energy MeV were selected from a circular region of interest (ROI) of centered on the source. The events associated with the Earth’s limb were minimized by restricting the acceptance within a maximum zenith angle of while the instrument operation in scientific data mode was ascertained by the recommended time interval filter expression “(DATA_QUAL0)&&(LAT_CONFIG==1)”. The effect of the selections and cuts along with the contributions from other -ray sources in the selected field were incorporated using an exposure map over ROI and an additional annulus of around it. The contribution of Galactic diffuse and isotropic extragalactic emission was accounted by the inclusion of respective emission templates gll_iem_v06.fits and iso_P8R2_SOURCE_V6_v06.txt provided by the LAT Science Team in the input model file. The resulting files were then modeled using an unbinned likelihood analysis method provided with the pylikelihood library of the analysis software.
The above procedure is followed with -ray emission from other sources in the field accounted for by an input model file from the LAT 3rd catalog (3FGL – gll_psc_v16.fit; Acero et al., 2015) describing their spectrum. In the analysis, Mrk 421 is modeled as a power-law spectrum while a log-parabola spectral model has been used for the other three, with normalization and spectral indices free to vary during the likelihood analysis. Besides these, other sources have been modeled as per their default spectra in the 3FGL catalog. The likelihood convergence was performed iteratively by removing point sources having test statistic (TS) 0 as done in Kushwaha et al. (2014). However, for detection and scientific analysis, only data points which satisfy the significance of 3, corresponding to a TS value of 9 are considered.
3 ANALYSIS AND RESULTS
The 0.1-300 GeV ray light curves of the four AGNs: the FRI radio galaxy NGC 1275, BLL Mrk 421, FSRQ B2 1520+31, and FSRQ PKS 1510-089 between August 05, 2008 (MJD 54683) to October 05, 2015 (MJD 57300) over a uniform integration time of 3-days with detection significance above/equal are shown in Figure 1. All the sources are detected over (e.g. PKS 1510-089; Kushwaha et al., 2016) of the total duration, thereby presenting one of the best sampled -ray light curves till date (on the timescale of days). The light curves clearly show different levels of variability for each source, an aspect of source and energy dependent variability. We explore the statistical features and quantify this in terms of flux and temporal variability using flux-histogram, RMS and PSD222The scope of these statistical methods to explore and understand AGNs and other accreting compact sources from variability point of view is outlined e.g. in Vaughan et al. (2003); McHardy et al. (2005); Uttley et al. (2005); Uttley & McHardy (2001).

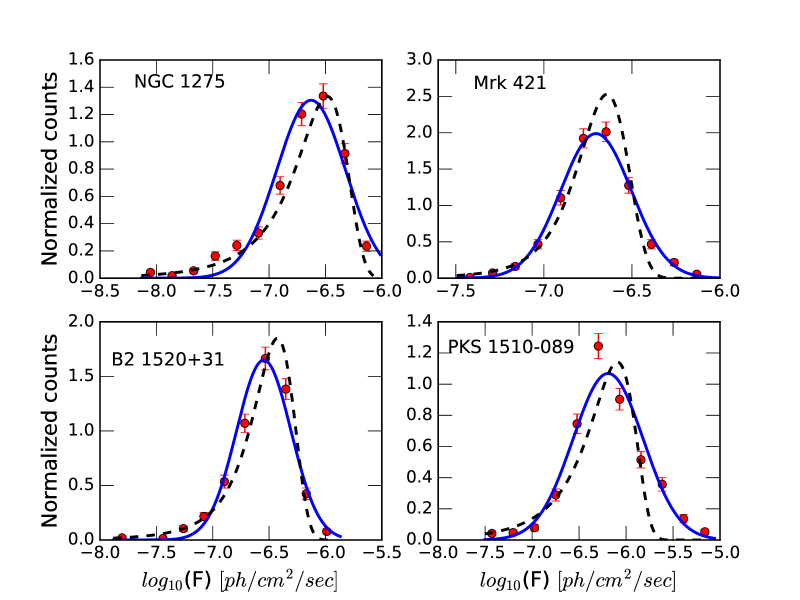
3.1 Flux Distribution and Effect of Photon Statistics
A histogram of a quantity characterizes the distribution of the measured values and thus is an important tool to explore the existence of characteristic scales/values in a system and the range it spans. In Figure 2, we present the normalized histograms of the logarithmic333Unless stated otherwise, logarithm throughout this work means log of physical quantity to the base of 10. -ray photon flux. Care was taken to ensure a bin width larger than the flux value with account of error in that bin. All the histograms show a prominent peak and a low flux tail with flux spanning two orders of magnitudes between the extremes except for Mrk 421. Further, the peaks have a typical variation of about an order of magnitude which is quite common in PKS 1510-089 followed by NGC 1275, B2 1520+31 and Mrk 421. Since a random stochastic process is expected to yield a normal distribution, we computed the skewness of the distributions (Table 1). While the skewness deviates from zero for the three blazars, the deviation for the radio-galaxy is substantially less. We then thus checked the consistency of the distributions with a lognormal as is normally inferred for RQAGNs, GXBs and even blazars (Kushwaha et al., 2016; H.E.S.S. Collaboration et al., 2010; Giebels & Degrange, 2009). The skewness of the logarithm of the fluxes was also computed, which was found to be closer to zero for the three blazars, but significantly large for the radio-galaxy. Subsequently, we computed the Anderson Darling test statistics (nortest444https://cran.r-project.org/package=nortest; R Core Team, 2013) for each of the light-curves, as coming from a Gaussian or a lognormal distribution (Table 1). While both distributions are strongly disfavored for NGC 1275, a lognormal is preferred for the three blazars. To further understand the distributions, we fitted them with normal and lognormal functions and compared the results using a test. The results of the best fit values are given in Table 1 and the plot is shown in Figure 2. The results are quite interesting favoring the lognormal distributions for the 3 blazars, Mrk 421, PKS 1510-089 and B2 1520+31, while the distribution for NGC 1275 seems more complex where neither matches the observed data.
At -ray energies with lesser and lesser photons at higher energies, photon statistics play a vital role. A significant error due to photons statistics can bias the intrinsic variation as well as the low flux end in the histogram. To understand the effects of errors on the flux and observed variations, we generated two intrinsic distributions: a lognormal and a Normal flux distribution and then convolved each with Poisson noise to reproduce the observed mean and widths. Again, for all the blazars, an intrinsic log-normal well reproduces the observed data. However, while for NGC 1275 an intrinsic Gaussian is favored over an intrinsic log-normal, the underlying distribution seems more complex than either of the distributions studied in the present work555a detail study using a sample of blazars is under preparation (Z. Shah et al).
| Source | log(Flux) | ||||||
| Name | mean | dof | AD (prob) | ||||
| NGC 1275 | -6.63 0.03 | 0.30 0.03 | 7.9 | 9 | -1.13 | 0.15 | 11.8 () |
| Mrk 421 | -6.70 0.01 | 0.20 0.005 | 1.2 | 9 | -0.13 | 0.12 | 1.1 () |
| B2 1520+31 | -6.54 0.02 | 0.24 0.01 | 2.6 | 8 | -0.61 | 0.12 | 5.4 () |
| PKS 1510-089 | -6.19 0.02 | 0.37 0.02 | 2.6 | 9 | -0.08 | 0.08 | 3.7 () |
| Flux | |||||||
| mean∗ | dof | AD (prob) | |||||
| NGC 1275 | 2.16 0.21 | 1.90 0.18 | 4.7 | 9 | 0.76 | 0.72 | 9.4 () |
| Mrk 421 | 2.01 0.09 | 7.8 0.07 | 11.44 | 9 | 1.67 | 0.71 | 20.5 () |
| B2 1520+31 | 2.99 0.18 | 1.68 0.15 | 7.73 | 8 | 1.16 | 0.52 | 9.3 () |
| PKS 1510-089 | 4.65 0.12 | 5.25 0.09 | 18.5 | 9 | 2.95 | 1.18 | 76.3 () |
| f: flux (ph cm-2 s-1); ∗: (ph cm-2 s-1) | |||||||
| : skewness ( error ); ; dof: degree of freedom | |||||||
| : Anderson Darling test statistics | |||||||
3.2 Gamma-ray PSD
| Source | Power-law | Broken Power-law | |||||||
|---|---|---|---|---|---|---|---|---|---|
| Name | dof | dof | |||||||
| NGC 1275 | -0.96 0.10 | 2.06 | 8 | -0.78 0.10 | -1.98 0.77 | -7.23 0.35 | 1.09 | 6 | |
| Mrk 421 | -1.20 0.11 | 3.36 | 8 | -0.57 0.48 | -1.48 0.20 | -6.30 0.31 | 2.39 | 6 | |
| B2 1520+31 | -1.15 0.09 | 1.80 | 8 | -1.34 0.23 | -0.87 0.34 | -6.74 0.65 | 1.89 | 6 | |
| PKS 1510-089 | -1.06 0.09 | 1.10 | 8 | -1.32 0.12 | -0.39 0.31 | -7.09 0.22 | 0.54 | 6 | |
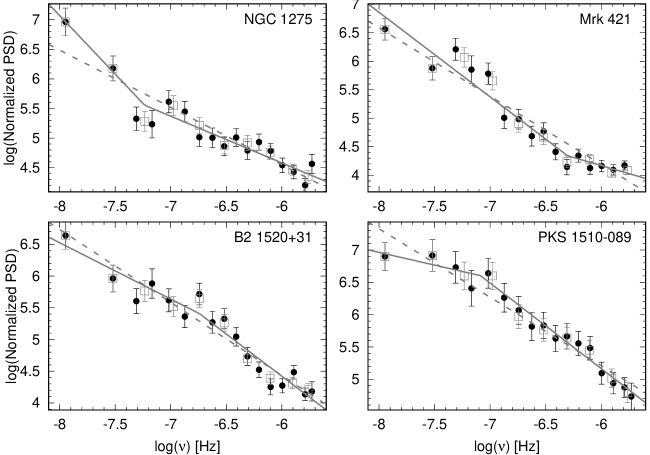
PSD characterizes the variability power of a source and also searches for the presence of any characteristic timescale within the duration of interest. In Figure 3, we present the binned normalized PSDs following the method outlined in Gilfanov & Arefiev (2005), for all the four AGNs with two different bin significances. The binning significance of the gray points are twice as that used for the black data points. The error-bars on the PSDs were estimated by simulating light curves for each source with its observed PSD using the method of Timmer & Koenig (1995). For this, we simulated 1000 realization of light curves for each source and sampled each according to the observed light curve. We then estimated the PSD for each one as mentioned above and binned it using bins of the PSD of the observed light curve. The width of the distribution of the simulated PSDs then provides the error bar for the observed PSD. We fitted these with both a power-law666 and a single broken power-law model777 and the respective best-fit values are reported in Table 2. It should be noted that the broken power-law suggests different break timescales. However, we have quoted only the break which resulted in the least reduced- value.
3.3 RMS Variability
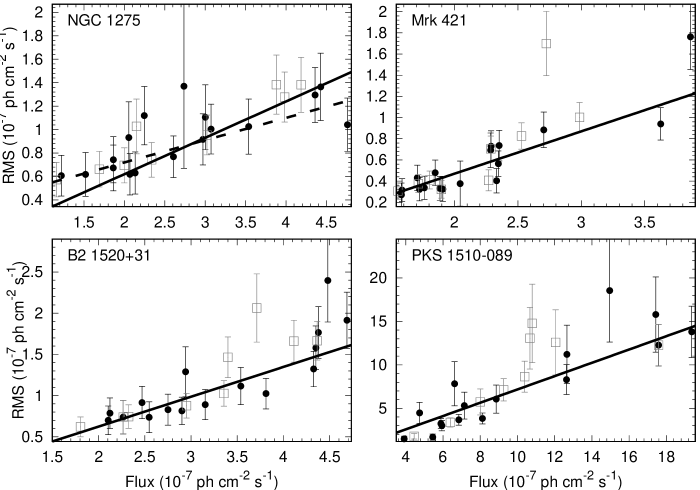
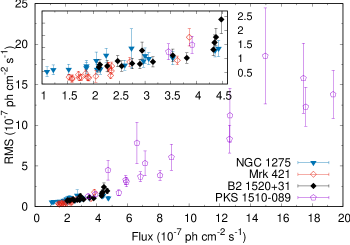
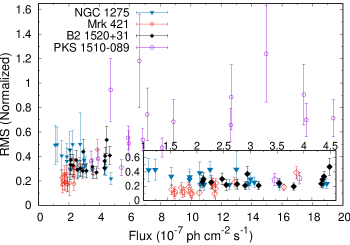
To quantify and compare the degree of intrinsic variability, we have estimated the rms-flux relation for two different binnings of 50 and 100 data per bin. The binning is according to the time-series obtained i.e. time. The estimates are shown, respectively, in black and gray data points in Figure 4. The error-bars consist of both the effect of observed errors and true variability of the source added in quadrature. The later is calculated by simulating 1000 realizations of light curves with 50 and 100 data points for each source and then estimating the rms (Vaughan et al., 2003). We also show the best fit linear model to the rms-flux relation with the fit values reported in Table 3, along with the Spearman correlation and the null hypothesis probability. In Figure 5, we show the rms-flux relation from 50 data per bins for all the sources on one scale in the left panel and the same but with normalized-rms on the right.
| Source | RMS = m*Flux+c | ||||||
|---|---|---|---|---|---|---|---|
| m | c | dof | 50 data/bin | 100 data/bin | |||
| NGC 1275 | 0.19 0.03 | (+3.4 0.8) | 0.38 | 16 | 0.81 () | 0.90 () | |
| 0.32 0.02 | 0.0 | 0.78 | 17 | 0.81 () | 0.90 () | ||
| Mrk 421 | 0.40 0.06 | (-3.3 1.2) | 0.85 | 16 | 0.83 () | 0.90 () | |
| B2 1520+31 | 0.36 0.06 | (-1.1 1.8) | 0.78 | 14 | 0.60 () | 0.95 () | |
| PKS 1510-089 | 0.76 0.09 | (-1.6 0.5) | 1.40 | 15 | 0.90 () | 0.85 () | |
4 DISCUSSION
The range of AGNs behavior in spectral, temporal and spatial domains is huge and diverse, reaching extremes in blazars and sources exhibiting blazar-like characteristics. Studies in time domain over different timescales at -ray energies show that the variability is stochastic (Nakagawa & Mori, 2013; Sobolewska et al., 2014) with variations on all scales from minutes, days to years. Being dominated by the jet emission, imprints from central engine evolve in a non-linear fashion along the jet, leading to varying temporal features and giving rise to an energy dependent variability. Even the most prominent characteristic feature, the broad double-humped shaped SED shows substantial evolution on different timescales and has been used extensively to explore different scenarios of emission processes. On the other hand, a broader understanding of physical processes can be obtained by a careful and systematic investigation of the statistical properties in time domain of well selected sources over long timescales (e.g. Kushwaha et al., 2016) by comparing with current blazars physics as well as with non-blazar counterparts and with other accretion-powered sources.
In a first such attempt at -ray energies, we have characterized the emission from four AGNs: FR I radio-galaxy NGC 1275, BLL Mrk 421, FSRQ B2 1520+31, and FSRQ PKS 1510-089, using one of the best-sampled light curves to date on timescale of days through their flux histograms, rms-fluxes and PSDs, which are used to explore and understand other accretion powered sources like RQAGNs, GXBs, CVs etc at X-rays/UV/optical energies. An important caveat in this analysis is the assumption of stationarity in the light-curves. However, since the PSD power-spectral index is less than in all the cases, this assumption is valid. Moreover, we computed the Augmented Dickey-Fuller test statistics for the null hypothesis that these are non-stationary time series, and the null hypothesis could be rejected with a significance level of less than 1% for each of the light curves.
The systematic investigation performed here reveals a broad range of statistical features with sources exhibiting a flux variability spanning between the extremes (barring non-detections which are ) except for Mrk 421 for which it is . All the histograms exhibit a prominent peak with a typical width of an order of magnitude in terms of flux variability, and an extended low flux tail. For the three blazars, a lognormal fit describes the histogram better compared to a Gaussian, while NGC 1275 distribution is more complex than either (see Table 1). Interestingly, albeit possessing very different duty cycles, all the sources are almost equally variable (, Table 1) in the LAT energy band. A different variability of PKS 1510-089 is due the fact that its flux distribution is bi-lognormal with equal variability in both (Kushwaha et al., 2016) and consistent with values inferred for others here.
Though the histograms are skewed/lognormal, the rms-flux relation is linear for all the sources with large scatters and a flux offset different from zero at the zero rms. Excepf for FR I source NGC 1275, the offset (= -c/m, Table 3) is positive for the others, i.e. the blazars. The negative flux offset for NGC 1275 may be due to random Poisson fluctuations at low fluxes (e.g. Zhang, 2007). Fixing the offset to zero for NGC 1275 leads to a slope value consistent with the two blazars, Mrk 421 and B2 1520+31. However, this remains very different from PKS 1510-089 which is more variable at a given flux level compared to the others (Fig 4 and Table 2). The PSDs, on the other hand, are typical of accretion-powered compact sources showing a scale-free power law profiles over the duration of the study with hints of break (for B2 1520+31 and PKS 1510-089). Such breaks have been clearly observed in the X-ray emission of many AGNs and GXBs and have been found to be correlated with the BH (McHardy et al., 2005, 2006). Here, however, the quality of the data and large scatter suggests many break points and/or break at different frequencies in the case of a single broken power-law fit. Further, the PSD profile in the case of NGC 1275 and Mrk 421 shows rising at long timescales, suggesting increased variability and thus, more power, contrary to expectation, while in the other two, the variability shows decrement but the broken power-law does not improve the fit significantly. Thus, within the duration considered here, the PSDs suggest no scale/break (Table 3, see also Nakagawa & Mori, 2013).
Many models of blazars variability have been proposed in the literature, e.g. shock-in-a-jet (Marscher & Gear, 1985; Böttcher & Dermer, 2010), turbulent extreme multi-zone (Marscher, 2014), needle-in-a-jet (Ghisellini & Tavecchio, 2008), jets-in-a-jet model (Giannios et al., 2009). The latter, i.e. jets-in-a-jet model is also proposed for the -ray emission from radio galaixes (e.g. M 87; Giannios et al., 2010). Though these models explain the spectral and temporal features at different epochs, a statistical study of these features has not been performed except for the minijets-in-a-jet model (Biteau & Giebels, 2012, see also Clausen-Brown & Lyutikov (2012)). These much needed theoretical investigations involving multiple parameters are beyond the scope of present work and are an extensive study in themselves. Thus, we discuss the results in the context of minijets-in-a-jet model and studies where these methods have been used to explore the physics of different sources.
In the minijets-in-a-jet model, emission from identical, independent, but randomly oriented minijets follows a Pareto888 characterized by a probability density function, f(x) = a/x1+a (e.g. Zaliapin et al., 2005) distribution which can produce a wide range of histograms from a power-law (in case of single region) to one consistent with a lognormal (in the case of contributions from a large number of emission regions; e.g. see Fig. 4 & 5 of Biteau & Giebels (2012)), while preserving a linear rms-flux relation in all the cases. This is what we have found in this study with histograms having skewed/lognormal profiles following a linear rms-flux relation and a constant positive flux offset for all except NGC 1275. The model thus proposed for observations of rapid variability in blazars and radio galaxies (e.g. M87) exhibiting blazar-like characteristics is consistent with their long term statistical properties as well. Importantly, emission in this model is result of additive contributions of the underlying physical process, rather than multiplicative as argued by Uttley et al. (2005) for X-ray emission in GXBs and non-jetted AGNs.
With the current set of data, it is not possible to verify whether the high flux end is a power-law. Though the minijets-in-a-jet model appears to explain the long term statistical characteristics, the short term stastical predictions seems contrary to the observations during flares or high flux states. Being additive with identical properties of minijets except for Doppler boosting, two similar -ray flares from the same source should have similar features in other energy bands, contrary to the observations (e.g. Kushwaha et al., 2014). Further, often during flares, the correlated multi-wavelength variability and light curve profiles suggest emission dominated by a single emission region. However, most of the flaring histograms are consistent with a lognormal distribution (e.g. Kushwaha et al., 2017; H.E.S.S. Collaboration et al., 2010), contrary to the statistical results which resemble lognormal only in the case of contribution from a large number of emission regions (Biteau & Giebels, 2012). Additionally, the origin of different proportionality constant for the rms-flux relation as found here needs further investigation and so the PSDs from this model.
The lack of correlation between the mass of the central SMBH and the variability time scale in blazars (e.g. Kushwaha et al., 2016), contrary to what is inferred in other non-jetted AGNs and GXBs (Körding et al., 2006; McHardy et al., 2006, 2005) already suggests that the jet can modify substantially the imprint of feedback from the central engine, if any. However, the occurrences of extended periods of inactivity (few months) at LAT -rays after a long activity period in powerful and highly variable blazars (e.g. 3C 454.3) suggest that the trigger probably depends on feedbacks and ambient effects. The source of such feedback is most likely the energy inputs from central engine. Further, the typical SED modeling assuming single/multiple emission regions suggests that the emission sites are kinetic energy dominated (Ghisellini et al., 2014). But such modeling always fails to explain the radio emission and attributes its origin to a much-extended region compared to the optical, X-rays, and -rays. On the other hand, a magnetic reconnection model in a relativistic fluid approach within the jet, based on inferences from M87 observations suggesting a Poynting flux dominated jet (Hada et al., 2013) seems to better describe the blazars’ SEDs from radio-to-GeV/TeV (Potter & Cotter, 2015). An alternative model suggests that turbulent magnetic reconnection in the coronal region around the accretion disk can explain the emission from compact accreting sources spanning ten orders in the BH mass, but fails for blazars and GRBs (Kadowaki et al., 2015; Singh et al., 2015) i.e. sources with the jet pointing to the line-of-sight, where jet overwhelms the nuclear emission. Interestingly, the statistics of physical quantities related to the Solar X-ray emission and coronal mass ejections (CMEs), understood to be powered by magnetic-reconnection (Aschwanden et al., 2017) also exhibit lognormal properties (Zhang, 2007; Aoki et al., 2003) are consistent with our finding in this work. Moreover, apart from emission and mass ejections, CMEs also lead to energization and generation of non-thermal particles (e.g. Ackermann et al., 2017). Though it is not clear how much of total energy is channeled into the various modes, i.e. emission, matter ejection, non-thermal and relativistic particles. Studies of jets via numerical simulations suggest that both small and large scale fields are capable of powering jets (Singh et al., 2016; Parfrey et al., 2015; Contopoulos et al., 2015; Dexter et al., 2014; Yuan et al., 2009). However, both jet physics and the nature of magnetic being steady or transient (e.g. Frey et al., 2003) are topic of current active investigations.
Lognormality in blazars have been inferred in many sources and in different energy bands, e.g. X-rays (Kushwaha et al., 2016; Giebels & Degrange, 2009; Negoro & Mineshige, 2002), -rays (Kushwaha et al., 2016, 2017; Sinha et al., 2017, 2016; H.E.S.S. Collaboration et al., 2010), optical and IR (Kushwaha et al., 2016). In RQAGNs, GXBs and other accretion-powered sources, the lognormality implying a linear rms-flux relation is normally claimed to be an imprint of multiplicative effect associated with the accretion disk (Uttley et al., 2005; Lyubarskii, 1997). Thus, the skewed/lognormal flux distribution with a linear flux histogram inferred here and as predicted by the minijets-in-a-jet model (Biteau & Giebels, 2012), in combination with highly magnetic systems and rapid variability favors magnetic reconnection origin. Within this, the inferred statistical results for NGC 1275 suggest contribution from a fewer emission regions compared to the blazars. Further, given the jet is being powered by a compact source, the reconnection may or may not reflect the imprint of the central engine. If the emission is triggered as a result of fluctuations/perturbation from the central engine and the jet channels the energy into non-thermal particles, then the observed features may be an imprint of accretion-disk on the jet, as argued in Giebels & Degrange (2009), where the efficiency of the non-linear processes in the jet gives rise to the wide variations as normally observed. Second, the emission may be solely the result of processes intrinsic to the jet without any direct correlation with the central engine except for the energy input. The third potential possibility is if the -ray emission from NGC 1275 is non-boosted from the disk corona, a likely location of the jet launching region as argued in Kadowaki et al. (2015) and Singh et al. (2015), then, similar imprints propagating downstream the jet may be boosted by the jet bulk motion which, by virtue of Doppler beaming, also makes more regions to contribute to the emission, making the flux distribution lognormal. It should be noted that a Doppler boost () of a few to ten can make the NGC 1275 flux () similar to the BL Lacs and FSRQs studied in this work, though the energetics and dynamics details may be different for each source.
5 CONCLUSION
In this work, we explored the -ray variability characteristics of four LAT AGNs: FR I NGC 1275, BLL Mrk 421, FSRQs B2 1520+31 and PKS 1510-089 with all having a near continuous detection in Fermi-LAT over an integration time of 3-days. All the sources show huge variations in flux, ranging 1-2 order of magnitude between the extremes with PSDs consistent with a shot noise powerlaw index of 1. For blazars, a lognormal profile describes flux histogram better compared to a Gaussian while NGC 1275 flux distribution is complex than either. Irrespective of the shape of the flux histogram, the rms-flux relation is linear for all with a positive offset flux for blazars. These statistical features are broadly consistent with the statistical predications of the reconnection powered minijets-in-a-jet model as well as the characteristics of physical quantities associated with the Solar X-ray emission and CMEs. The qualitative similarity of features suggests that both the magnetic field and the jet matter are tightly coupled, except at the highest flux states which are generally believed to be emission from a single region compared to the collective contribution at low flux levels. The results, also indicate that the magnetic reconnection powered emission could be the result of the fluctuations from the accretion-disk, or the jet dynamics, or even the imprint of disk corona, this later, particularly in the case of the non-blazar radio galaxy NGC 1275.
ACKNOWLEDGEMENT
The authors thank the anonymous referee for invaluable comments and suggestions that have improved the article. PK thanks CB Singh for fruitful discussions. This work is partially supported by grants from the Brazilian agency FAPESP 2015/13933-0. EMGDP also acknowledges support from FAPESP (2013/10559-5) and CNPq (306598/2009-4) grants. The Fermi-LAT Collaboration acknowledges generous ongoing support from a number of agencies and institutes that have supported both the development and the operation of the LAT as well as scientific data analysis. These include the National Aeronautics and Space Administration and the Department of Energy in the United States, the Commissariat l’Energie Atomique and the Centre National de la Recherche Scientifique/Institut National de Physique Nuclaire et de Physique des Particules in France, the Agenzia Spaziale Italiana and the Istituto Nazionale di Fisica Nucleare in Italy, the Ministry of Education, Culture, Sports, Science and Technology (MEXT), High Energy Accelerator Research Organization (KEK) and Japan Aeros pace Exploration Agency (JAXA) in Japan, and the K. A. Wallenberg Foundation, the Swedish Research Council and the Swedish National Space Board in Sweden. Additional support for science analysis during the operations phase from the following agencies is a lso gratefully acknowledged: the Istituto Nazionale di Astrofisica in Italy and and the Centre National d’Etudes Spatiales in France.
Fermi
References
- Acero et al. (2015) Acero, F., Ackermann, M., Ajello, M., et al. 2015, ApJS, 218, 23
- Ackermann et al. (2017) Ackermann, M., Allafort, A., Baldini, L., et al. 2017, ApJ, 835, 219
- Aoki et al. (2003) Aoki, S., Yashiro, S., & Shibata, K. 2003, International Cosmic Ray Conference, 5, 2729
- Aschwanden et al. (2017) Aschwanden, M. J., Caspi, A., Cohen, C. M. S., et al. 2017, ApJ, 836, 17
- Atwood et al. (2009) Atwood, W. B., Abdo, A. A., Ackermann, M., et al. 2009, ApJ, 697, 1071
- Biteau & Giebels (2012) Biteau, J., & Giebels, B. 2012, A&A, 548, A123
- Böttcher & Dermer (2010) Böttcher, M., & Dermer, C. D. 2010, ApJ, 711, 445
- Clausen-Brown & Lyutikov (2012) Clausen-Brown, E., & Lyutikov, M. 2012, MNRAS, 426, 1374
- Contopoulos et al. (2015) Contopoulos, I., Nathanail, A., & Katsanikas, M. 2015, ApJ, 805, 105
- de Gouveia dal Pino & Lazarian (2005) de Gouveia dal Pino, E. M., & Lazarian, A. 2005, A&A, 441, 845
- Dexter et al. (2014) Dexter, J., McKinney, J. C., Markoff, S., & Tchekhovskoy, A. 2014, MNRAS, 440, 2185
- Dodds-Eden et al. (2011) Dodds-Eden, K., Gillessen, S., Fritz, T. K., et al. 2011, ApJ, 728, 37
- Edelson et al. (2013) Edelson, R., Mushotzky, R., Vaughan, S., et al. 2013, ApJ, 766, 16
- Fanaroff & Riley (1974) Fanaroff, B. L., & Riley, J. M. 1974, MNRAS, 167, 31P
- Frey et al. (2003) Frey, H. U., Phan, T. D., Fuselier, S. A., & Mende, S. B. 2003, Nature, 426, 533
- Gandhi (2009) Gandhi, P. 2009, ApJ, 697, L167
- Gaskell (2004) Gaskell, C. M. 2004, ApJ, 612, L21
- Ghisellini & Tavecchio (2008) Ghisellini, G., & Tavecchio, F. 2008, MNRAS, 386, L28
- Ghisellini et al. (2014) Ghisellini, G., Tavecchio, F., Maraschi, L., Celotti, A., & Sbarrato, T. 2014, Nature, 515, 376
- Giannios et al. (2010) Giannios, D., Uzdensky, D. A., & Begelman, M. C. 2010, MNRAS, 402, 1649
- Giannios et al. (2009) Giannios, D., Uzdensky, D. A., & Begelman, M. C. 2009, MNRAS, 395, L29
- Giebels & Degrange (2009) Giebels, B., & Degrange, B. 2009, A&A, 503, 797
- Gilfanov & Arefiev (2005) Gilfanov, M., & Arefiev, V. 2005, arXiv:astro-ph/0501215
- Hada et al. (2013) Hada, K., Kino, M., Doi, A., et al. 2013, ApJ, 775, 70
- H.E.S.S. Collaboration et al. (2010) H.E.S.S. Collaboration, Abramowski, A., Acero, F., et al. 2010, A&A, 520, A83
- Hunter (2007) Hunter, J. D. 2007, Matplotlib: A 2D graphics, environment, Computing In Science & Engineering, 9, 90, doi:10.1109/MCSE.2007.55
- Kadowaki et al. (2015) Kadowaki, L. H. S., de Gouveia Dal Pino, E. M., & Singh, C. B. 2015, ApJ, 802, 113
- Khiali et al. (2015) Khiali, B., de Gouveia Dal Pino, E. M., & del Valle, M. V. 2015, MNRAS, 449, 34
- Knuth (2006) Knuth, K. H. 2006, arXiv:physics/0605197
- Körding et al. (2006) Körding, E. G., Jester, S., & Fender, R. 2006, MNRAS, 372, 1366
- Kushwaha et al. (2017) Kushwaha, P., Gupta, A. C., Misra, R., & Singh, K. P. 2017, MNRAS, 464, 2046
- Kushwaha et al. (2016) Kushwaha, P., Chandra, S., Misra, R., et al. 2016, ApJ, 822, L13
- Kushwaha et al. (2014) Kushwaha, P., Singh, K. P., & Sahayanathan, S. 2014, ApJ, 796, 61
- Lyubarskii (1997) Lyubarskii, Y. E. 1997, MNRAS, 292, 679
- Marscher (2014) Marscher, A. P. 2014, ApJ, 780, 87
- Marscher & Gear (1985) Marscher, A. P., & Gear, W. K. 1985, ApJ, 298, 114
- McHardy et al. (2006) McHardy, I. M., Koerding, E., Knigge, C., Uttley, P., & Fender, R. P. 2006, Nature, 444, 730
- McHardy et al. (2005) McHardy, I. M., Gunn, K. F., Uttley, P., & Goad, M. R. 2005, MNRAS, 359, 1469
- McHardy et al. (2004) McHardy, I. M., Papadakis, I. E., Uttley, P., Page, M. J., & Mason, K. O. 2004, MNRAS, 348, 783
- Meyer et al. (2009) Meyer, L., Do, T., Ghez, A., et al. 2009, ApJ, 694, L87
- Meyer et al. (2014) Meyer, L., Witzel, G., Longstaff, F. A., & Ghez, A. M. 2014, ApJ, 791, 24
- Nakagawa & Mori (2013) Nakagawa, K., & Mori, M. 2013, ApJ, 773, 177
- Negoro & Mineshige (2002) Negoro, H., & Mineshige, S. 2002, PASJ, 54, L69
- Parfrey et al. (2015) Parfrey, K., Giannios, D., & Beloborodov, A. M. 2015, MNRAS, 446, L61
- Potter & Cotter (2015) Potter, W. J., & Cotter, G. 2015, MNRAS, 453, 4070
- R Core Team (2013) R Core Team 2013, R: A Language and Environment for Statistical Computing, R Foundation for Statistical Computing, Vienna, Austria, http://www.R-project.org/
- Scaringi et al. (2012) Scaringi, S., Körding, E., Uttley, P., et al. 2012, MNRAS, 421, 2854
- Scaringi et al. (2015) Scaringi, S., Maccarone, T. J., Kording, E., et al. 2015, Science Advances, 1, e1500686
- Singh et al. (2015) Singh, C. B., de Gouveia Dal Pino, E. M., & Kadowaki, L. H. S. 2015, ApJ, 799, L20
- Singh et al. (2016) Singh, C. B., Mizuno, Y., & de Gouveia Dal Pino, E. M. 2016, ApJ, 824, 48
- Sinha et al. (2016) Sinha, A., Shukla, A., Saha, L., et al. 2016, A&A, 591, A83
- Sinha et al. (2017) Sinha, A., Sahayanathan, S., Acharya, B. S., et al. 2017, ApJ, 836, 83
- Sobolewska et al. (2014) Sobolewska, M. A., Siemiginowska, A., Kelly, B. C., & Nalewajko, K. 2014, ApJ, 786, 143
- Tadhunter (2008) Tadhunter, C. 2008, New A Rev., 52, 227
- Timmer & Koenig (1995) Timmer, J., & Koenig, M. 1995, A&A, 300, 707
- Urry & Padovani (1995) Urry, C. M., & Padovani, P. 1995, PASP, 107, 803
- Uttley & McHardy (2001) Uttley, P., & McHardy, I. M. 2001, MNRAS, 323, L26
- Uttley et al. (2005) Uttley, P., McHardy, I. M., & Vaughan, S. 2005, MNRAS, 359, 345
- Van de Sande et al. (2015) Van de Sande, M., Scaringi, S., & Knigge, C. 2015, MNRAS, 448, 2430
- Vaughan et al. (2003) Vaughan, S., Edelson, R., Warwick, R. S., & Uttley, P. 2003, MNRAS, 345, 1271
- Witzel et al. (2012) Witzel, G., Eckart, A., Bremer, M., et al. 2012, ApJS, 203, 18
- Yuan et al. (2009) Yuan, F., Lin, J., Wu, K., & Ho, L. C. 2009, MNRAS, 395, 2183
- Zaliapin et al. (2005) Zaliapin, I. V., Kagan, Y. Y., & Schoenberg, F. P. 2005, Pure and Applied Geophysics, 162, 1187
- Zhang (2007) Zhang, S. N. 2007, Highlights of Astronomy, 14, 41