Evidence of a one-dimensional thermodynamic phase diagram for simple glass-formers
Abstract
The glass transition plays a central role in nature as well as in industry, ranging from biological systems such as proteins and DNA to polymers and metals [1, 2, 3] . Yet the fundamental understanding of the glass transition which is a prerequisite for optimized application of glass formers is still lacking [4, 5, 6, 7]. Glass formers show motional processes over an extremely broad range of timescales, covering more than ten orders of magnitude, meaning that a full understanding of the glass transition needs to comprise this tremendous range in timescales [8, 9, 10]. Here we report on first-time simultaneous neutron and dielectric spectroscopy investigations of three glass-forming liquids, probing in a single experiment the full range of dynamics. For two van der Waals liquids we locate in the pressure-temperature phase diagram lines of identical dynamics of the molecules on both second and picosecond timescales. This confirms predictions of the isomorph theory [11] and effectively reduces the phase diagram from two to one dimension. The implication is that dynamics on widely different timescales are governed by the same underlying mechanisms.
Glass and Time, IMFUFA, Department of Science and Environment, Roskilde University, Postbox 260, DK-4000 Roskilde, Denmark
Institute of Physics, University of Silesia, ul. Uniwersytecka 4, 40-007 Katowice, Poland
Institut Laue-Langevin, 71 avenue des Martyrs, CS 20156, 38042 Grenoble cedex 9, France
Glasses are formed when the molecular motions of a liquid become so slow that it effectively becomes a solid. When the glass transition of a liquid is approached, the dynamics of the molecules spreads out like a folding fan covering more than ten orders of magnitude. There are at least three overall contributions to the dynamics of glass-forming liquids: 1) vibrations, 2) fast relaxations on picosecond timescales, and 3) the structural alpha relaxation, which has a strongly temperature-dependent timescale. The glass transition occurs when the alpha relaxation is on a timescale of hundreds of seconds and therefore completely separated from the two fast contributions to dynamics. Nonetheless, both theoretical [8, 12] and experimental results [9, 13, 10, 14, 15] have suggested that fast and slow dynamics are intimately connected. A complete understanding of the glass transition therefore necessitates a full understanding of all these dynamic processes.
During the past 15 years, pressure has increasingly been introduced to study dynamics of glass-forming liquids in order to disentangle thermal and density contributions to the dynamics. The most striking finding from high-pressure studies is that the alpha relaxation, both its timescale and spectral shape is, for a large number of different liquids, uniquely given by the parameter , where is a material specific constant [16, 17, 18, 19]. This scaling behaviour can be explained by the isomorph theory [20, 11], which, moreover, predicts the value of (21). The fundamental claim of isomorph theory is the existence of isomorphs. Isomorphs are curves in the phase diagram along which all dynamic processes and structure are invariant. Put in other words, the phase diagram is predicted to be one dimensional with respect to structure and dynamics on all timescales, with the governing single variable being . Isomorph theory has been very successful in describing Lennard-Jones type computer simulated liquids, e.g. refs. (22, 23). Experimental studies of isomorph theory predictions require high-precision high-pressure measurements and are still limited [21, 24, 25, 26]. Consequently, it remains open whether isomorph theory holds for real molecular liquids.
The only systems that obey isomorph theory exactly are those with repulsive power law interaction potentials which do not, of course, describe real systems. Hence, isomorph theory is approximate in its nature and expected to work for systems without directional bonding and competing interactions [11]. With this in mind, we have studied the dynamics on three well-studied glass formers representing non-associated liquids and liquids with directional bonding, two van der Waals bonded liquids (vdW-liquids): PPE (5-polyphenyl ether) and cumene (isopropyl benzene), and a hydrogen bonding (H-bonding) liquid: DPG (dipropylene glycol).
In this work, we use a new high-pressure cell for simultaneous measurements of the fast dynamics by neutron spectroscopy and the alpha relaxation by dielectric spectroscopy to demonstrate that for the studied vdW-liquids, the three mentioned distinct dynamic components are invariant along the same lines in the phase diagram. This is the first direct experimental evidence for the existence of isomorphs, and it proves that the phase diagram of simple vdW-liquids is one dimensional with respect to dynamics. Unlike the scaling behaviour of the alpha relaxation dynamics, which is often found to hold surprisingly well in H-bonding systems [25, 27, 26], we only find invariance of the fast relaxational and vibrational dynamics on picosecond timescales in the vdW-liquids. For the single investigated H-bonding system, DPG, we make a different observation, as expected based on isomorph theory.
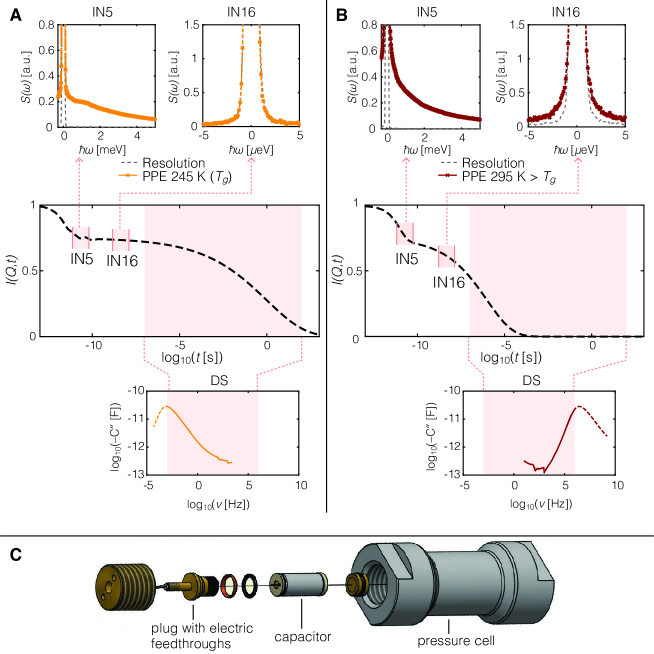
Dynamics from picosecond to kilosecond cannot be measured with one single technique; several complementary techniques are required. A glass-forming liquid is in metastable equilibrium and the dynamics is very sensitive to even small differences in pressure and temperature. The high viscosity of the liquid close to the glass transition temperature, , makes the transmission of isotropic pressure non-trivial, as pressure gradients are easily generated. In order to ensure that the different dynamics are measured under identical conditions, we have therefore developed a cell for doing simultaneous dielectric spectroscopy (DS) and neutron spectroscopy (NS) under high pressure (Fig. 1). The experiments were carried out on spectrometers at the Institut Laue-Langevin (ILL) on the time-of-flight (TOF) instruments IN5 and IN6. The different NS instruments access different timescales with IN5 giving information on the 10 ps scale, while a backscattering (BS) instrument like IN16 accesses 1 ns dynamics. DS provides fast (minutes) and high accuracy measurements of the dynamics from microsecond to 100 s.
The dynamics measured with the different techniques are illustrated in Fig. 1a and b for PPE. The center panels of (a) and (b) are sketches of the incoherent intermediate scattering function, , while the top and bottom panel show raw data. At (Fig. 1a), no broadening is observed on nanosecond timescales (IN16) corresponding to a plateau in , on picosecond timescales from IN5 we observe contributions from fast relaxational processes and vibrations, whereas the alpha relaxation is seen in DS at much longer timescales, a difference of more than 10 orders of magnitude. As the temperature is increased, the processes merge (Fig. 1b), and relaxation dominates the signal in all three spectrometers.
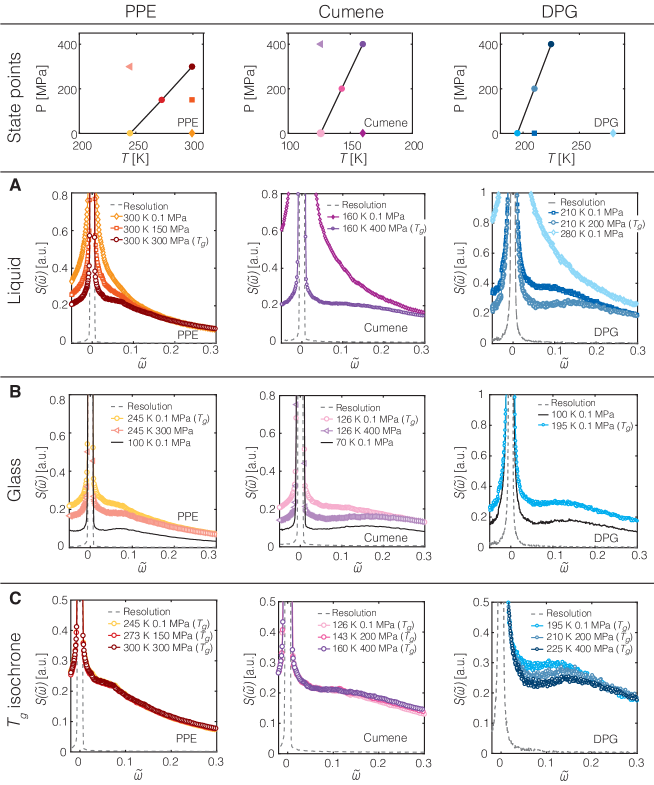
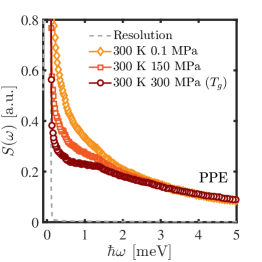
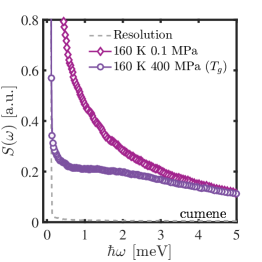
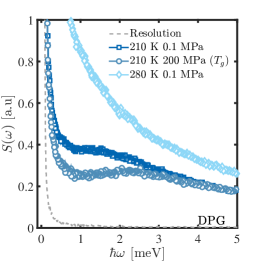
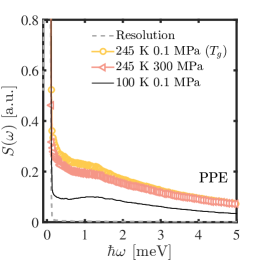
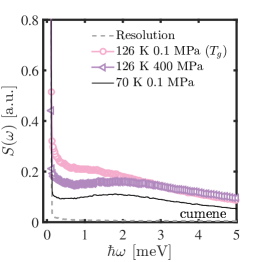
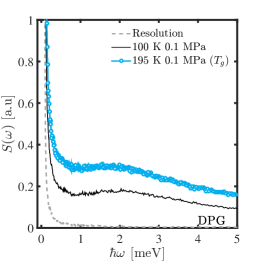
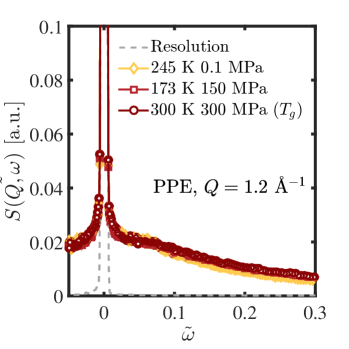
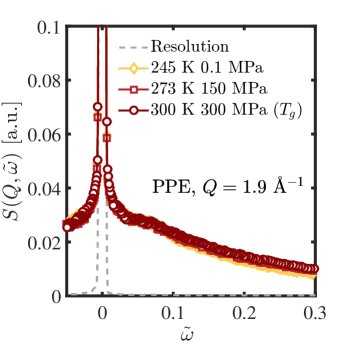
Picosecond dynamics measured on IN5 and IN6 are presented in Fig. 2. We observe the same trend for all spectra for all values of wave vector (Extended Data Fig. 2), and have summed over to improve statistics. All spectra are shown on the same -axis. Motivated by isomorph theory, the energy scale is shown in reduced units, effectively [11]. The effect of scaling is small, though visible, in the studied range of and . The data is shown on an absolute energy scale in the Extended Data Fig. 1.
For all three samples in row (a) Fig. 2, which shows dynamics in the liquid, we observe the extreme scenarios sketched in Fig. 1. At low pressure, relaxational contributions are dominating (Fig. 1b). At the glass transition, we find only fast relaxational and vibrational contributions (Fig. 1a). The fast relaxational contributions decrease in the glassy state (Fig. 2b), leaving the excess vibrational density of states, which shows up as the so-called Boson peak [28], as the dominant contribution (black full lines in Fig. 2b). For all three samples, we observe different dependencies on temperature and pressure for the three contributions to the dynamics, such that their relative contributions vary along both isobars and isotherms.
Sokolov et al. [29] studied seven different liquids with Raman spectroscopy, both H-bonding and vdW-liquids. In contrast to what we see, they observe a correlation between pressure-induced variations in the fast relaxation and the Boson peak. Our observations are in agreement with those shown by neutron spectroscopy for ortho-terphenyl in (30), namely that the and dependencies are different for the three contributions to the dynamics.
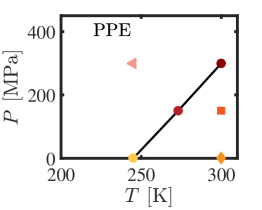
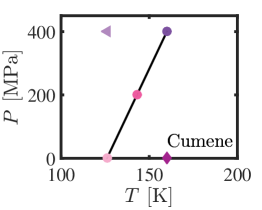
All glass formers have isochrones which are lines in the -phase diagram with constant alpha relaxation time, . If isomorphs exist in a liquid, these coincide with the isochrones, since all dynamic processes on all timescales and of all dynamic variables are invariant along an isomorph. Thus, experimentally we can identify candidates for isomorphs by the isochrones. We use DS effectively as a ’clock’, which identifies the alpha relaxation time from the dipole-dipole correlation function, while simultaneously measuring the picosecond dynamics with incoherent neutron scattering probing the particle self-correlation.
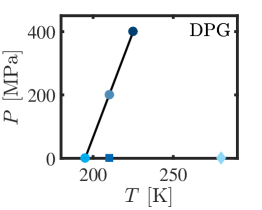
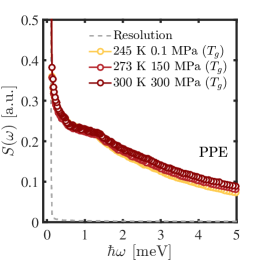
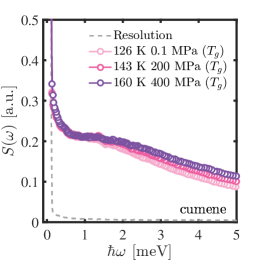
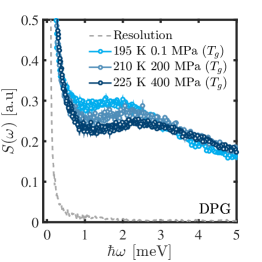
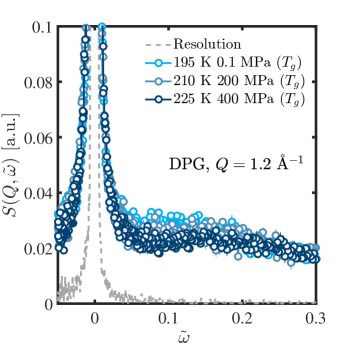
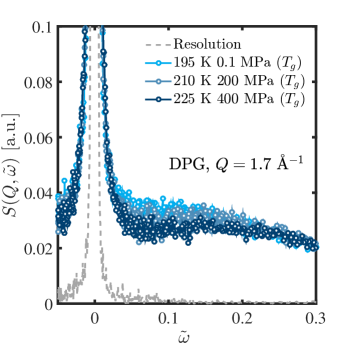
Row (c) in Fig. 2 shows the picosecond dynamics measured along the glass transition isochrone defined as when s found from DS. We observe superposition of the spectra at the picosecond timescale, thus invariance of the dynamics, for the two vdW-liquids (PPE and cumene). This is in agreement with the prediction of the isomorph theory and it is particularly striking because at , fast relaxational and vibrational motion are completely separated in timescale from the alpha relaxation as illustrated in Fig. 1a. In contrast, for the H-bonding liquid (DPG) we find a clear shift towards higher energy and an intensity decrease of the Boson peak along the isochrone. The lack of superposition in the H-bonding system demonstrates that the superposition seen in the vdW-liquids is non-trivial. Thus, the superposition observed in the vdW-liquids is a genuine signature of the isomorphs in these liquids.
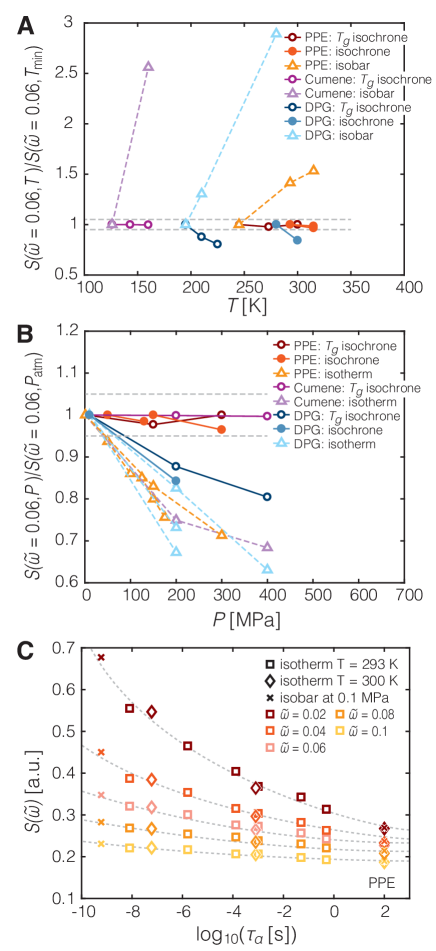
To compare more state points, including shorter alpha-relaxation time isochrones (s), isotherms and isobars, we plot the corresponding inelastic intensities at a fixed reduced energy () as a function of temperature and pressure (Fig.3a and b). Along the investigated isochrones the inelastic intensity at or ps is found to be invariant for the vdW-liquids. Again the H-bonding liquid behaves differently and its picosecond dynamics varies along the isochrones. This confirms the isomorph prediction of spectral superposition of fast relaxation, vibrations/Boson peak and alpha relaxation for the vdW-liquids: both when there is timescale separation and when the processes are merged.
The power of isomorph theory is that the phase diagram becomes one dimensional; the dynamics only depend on which isomorph a state point is on and not explicitly on temperature and pressure (or density). Since isomorphs are isochrones the other dynamic components should become a unique function of the alpha relaxation time. In Fig. 3(c) we plot the intensity of the picosecond dynamics along isotherms and isobars as a function of the dielectric alpha relaxation time at fixed reduced energies (). The data from each energy collapses in this plot, illustrating that, as predicted, all the dynamics is governed by one parameter.
Previously suggested connections between fast and slow dynamics, e.g. via the temperature dependence of properties [7, 15], often suggest a causality, where the fast dynamics controls the slow dynamics. In contrast, the connection between slow and fast dynamics shown in this work does not tell us if one controls the other or if they are simply controlled by the same underlying mechanism.
Isomorph theory is approximate in its nature, and the isomorphs of real physical systems are approximate. The fact that the isomorph prediction works for dynamics which is separated in timescale by more than ten orders of magnitude, tells us that whatever governs this dynamics is controlled by properties of the liquid that obey the isomorph scale invariance. There is a consensus that the alpha relaxation is cooperative, fast relaxations are normally understood as cage rattling, whereas it has been heavily debated whether or not the Boson peak is localized [28, 29, 31, 32]. It is clear from the spectra in Fig. 2 that fast relaxation and Boson peak are different in nature because their relative intensities vary along isotherms and isobars, and that these two types of fast dynamics are distinctively different from the structural alpha relaxation. Yet all of these dynamic features are controlled by the single parameter . Our finding implies that a universal theory for the glass-transition needs to be consistent with the one-dimensional phase diagram coming out of isomorph theory.
References
- [1] Khodadadi, S. & Sokolov, A. P. Protein dynamics: from rattling in a cage to structural relaxation. Soft Matter 11, 4984–4998 (2015). URL http://dx.doi.org/10.1039/C5SM00636H.
- [2] Frick, B. & Richter, D. The microscopic basis of the glass transition in polymers from neutron scattering studies. Science 267, 1939–1945 (1995). URL http://www.jstor.org/stable/2886442.
- [3] Luo, P., Wen, P., Bai, H. Y., Ruta, B. & Wang, W. H. Relaxation decoupling in metallic glasses at low temperatures. Physical Review Letters 118, 225901 (2017). URL https://link.aps.org/doi/10.1103/PhysRevLett.118.225901.
- [4] Albert, S. et al. Fifth-order susceptibility unveils growth of thermodynamic amorphous order in glass-formers. Science 352, 1308–1311 (2016). URL http://science.sciencemag.org/content/352/6291/1308.
- [5] Ediger, M. D. & Harrowell, P. Perspective: Supercooled liquids and glasses. The Journal of Chemical Physics 137, 080901 (2012). URL http://dx.doi.org/10.1063/1.4747326.
- [6] Berthier, L. & Biroli, G. Theoretical perspective on the glass transition and amorphous materials. Reviews of Modern Physics 83, 587–645 (2011). URL https://link.aps.org/doi/10.1103/RevModPhys.83.587.
- [7] Dyre, J. C. Colloquium: The glass transition and elastic models of glass-forming liquids. Reviews of Modern Physics 78, 953–972 (2006). URL https://journals.aps.org/rmp/abstract/10.1103/RevModPhys.78.953.
- [8] Bengtzelius, U., Götze, W. & Sjølander, A. Dynamics of supercooled liquids and the glass transition. Journal of Physics C: Solid State Physics 17, 5915 (1984). URL http://stacks.iop.org/0022-3719/17/i=33/a=005.
- [9] Buchenau, U. & Zorn, R. A relation between fast and slow motion in glassy and liquid selenium. Europhysics Letters 18, 523–528 (1992). URL http://stacks.iop.org/0295-5075/18/i=6/a=009.
- [10] Scopigno, T., Ruocco, G. & Sette, F. Is the fragility of a liquid embedded in the properties of its glass? Science 302, 849–852 (2003). URL https://www.nature.com/articles/s41598-017-01464-2.
- [11] Dyre, J. C. Hidden scale invariance in condensed matter. The Journal of Physical Chemistry B 118, 10007–10024 (2014). URL http://pubs.acs.org/doi/abs/10.1021/jp501852b.
- [12] Götze, W. Complex Dynamics of Glass-Forming Liquids – A Mode-Coupling Theory (Oxford University Press, Oxford, 2009).
- [13] Sokolov, A. P., Rössler, E., Kisliuk, A. & Quitmann, D. Dynamics of strong and fragile glass formers: Differences and correlation with low-temperature properties. Physical Review Letters 71, 2062 (1993). URL https://doi.org/10.1103/PhysRevLett.71.2062.
- [14] Novikov, V. N. & Sokolov, A. P. Poisson’s ratio and the fragility of glass-forming liquids. Nature 431, 961–963 (2004). URL https://www.nature.com/nature/journal/v431/n7011/full/nature02947.html.
- [15] Larini, L., Ottochian, A., de Michele, C. & Leporini, D. Universal scaling between structural relaxation and vibrational dynamics in glass-forming liquids and polymers. Nature Physics 4, 42–45 (2008). URL https://doi.org/10.1103/PhysRevE.86.041502.
- [16] Tölle, A., Schober, H., Wuttke, J., Randl, O. G. & Fujara, F. Fast relaxation in a fragile liquid under pressure. Physical Review Letters 80, 2374–2377 (1998). URL https://link.aps.org/doi/10.1103/PhysRevLett.80.2374.
- [17] Tarjus, G., Kivelson, D., Mossa, S. & Alba-Simionesco, C. Disentangling density and temperature effects in the viscous slowing down of glassforming liquids. The Journal of Chemical Physics 120, 6135–6141 (2004). URL http://dx.doi.org/10.1063/1.1649732.
- [18] Roland, C. M., Hensel-Bielowka, S., Paluch, M. & Casalini, R. Supercooled dynamics of glass-forming liquids and polymers under hydrostatic pressure. Reports on Progress in Physics 68, 1405–1478 (2005). URL http://stacks.iop.org/0034-4885/68/i=6/a=R03.
- [19] Casalini, R. & Roland, C. Determination of the thermodynamic scaling exponent for relaxation in liquids from static ambient-pressure quantities. Physical Review Letters 113, 085701 (2014). URL https://journals.aps.org/prl/abstract/10.1103/PhysRevLett.113.085701.
- [20] Gnan, N., Schrøder, T. B., Pedersen, U. R., Bailey, N. P. & Dyre, J. C. Pressure-energy correlation in liquids. IV. “Isomorphs” in liquid phase diagrams. Journal of Chemical Physics 131, 234504 (2009). URL http://www.jstor.org/stable/2886442.
- [21] Gundermann, D. et al. Predicting the density-scaling exponent of a glass-forming liquid from Prigogine-Defay ratio measurements. Nature Physics 7, 816–821 (2011). URL http://dx.doi.org/10.1038/nphys2031.
- [22] Bacher, A. K., Schrøder, T. B. & Dyre, J. C. Explaining why simple liquids are quasi-universal. Nature Communications 5, 5424 (2014). URL http://dx.doi.org/10.1038/ncomms6424.
- [23] Pedersen, U. R., Costigliola, L., Bailey, N. P., Schrøder, T. B. & Dyre, J. C. Thermodynamics of freezing and melting. Nature Communications 7, 12386 (2016). URL http://dx.doi.org/10.1038/ncomms12386.
- [24] Xiao, W., Tofteskov, J., Christensen, T. V., Dyre, J. C. & Niss, K. Isomorph theory prediction for the dielectric loss variation along an isochrone. Journal of Non-Crystalline Solids 407, 190 (2015). URL https://doi.org/10.1016/j.jnoncrysol.2014.08.041.
- [25] Adrjanowicz, K., Pionteck, J. & Paluch, M. Isochronal superposition and density scaling of the intermolecular dynamics in glass-forming liquids with varying hydrogen bonding propensity. Royal Society of Chemistry Advances 6, 49370–49375 (2016). URL http://dx.doi.org/10.1039/C6RA08406K.
- [26] Romanini, M. et al. Thermodynamic scaling of the dynamics of a strongly hydrogen-bonded glass-former. Scientific Reports 7, 1346 (2017). URL https://www.nature.com/articles/s41598-017-01464-2.
- [27] Puosi, F., Chulkin, O., Bernini, S., Capaccioli, S. & Leporini, D. Thermodynamic scaling of vibrational dynamics and relaxation. The Journal of Chemical Physics 145, 234904 (2016). URL http://aip.scitation.org/doi/abs/10.1063/1.4971297.
- [28] Chumakov, A. I. et al. Equivalence of the boson peak in glasses to the transverse acoustic van hove singularity in crystals. Physical Review Letters 106, 225501 (2011). URL https://link.aps.org/doi/10.1103/PhysRevLett.106.225501.
- [29] Hong, L. et al. Influence of pressure on quasielastic scattering in glasses: Relationship to the boson peak. Physical Review Letters 102, 145502 (2009). URL https://link.aps.org/doi/10.1103/PhysRevLett.102.145502.
- [30] Patkowski, A., Lopes, M. M. & Fischer, E. W. Pressure dependence of the high-frequency light scattering susceptibility of ortho-terphenyl: A mode coupling analysis. The Journal of Chemical Physics 119, 1579–1585 (2003). URL http://dx.doi.org/10.1063/1.1581847.
- [31] Wyart, M. Correlations between vibrational entropy and dynamics in liquids. Physical Review Letters 104, 095901 (2010). URL https://link.aps.org/doi/10.1103/PhysRevLett.104.095901.
- [32] Ferrante, C. et al. Acoustic dynamics of network-forming glasses at mesoscopic wavelengths. Nature Communications 4, 1793 (2013). URL http://dx.doi.org/10.1038/ncomms2826.
- [33] Angell, C. Relaxation in liquids, polymers and plastic crystals – strong/fragile patterns and problems. Journal of Non-Crystalline Solids 131, 13 – 31 (1991). URL http://www.sciencedirect.com/science/article/pii/0022309391902669.
- [34] Grzybowski, A., Grzybowska, K., Paluch, M., Swiety, A. & Koperwas, K. Density scaling in viscous systems near the glass transition. Physical Review E 83, 041505 (2011). URL https://link.aps.org/doi/10.1103/PhysRevE.83.041505.
- [35] Gundermann, D. Testing predictions of the isomorph theory by experiment (2013). URL http://glass.ruc.dk/pdf/phd_afhandlinger/ditte_thesis.pdf. PhD thesis, Roskilde University, DNRF centre “Glass & Time”.
- [36] Barlow, A. J., Lamb, J. & Matheson, A. J. Viscous behaviour of supercooled liquids. Proceedings of the Royal Society of London. Series A, Mathematical and Physical Sciences 292, 322–342 (1966).
- [37] Bridgman, P. W. Further rough compressions to 40,000 kg/cm3, especially certain liquids. Proceedings of the American Academy of Arts and Sciences 77, 129–146 (1949).
- [38] Minassian, L. T., Bouzar, K. & Alba, C. Thermodynamic properties of liquid toluene. Journal of Physical Chemistry 92, 487–493 (1988).
- [39] Wilson, L. C., Wilson, H. L., Wilding, W. V. & Wilson, G. M. Critical point measurements for fourteen compounds by a static method and a flow method. Journal of Chemical & Engineering Data 41, 1252–1254 (1996). URL http://dx.doi.org/10.1021/je960052x. http://dx.doi.org/10.1021/je960052x.
This work was supported by the Danish Council for Independent Research (Sapere Aude: Starting Grant). We gratefully acknowledge J. Dyre for fruitful discussions and technical support from the workshop at IMFUFA and the SANE group at the ILL.
The authors declare that they have no competing financial interests.
Correspondence and requests for materials should be addressed to K. Niss. (email: kniss@ruc.dk).
Methods section for
”Evidence of a one-dimensional thermodynamic phase diagram for simple glass-formers”
H.W. Hansen1, A. Sanz1, K. Adrjanowicz2, B. Frick3 & K. Niss1∗
Materials
Isopropyl benzene (cumene) and dipropylene glycol (DPG) were purchased from Sigma Aldrich, and 5-polyphenyl ether (PPE) was purchased from Santolubes. All three samples were used as acquired.
The glass transition for the three samples is found from dielectric spectroscopy and defined as when the maximum of the loss peak corresponds to s, where . At atmospheric pressure, the glass transition temperature is 245 K for PPE, 126 K for cumene, and 195 K for DPG.
The traditional way of quantifying how much the alpha relaxation time, or the viscosity, as a function of temperature deviates from Arrhenius behavior is given by the fragility [33], defined as:
| (1) |
For the two van der Waals liquids, the fragility at ambient pressure is for PPE and for cumene. The hydrogen-bonding liquid DPG has fragility .
Methods
All experiments were carried out at the Institut Laue-Langevin (ILL) on the time-of-flight instruments IN5 and IN6. In neutron spectroscopy, the different instrumental energy resolutions give access to different dynamical timescales; the coarser the energy resolution the faster the time window accessible: 0.1 meV on IN5 and IN6 corresponds to 10 ps. DS provides fast (minutes) and high accuracy measurements of the dynamics from microsecond to 100 s. Details on the high-pressure cell for doing simultaneous dielectric and neutron spectroscopy can be found in the forthcoming publication.
In Fig. 2, we presented data on PPE and cumene from IN5 and on DPG from IN6 (hence the difference in statistics). All data was measured with a wavelength of 5 Å and an energy resolution 0.1 meV, corresponding to a timescale of approximately 10 picoseconds. All spectra have been corrected in the conventional way by normalizing to monitor and vanadium, subtracting background, and correcting for self-shielding, self-absorption and detector efficiency using LAMP, a data treatment program developed at the ILL. The data has then been grouped for constant wavevector in steps of 0.1 Å-1 in the range 1.2-1.9 Å-1 for the IN5 data (PPE and cumene) and in the range 1.2-1.7 Å-1 for the IN6 data (DPG) and is presented in Fig. 2 as a sum over . Data are shown as measured in Extended Data Fig. ED1 on an absolute energy scale. No scaling has been done on the axis in of any of the spectra, i.e. all spectra are plotted on the same scale. Comparing Fig. S1 to Fig. 2, the effect of plotting data in reduced units is visible at higher energy transfer. The same picture is observed for all spectra for each value of , and we have therefore summed over in the data shown in Fig. 2 to improve statistics. An example of spectra along the glass transition at different for PPE and DPG is shown in Extended Data Fig. ED2.
Reduced units
According to isomorph theory, the relevant scale to look at is in reduced units 11. The reduced energy units used in Fig. 2 and Extended Data Fig. ED2 are given by
| (2) |
where is the energy transfer, setting . is Boltzmann’s constant and is temperature. Here, is the number density and is the average particle mass, the latter assumed constant. We set . Effectively, this becomes
| (3) |
where is now the volumetric mass density.
Just like reduced energy units, wave vector or momentum transfer should also be presented in reduced units:
| (4) |
But as the density changes are in the percent range in this study, scaling of will be around 1% and will be within the uncertainty of the data and is therefore neglected.
Calculating density
Equations of state (EOS) have been used to calculate the temperature and pressure dependence of the density. For DPG, the EOS is taken from [34]. For PPE, a fit to the Tait equation from PVT data from [35] has been used to obtain the density:
| (5) |
where is in g/cm3 and equal to , the specific volume, is pressure in MPa and is temperature in ∘C. The fitting parameters are , , , and . For cumene, density has been reported in [36] in the temperature range K at atmospheric pressure, a linear dependence was found in this range encapsulated in the equation,
| (6) |
where is a constant given for cumene as K-1, and is the density at a reference temperature of K, . This linearity is assumed to hold to the glass transition temperature at ambient pressure, 126 K. The pressure dependence of density was measured in [37] up to 4 GPa at room temperature. To obtain an EOS, the compressibility and expansivity in the whole temperature range is found using the approach from [38] for toluene. The pressure and temperature dependence of the is calculated at temperatures higher than 240 K using the formula in [38] for toluene rescaled to cumene by using its critical temperature and density, K and kPa [39].
For all three samples, the density changes are in the percent range in the temperature-pressure range of this study. The PVT data and EOS are only used for scaling on the energy axis of the data, where the reduced energy units contain the cubic root of the density. Hence, the scaling is in practice mainly with temperature, and the use of EOS therefore does not alter with the overall conclusion.
Higher temperature isochrones
High temperature isochrones with alpha relaxation time s shown in Fig. 3 were done for PPE and DPG, but not for cumene; because cumene crystallizes easily in the region above and below the melting point.
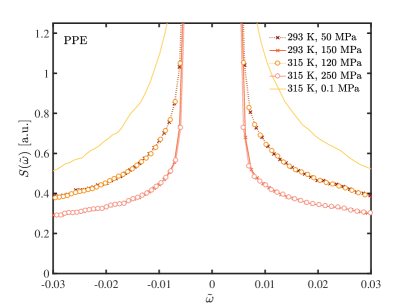
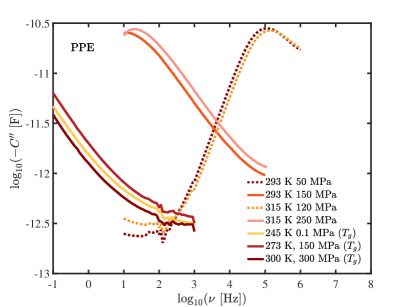
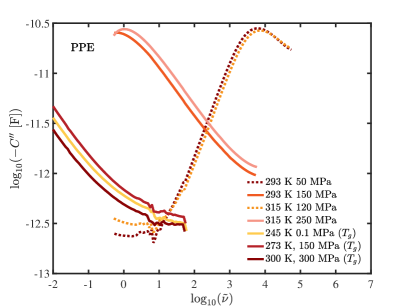
In Extended Data Fig. ED3 and ED4, examples of higher temperature isochrones, where relaxation is dominating in the picosecond dynamics, are given for PPE. In Extended Data Fig. ED3, the imaginary part of the capacitance used to find isochrones are shown, both at the glass transition and for faster relaxation times. Extended Data Fig. ED4 shows the corresponding NS spectra to the two high-temperature isochrones shown in Extended Data Fig. ED3. We observe total invariance of the spectra along isochrones. Again, no scaling has been done in the -direction, and in this interval, the effect of plotting in reduced units on the -axis is negligible.
a
b
c
a
 b
b
a
 b
b