Chemical Study of the Metal-rich Globular Cluster NGC 5927
Abstract
Globular Clusters (GCs) are natural laboratories where stellar and chemical evolution can be studied in detail. In addition, their chemical patterns and kinematics can tell us wich Galactic structure (Disk, Bulge, Halo or extragalactic) the cluster belongs to. NGC 5927 is one of most metal-rich GCs in the Galaxy and its kinematics links it to the Thick Disk. We present abundance analysis based on high resolution spectra of 7 giant stars. The data were obtained using FLAMES/UVES spectrograph mounted on UT2 telescope of the European Southern Observatory. The principal motivation of this work is to perform a wide and detailed chemical abundance analysis of the cluster and look for possible Multiple Populations (MPs). We determined stellar parameters and measured 22 elements corresponding to light (Na, Al), alpha (O, Mg, Si, Ca, Ti), iron-peak (Sc, V, Cr, Mn, Fe, Co, Ni, Cu, Zn) and heavy elements (Y, Zr, Ba, Ce, Nd, Eu). We found a mean iron content of [Fe/H]=-0.47 0.02 (error on the mean). We confirm the existence of MPs in this GC with an O-Na anti-correlation, and moderate spread in Al abundances. We estimate a mean [/Fe]=0.25 0.08. Iron-peak elements shows no significant spread. The [Ba/Eu] ratios indicate a predominant contribution from SNeII for the formation of the cluster.
keywords:
Galaxy: Globular Cluster:individual: NGC 5927 - stars: abundances1 INTRODUCTION
Galactic Globular Clusters (GGCs) are considered as natural laboratories for the study of different stellar evolution processes, since they are among the oldest objects in the universe. We can compare GCs with the different components of the Milky Way looking for inter-relationships in their chemistry and/or kinematics. The Galaxy is made-up by at least 3 main structures: The Halo, the Bulge and the Disk. This last one is suggested to have there major components: Thick Disk and Thin Disk (Gilmore &
Reid, 1983). The differences between the Galaxy components relies on their metallicity, abundance enhancements, age and kinematics among others.
When we talk about the Galactic Bulge, we are referring to an important structure of the Milky Way which mass estimations goes from the 10% (Oort, 1977) to the 25% Sofue
et al. (2009) of the total stellar mass in the Milky Way. Comparing the Bulge field stars with metal-rich GCs, Ortolani et al. (1995) and Zoccali
et al. (2003) have estimated an age about Gyr for the bulk of the metal-rich population of the Galactic Bulge and its kinematics behaviour is dominated by a rotationally supported system with a rotational peak of 75 km s-1 (Minniti, 1996; Beaulieu et al., 2000; Rich
et al., 2007), in addition to a high velocity dispersion (Minniti, 1996) which decreases along the distance from the Galactic center.
Meanwhile, the Thin and Thick Disk have different stellar populations where Gilmore &
Reid (1983) observed for the first time these two populations by studying the stellar density at different Galactic latitudes towards the Galactic North pole. Many observational evidence (Gratton et al., 2000; Mashonkina &
Gehren, 2001; Reddy et al., 2003, 2006; Adibekyan et al., 2012) indicates that both sub-structures have different chemical origins and have passed through different chemical evolution. The Thick disk host old stars within 8 to 10 Gyr while the Thin disk stars show younger ages (Bensby et al., 2003; Schuster et al., 2006).
Not long ago, stars in GCs were originally considered coeval (Renzini & Buzzoni, 1986) and initially chemically homogeneous. Today, we know that GCs host Multiple Populations (MPs) in their stellar content and both photometric and spectroscopic methods are used in order to understand this phenomenon. Using spectroscopy we can observe spreads in the light element contents (C, N, O, Na, Mg, Al) forming patterns between them as correlations or anti-correlations. These signatures come from different reactions (Denisenkov & Denisenkova, 1989; Langer et al., 1993) which are simultaneously active, depleting some light elements and enhancing others. These reactions are carried out by proton capture during Hydrogen burning at high temperature (K for CNO chain, K for NeNa chain and K for MgAl chain) achieved in relatively massive stars (M 2M⊙ ). The feature best studied is the Na-O anti-correlation (Carretta et al., 2009a; Carretta et al., 2009b). Every GGC we know so far follows this pattern with the only exception of Ruprecht 106, but the origin of this cluster may be extragalactic (Villanova et al., 2013). This anti-correlation between Na and O is probably due to the evolution of massive stars in early stages of the GC. A First Generation (FG) of stars (i.e. Na-poorer O-rich) polluted the intra-cluster gas left behind with processed material and then a second generation (SG) of stars was formed being Na-richer and O-pooer (Caloi & D’Antona, 2011). There are several candidates for this light element polluter: intermediate mass AGB stars (D’Antona et al., 2002), fast rotating massive MS stars (Decressin et al., 2007) and massive binaries (de Mink et al., 2009). On the other hand, heavy elements are produced by neutron capture. This process can be slow or rapid and is carried out in AGB stars or SNeII explosions respectively. The relative abundances of neutron capture elements give us an idea about the process that contributed more in the chemical evolution of the cluster as we will discuss later.
In this paper we present a chemical study of the GC NGC 5927 based on high resolution spectra taken from UVES. This cluster is very old with an age of 12.25 Gyr (Dotter
et al., 2010). This means that it was formed during the earliest stages of the Galaxy formation and could give us a hint about how the initial material got processed chemically. About kinematics, Casetti-Dinescu
et al. (2007) and Allen
et al. (2008) concluded that the orbital parameters of NGC 5927 are consistent with a rotationally supported system, suggesting the GC belongs to the Thick Disk. In terms of chemical abundances instead, there is a lack of studies using high resolution spectra. Many attempts have been made in order to estimate its metallicity based on CaII IR triplet measurements (Rutledge
et al., 1997). Then, in the catalogue performed by Harris (1996, ed. 2010), a value of [Fe/H]=-0.49 dex was obtained by averaging metalicities derived from Armandroff &
Zinn (1988), Francois (1991) and Carretta et al. (2009c). Finally, the most recent study about chemical analysis related to NGC 5927 was performed by Pancino
et al. (2017, Here and after P17) where their study was focused in the Mg-Al anti-correlation in 9 GCs including NGC 5927 using the GAIA-ESO Survey (GES). P17 used 9 stars for the abundance analysis in NGC 5927 which 7 of them correspond to the same stars used in this work. Nevertheless, the data collected in both works correspond to different observations and data reduction. The elements presented in P17 are Fe, O, Na, Mg and Al which we are going to compare with our measurements.
In Section 2 we describe the observations and data reduction performed for the study. Section 3 is a description of the methods used in order to derive the chemical abundances and the errors analysis. In Section 4 our results are presented and compared with different components of the Galaxy and other GCs and finally in Section 5 we give a summary, present our findings and proffer our conclusions.
2 OBSERVATIONS AND DATA REDUCTION
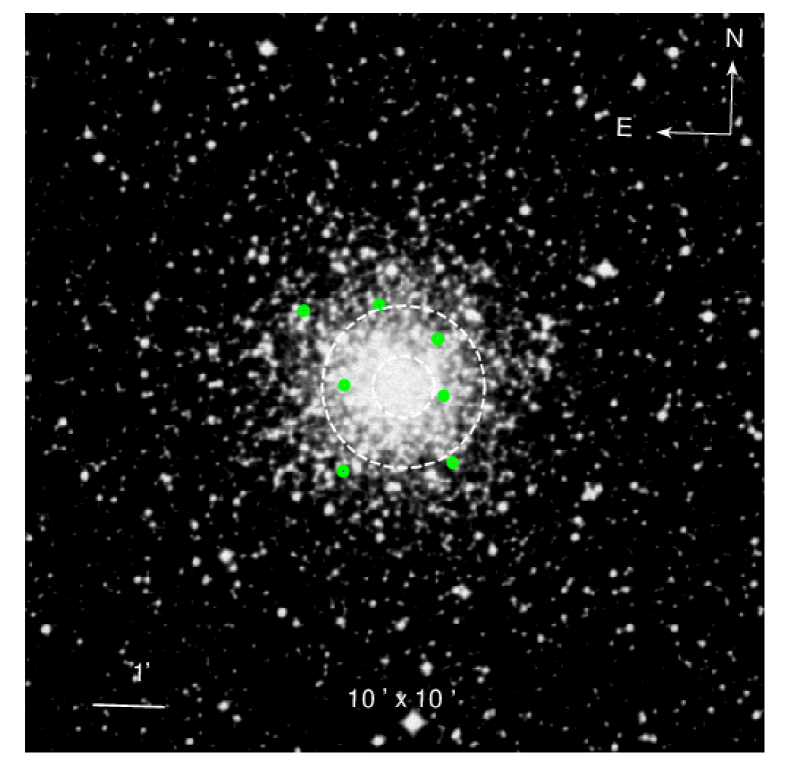
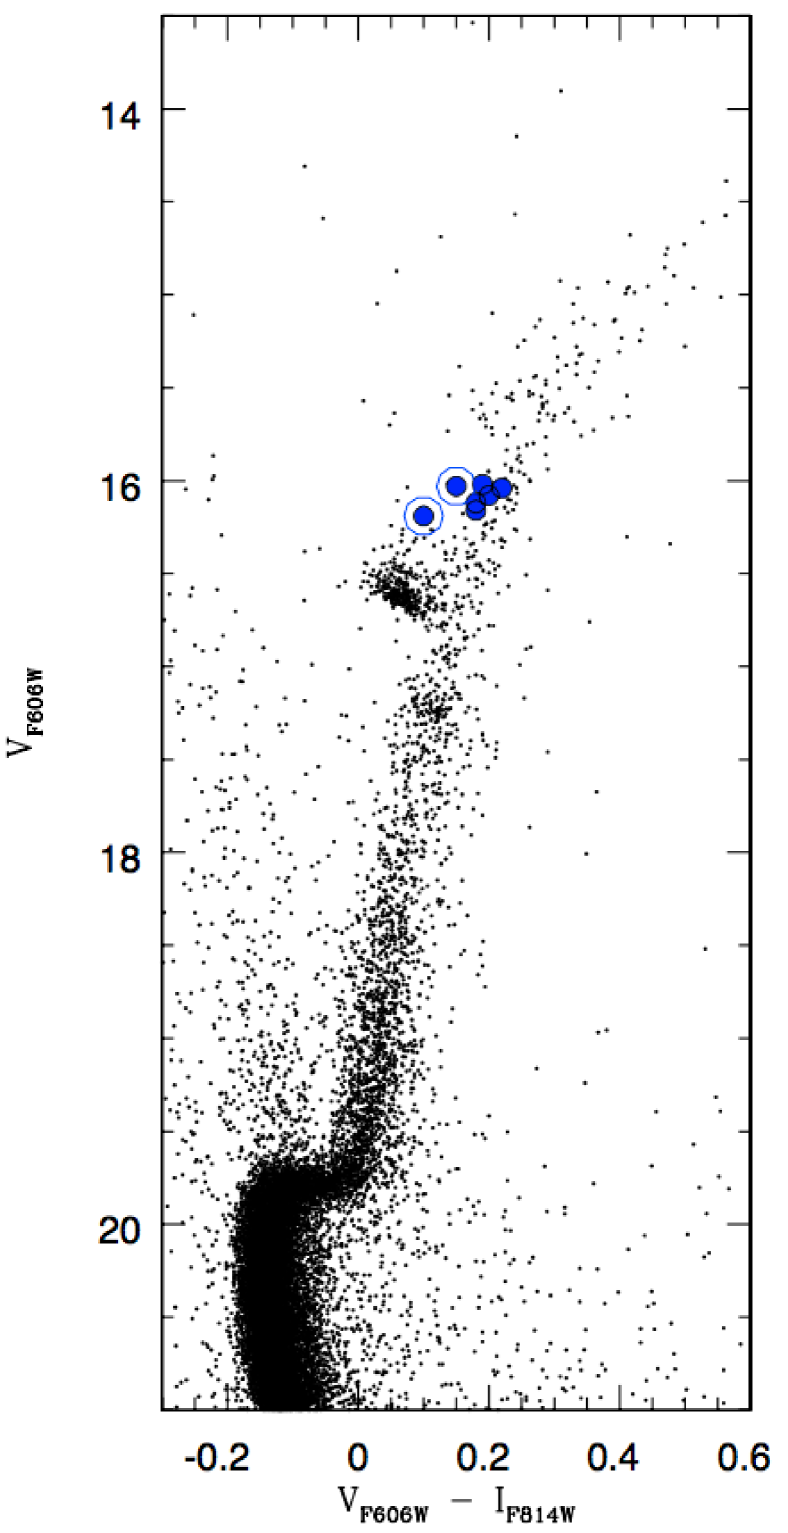
The dataset consist of 7 high resolution spectra (R ) of 7 giant stars from NGC 5927 using the Ultraviolet Echelle Spectrograph (UVES) spectrograph (Dekker et al., 2000). The central wavelength was centered in 580 nm and the spectral range covers between 480 nm and 620 nm (CCD3, filter SHP700, red arm only). The data was obtained from the ESO Archive111Observations were made in ESO facilities on VLT-UT2 telescope, Cerro Paranal, under program ID 079.B-0721(A). as public data. The selection of targets was made using a CMD based on observations with the Advanced Camera for Surveys (ACS) on-board Hubble Space Telescope (See figure 2). See Simmerer et al. (2013, Sections 3 and 4) for more detailed explanation about the target selection. The spatial distribution of the observed stars is shown in figure 1 including the core radius and the half mass-radius. Also, Allen et al. (2008) calculated a tidal radius for NGC 5927 (not show in the figure 1) using King (1962) formula (RK) and a reduced King’s formula (R∗) in two different potential. In an axisymmetric potential RK=52.1pc and R∗=61.5pc but under a barred potential RK=49.8pc and R∗=57.6pc. From Figure 2, there seems to be two AGB stars (star and star ) in our data which we marked with a circle in plots. In the case of star 3 shows atypical abundances values as discuss in the following sections. This star is the hottest one (See Table 2), but received the same treatment to obtain the stellar parameters.
The signal-to-noise ratio (S/N) in our spectra is between 20-50 at nm. Table 1 shows the S/N of each star in two different wavelength ranges. About data reduction, bias subtraction, flat-field correction and wavelength calibration were performed using the UVES pipeline version 5.7.0222Pipelines list on http://www.eso.org/sci/software/pipelines/. The sky subtraction, and spectral rectification were performance using Sarith and continuum tasks in IRAF.
| Star | 604.7-605.3 [nm] | 606.8-607.6 [nm] |
|---|---|---|
| 1 | 48.13 | 50.24 |
| 2 | 41.36 | 35.05 |
| 3 | 39.72 | 37.54 |
| 4 | 30.58 | 36.00 |
| 5 | 34.82 | 40.56 |
| 6 | 36.95 | 40.30 |
| 7 | 47.64 | 49.49 |
Radial velocities were measured using the fxcor task in IRAF and a synthetic spectrum as a template. Radial velocities indicate that the 7 stars are members of the cluster and we found a mean radial velocity of km s-1. This value is in good agreement with Simmerer et al. (2013), who found a mean radial velocity of km s-1 for the cluster using the same UVES data, but also GIRAFFE data (72 member stars).
| ID | RAfibre | DECfibre | VF606W | IF814W | [Fe/H] | ||||
|---|---|---|---|---|---|---|---|---|---|
| 1 | 232.02279 | -50.67275 | 16.04 | 15.82 | -105.279 | 4519 | 2.61 | 1.10 | -0.54 |
| 2 | 231.99008 | -50.66175 | 16.16 | 15.98 | -101.163 | 4500 | 2.60 | 1.21 | -0.49 |
| 3† | 232.02242 | -50.69211 | 16.19 | 16.09 | -102.328 | 4835 | 2.86 | 1.59 | -0.44 |
| 4† | 232.01121 | -50.65447 | 16.03 | 15.88 | -105.656 | 4422 | 2.56 | 1.40 | -0.47 |
| 5 | 231.98354 | -50.68953 | 16.02 | 15.83 | -102.252 | 4430 | 2.52 | 1.22 | -0.51 |
| 6 | 232.03792 | -50.65622 | 16.08 | 15.88 | -105.538 | 4376 | 2.28 | 1.06 | -0.37 |
| 7 | 231.98742 | -50.67450 | 16.12 | 15.94 | -94.948 | 4358 | 2.24 | 0.96 | -0.49 |
| † AGB stars. |
| El | 1 | 2 | 3 | 4 | 5 | 6 | 7 | Cluster1 | Sun |
|---|---|---|---|---|---|---|---|---|---|
| 0.4 | 0.08 | 0.39 | 0.24 | 0.13 | 0.18 | 0.18 | 0.23 0.05 | 8.83 | |
| 0.07 | 0.33 | 0.24 | 0.24 | 0.29 | 0.08 | -0.02 | 0.18 0.05 | 6.32 | |
| 0.30 | 0.30 | 0.22 | 0.25 | 0.29 | 0.22 | 0.30 | 0.27 0.02 | 7.55 | |
| 0.48 | 0.55 | 0.35 | 0.59 | 0.56 | 0.44 | 0.45 | 0.49 0.03 | 6.43 | |
| 0.24 | 0.13 | 0.29 | 0.12 | 0.31 | 0.24 | 0.32 | 0.24 0.03 | 7.61 | |
| 0.19 | 0.15 | 0.08 | 0.15 | 0.15 | 0.17 | 0.13 | 0.15 0.01 | 6.39 | |
| 0.35 | 0.32 | 0.23 | 0.34 | 0.32 | 0.41 | 0.29 | 0.32 0.02 | 3.12 | |
| 0.36 | 0.3 | 0.26 | 0.33 | 0.31 | 0.41 | 0.24 | 0.32 0.02 | 4.94 | |
| 0.45 | 0.37 | 0.23 | 0.41 | 0.36 | 0.45 | 0.3 | 0.37 0.03 | 4.00 | |
| 0.06 | -0.01 | -0.02 | 0.08 | 0.05 | 0.04 | 0.01 | 0.03 0.02 | 5.63 | |
| -0.14 | 0.04 | -0.04 | -0.05 | -0.11 | -0.14 | -0.22 | -0.09 0.03 | 5.37 | |
| -0.54 | -0.49 | -0.44 | -0.47 | -0.51 | -0.37 | -0.49 | -0.47 0.02 | 7.50 | |
| 0.35 | 0.36 | 0.3 | 0.42 | 0.39 | 0.49 | 0.33 | 0.38 0.03 | 4.93 | |
| 0.12 | 0.18 | 0.13 | 0.14 | 0.18 | 0.25 | 0.22 | 0.17 0.02 | 6.26 | |
| 0.3 | 0.32 | 0.08 | 0.44 | 0.33 | 0.43 | 0.31 | 0.32 0.05 | 4.19 | |
| -0.06 | -0.03 | 0.01 | -0.21 | -0.14 | 0.11 | 0.03 | -0.04 0.04 | 4.61 | |
| -0.06 | -0.09 | -0.28 | -0.16 | -0.11 | -0.03 | -0.31 | -0.15 0.04 | 2.25 | |
| 0.14 | -0.08 | 0.2 | 0.03 | 0.02 | -0.06 | -0.08 | 0.02 0.05 | 2.56 | |
| 0 | -0.06 | -0.13 | -0.17 | -0.03 | -0.09 | -0.08 | -0.08 0.02 | 2.34 | |
| -0.26 | -0.27 | -0.2 | -0.11 | -0.21 | -0.28 | -0.3 | -0.23 0.03 | 1.53 | |
| 0.36 | 0.16 | 0.16 | 0.21 | 0.16 | 0.13 | 0.16 | 0.19 0.03 | 1.59 | |
| 0.55 | 0.29 | 0.56 | 9.99 | 9.99 | 0.36 | 0.38 | 0.43 0.04 | 0.52 |
| 1The errors are statistical errors obtained from the mean. | |||||||||
| ∗Elements measured by EWs. |
| ID | S/N | ||||||
|---|---|---|---|---|---|---|---|
| 0.01 | 0.03 | 0.00 | 0.03 | 0.02 | 0.05 | 0.12 | |
| 0.02 | -0.05 | -0.05 | -0.02 | 0.02 | 0.08 | 0.13 | |
| 0.03 | 0.00 | -0.05 | 0.01 | 0.03 | 0.07 | 0.04 | |
| 0.01 | -0.02 | -0.03 | -0.01 | 0.03 | 0.05 | 0.08 | |
| -0.02 | 0.00 | -0.03 | 0.03 | 0.02 | 0.05 | 0.08 | |
| 0.08 | -0.01 | -0.02 | 0.01 | 0.06 | 0.10 | 0.03 | |
| 0.01 | 0.01 | 0.01 | 0.01 | 0.02 | 0.03 | 0.06 | |
| 0.10 | 0.00 | -0.03 | 0.00 | 0.05 | 0.12 | 0.06 | |
| 0.11 | -0.01 | -0.04 | -0.01 | 0.04 | 0.12 | 0.08 | |
| 0.06 | 0.00 | -0.01 | 0.00 | 0.04 | 0.07 | 0.04 | |
| 0.08 | -0.02 | -0.02 | 0.00 | 0.03 | 0.09 | 0.08 | |
| 0.04 | 0.01 | -0.03 | 0.02 | 0.02 | 0.06 | 0.05 | |
| 0.04 | 0.02 | -0.03 | 0.02 | 0.08 | 0.10 | 0.06 | |
| 0.03 | 0.02 | -0.04 | 0.03 | 0.07 | 0.09 | 0.05 | |
| -0.02 | -0.02 | -0.02 | -0.02 | 0.05 | 0.06 | 0.12 | |
| -0.01 | 0.03 | -0.04 | 0.04 | 0.05 | 0.08 | 0.11 | |
| -0.04 | 0.01 | -0.05 | 0.02 | 0.05 | 0.08 | 0.11 | |
| 0.03 | -0.01 | -0.09 | 0.02 | 0.02 | 0.10 | 0.11 | |
| 0.05 | 0.00 | -0.02 | 0.04 | 0.03 | 0.07 | 0.06 | |
| -0.02 | 0.01 | 0.01 | 0.03 | 0.05 | 0.06 | 0.07 | |
| 0.02 | 0.00 | -0.01 | 0.00 | 0.04 | 0.05 | 0.08 | |
| 0.00 | 0.02 | 0.00 | 0.03 | 0.03 | 0.05 | 0.08 |
3 ABUNDANCE ANALYSIS
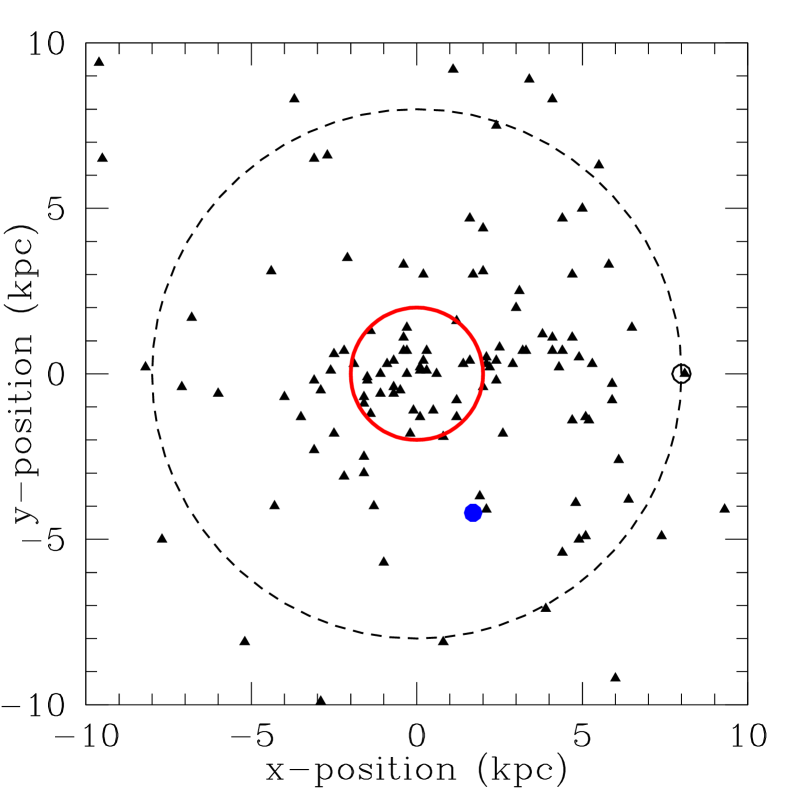
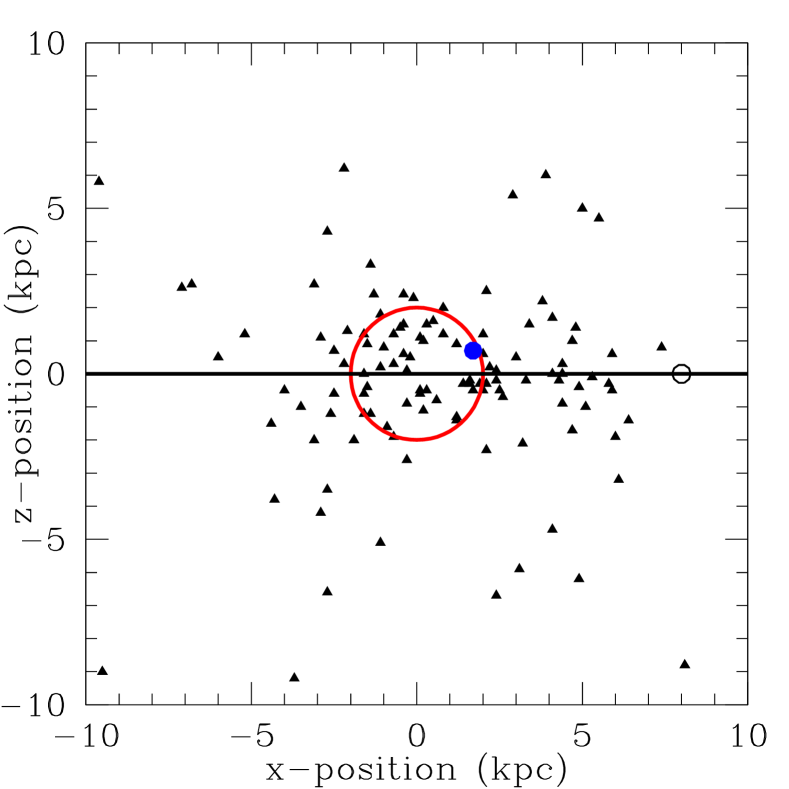
Because NGC 5927 is close to the Galactic plane as show in Figure 3 (), its extinction is relatively significant. Heitsch & Richtler (1999) found a total reddening of and a maximum differential reddening of . In order to avoid errors introduced by photometric estimations due to the strong extinction, we derive stellar parameters using spectra.
We used the Local Thermodynamic Equilibrium (LTE) MOOG program (Sneden, 1973) for the abundance analysis coupled with ATLAS9 (Kurucz, 1970) atmospheric models. For the analysis we used spectral linelists from Villanova & Geisler (2011) and the solar abundances listed in column 10 of Table 3.
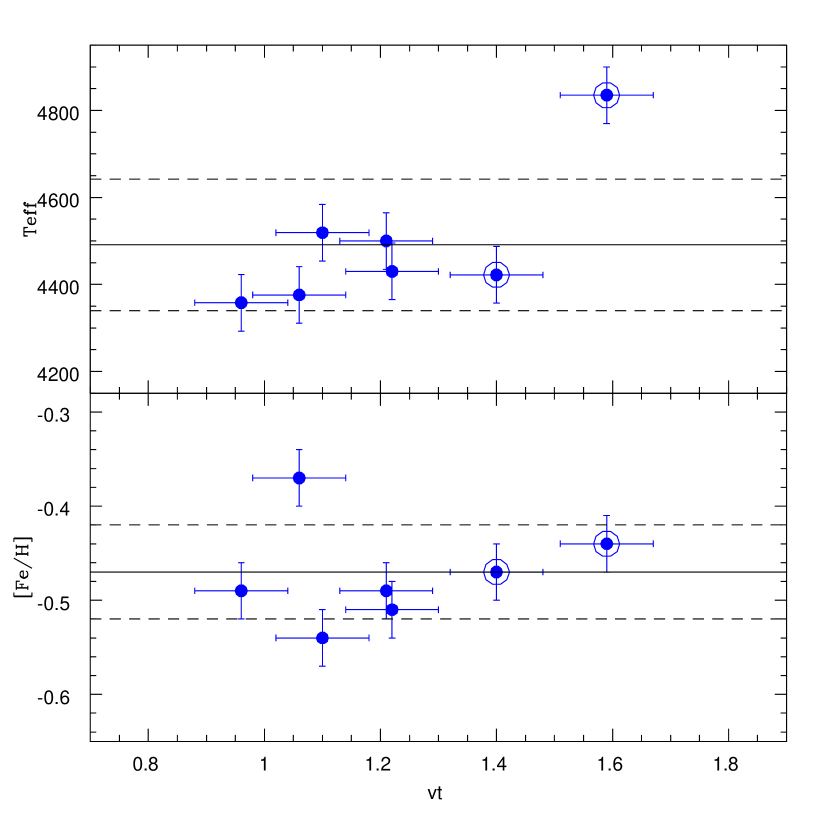
The atmospheric parameters listed in Table 4, were obtained varying the effective temperature (), micro-turbulent velocity () and gravity () in order to remove any trend between the excitation potential and equivalent width vs. abundance, and to satisfy the ionization equilibrium respectively. The FeI and FeII were used for this latter purpose. The [Fe/H]value of the model was changed at each iteration according to the output of the abundance analysis. Stellar parameters for each star used in the analysis are listed in Table 2. In addition, figure 4 shows the stellar parameters Teff and [Fe/H] vs . From the upper panel of the figure, star #3 has the biggest vt value due to it’s high temperature, the hottest star in our sample. In the lower panel we see no trend between [Fe/H] and vt.
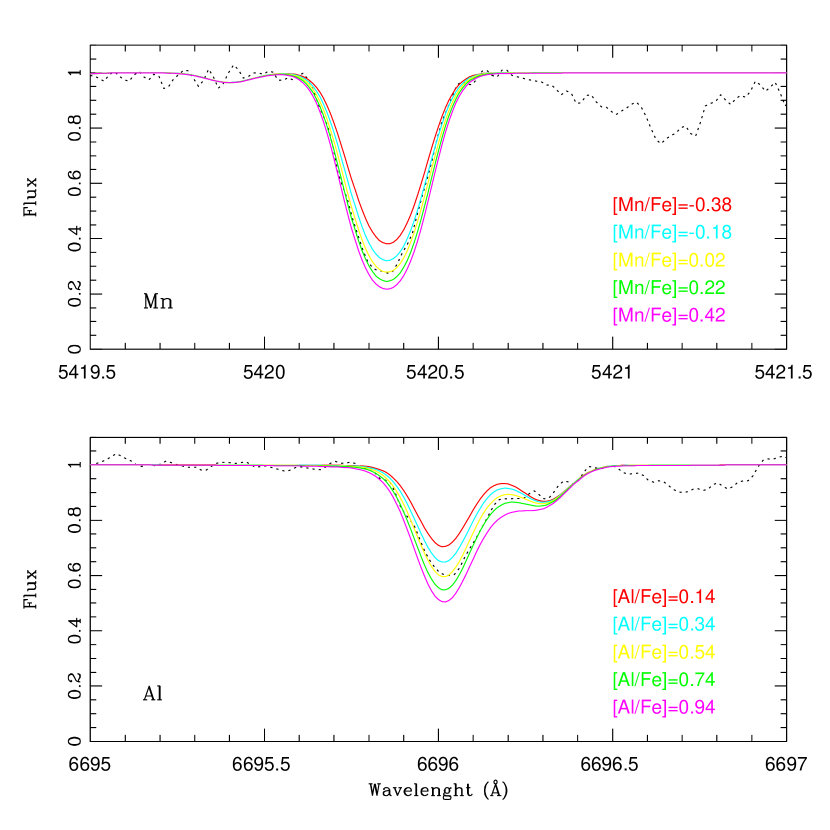
Two different techniques were used to obtain the element abundances from our spectra. The Ca, Ti V, Cr, Fe, Co and Ni abundances were measured using Equivalent Widths ((Marino et al., 2008, see EWs)). For O, Na, Mg, Al, Si, Sc, Mn, Cu, Zn, Y, Zr, Ba, Ce, Nd and Eu we used the spectrum-synthesis method because of the blending with other spectral lines. For each line we calculated 5 synthetic spectra varying the abundance, the value that minimizes the rms to fit the observations is our final estimation. Figure 5 is an example of the fitting process in Star for Mn and Al absorption lines. We selected absorption lines not contaminated by telluric lines and we made special considerations for Ba and Na. We took hyperfine splitting into account only for the Ba measurements since this line is strong enough to consider it. For Na abundances were corrected for non-LTE (NLTE) using corrections provided by the INSPEC 333http://inspect.coolstars19.com/index.php?n=Main.HomePage database.
In addition, a detailed internal error analysis was performed by varying Teff, , [Fe/H], and by an amount equal to the estimated internal error in each parameter. Then abundances in star was re-measured, assuming that it represents the entire sample. The parameters were varied by K, km s-1, and dex. This estimation of the internal errors for atmospheric parameters was performed as in Marino et al. (2008). The results of errors are listed in Table 4, including errors due to the noise in the spectra. This error was obtained for elements whose abundance was obtained by EWs, as the average value of the errors of the mean given by MOOG, and for elements whose abundance was obtained by spectrum-synthesis, as the error given by the fitting procedure. The is the squared sum of the single errors, while is the mean observed dispersion.
4 RESULTS
This is the first chemical abundance study of NGC 5927 using high resolution spectra that covers a wide sample of elements (see Table 3) which are involved in different nucleosynthetic processes. The main purpose is to study chemically the evolution of the cluster and investigate possible MPs. For the discussion, field stars from the Bulge, Halo and Thick Disk are compared with our results. We are looking for possible features that could suggest a link between the cluster with any of these structures. Also, we compare our sample set with Bulge GC that have similar metallicities in order to compare their chemical behaviour with NGC 5927.
In the following sections, we present chemical abundances for iron-peak elements, elements, light elements and heavy elements.
4.1 Iron-peak elements
The mean iron abundance value that we found is:
Reported error is the error on the mean. The spread of iron values are within the errors (see Table 4) indicating no intrinsic spread on iron abundances.
A slightly different iron content of [Fe/H]=-0.39 dex was found by P17 using UVES and GIRAFFE data. This difference in iron estimation between P17 and us is probably due to (1) different linelists used for the abundance analysis, (2) the different processing treatment and (3) the lower resolution of GIRAFFE spectra.
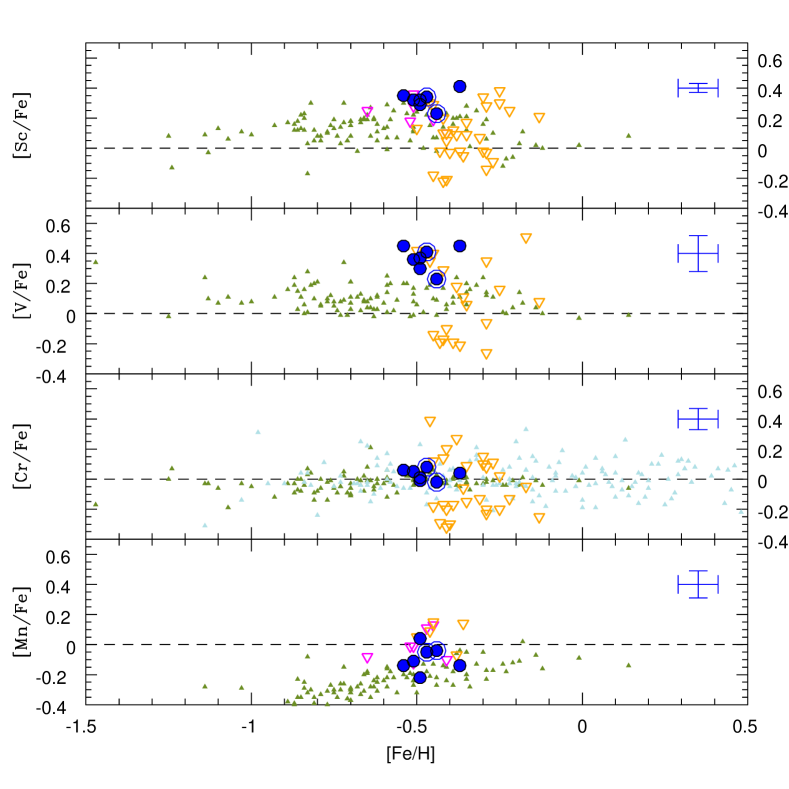
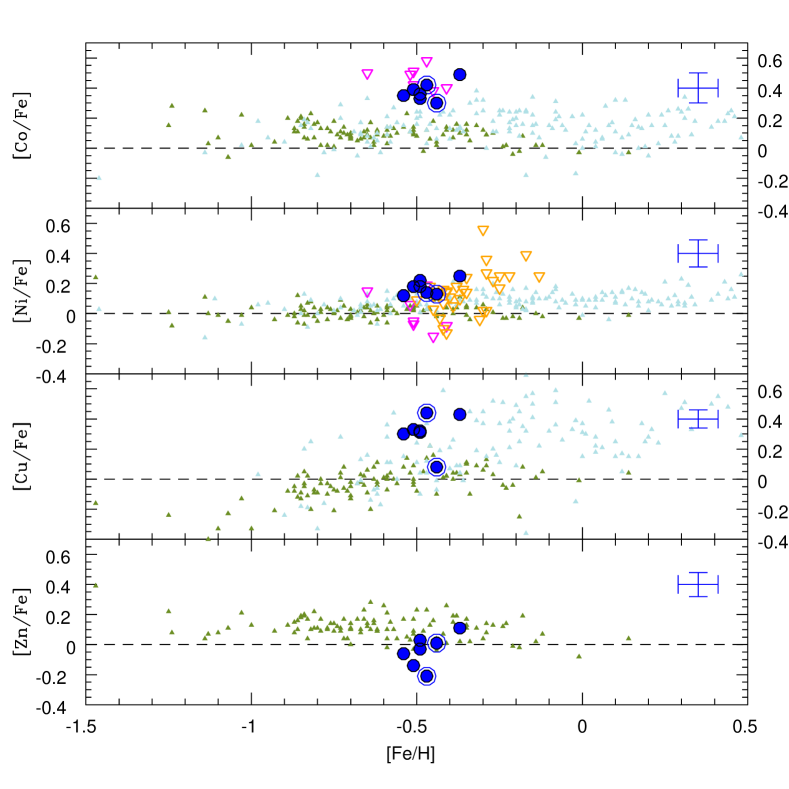
We considered Sc, V, Cr, Mn, Co, Ni, Cu, and Zn as iron-peak elements and their values are listed in Table 3. The Figure 6 show each iron-peak element compared with field stars from Thick Disk, Bulge field stars and Bulge GCs found in literature. Some of these elements (Sc, V, Co, Ni, Cu) show an interesting behaviour which relate the cluster to the Bulge rather than the Thick Disk. This opens the discussion about the origins of NGC 5927, which is linked kinematically to the Thick Disk but under the chemical perspective, shows similarities with the Bulge structure and follows the same behaviour as a Bulge GC.
No large spreads are observed in the iron-peak elements excepting star in Cu. This star is considerably under-abundant having a value of [Cu/Fe]=0.08 dex comparable to the sun, far away from the observe range trend in Cu seen in its companions.
4.2 elements
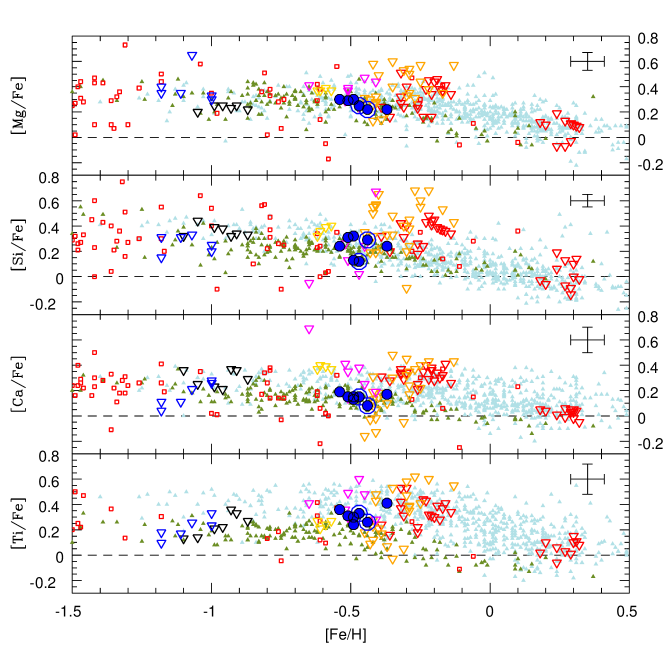
The enhancement was obtained as the mean of Mg, Si, Ca and Ti. The O abundances are considered later as part of the Na-O anti-correlation. The mean value found for elements is:
We also found a mean abundance for pure elements of which is lower but consistent for the main value.
All the elements in GGCs are over-abundant compared to the sun as can be seen in Figure 7 and NGC 5927 shares this behaviour too as expected. This element over-abundance is mainly the product of SNeII when massive stars exploded. Type II Supernovae are effective alpha-elements polluters who enrich the intra-cluster gas(Tinsley, 1979; Sneden, 2004).
The difference in elements enhancement between the Thick Disk and Bulge are still under discussion and seems to be that both structures share the same -enhancements. Bensby et al. (2010) compared type F and G dwarf field stars from the Disk and Bulge arguing that they are chemically similar. We did not include data from Bensby et al. (2010) for comparison due to the different type of star used for the study. Our comparison takes into account only giants because in our sample we have this kind of s3tars. In addition, Rojas-Arriagada et al. (2017, Figure 16) measured Mg for a considerable sample of star from the Disk and Bulge, finding no large difference between them.
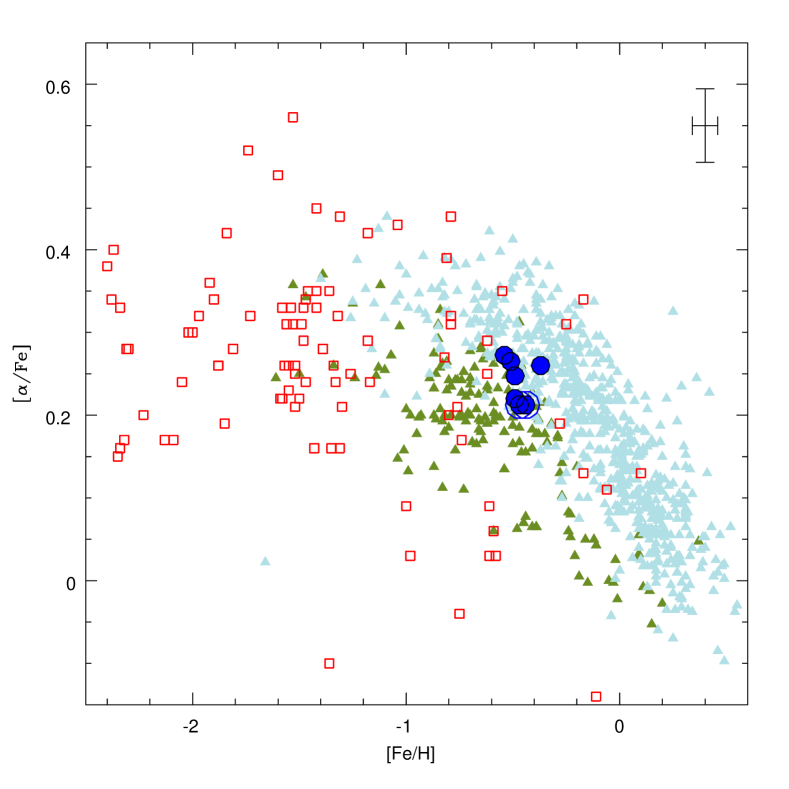
In our field stars comparison sample, the abundances in Bulge shows enhanced values with respect to Thick Disk, but at metallicities of [Fe/H]-0.7 they overlap as shown in Figure 7. The same behaviour is seen in each element Mg, Si, Ca and Ti in Figure 8. We can observe in both Figures (7 and 8) that NGC 5927 is located just in the middle of the alpha trend of the Thick Disk and Bulge. Also the cluster is compared with other Bulge GCs for each element.
Besides the position in the Milky Way shown in Figure 3, NGC 5927 has kinematics consistent with being a member of the Thick Disk of the Galaxy (Allen et al., 2008; Casetti-Dinescu et al., 2007) suggesting it as one of the best Thick Disk candidate GCs. From the chemical point of view, NGC 5927 has -abundances that stand between Bulge and Disk values.
4.3 Light elements
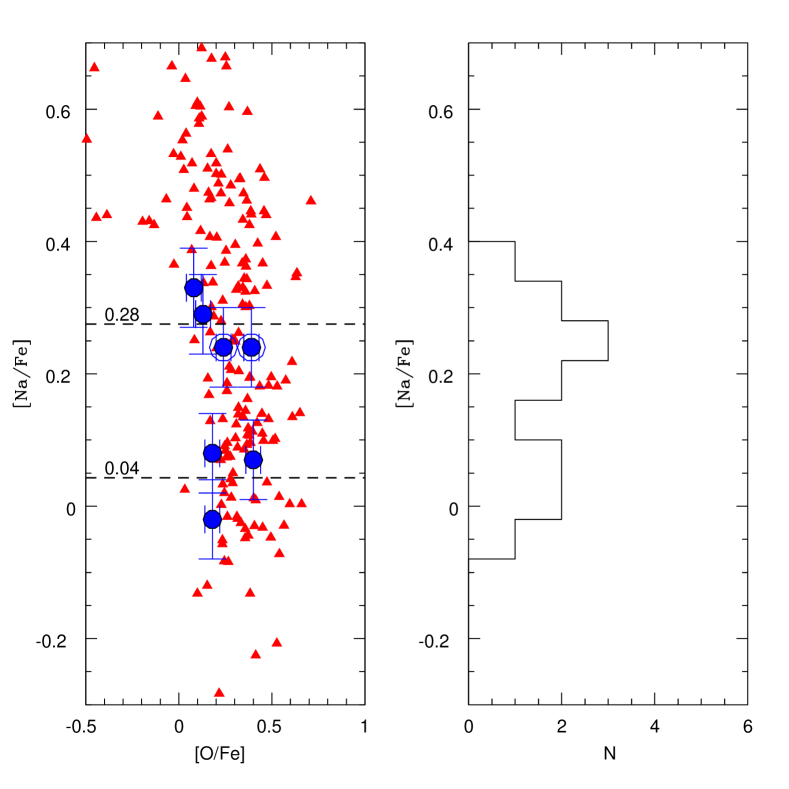
In GCs, light elements show variations in their abundances. The responsible processes for these variations are different proton capture chains in previous generation of stars. In the CNO cycle, N is enhanced while C and O are depleted, also in the Ne-Na cycle Ne is depleted and Na enhanced and for the Mg-Al cycle Mg is depleted and Al enhanced. The observation of these abundance differences tell us about the MPs phenomenon. In NGC 5927 we observe a spread in O, Na and Al larger than internal errors indicating a real spread in these elements, and thus confirming that this cluster contains MPs. However, the observed dispersion in Mg is within the range expected from errors alone, suggesting no intrinsic variation (See Table 4). In the following, we discuss about the relations between these elements, looking for features in NGC 5927 in order to understand its MPs.
4.3.1 O-Na anti-correlation
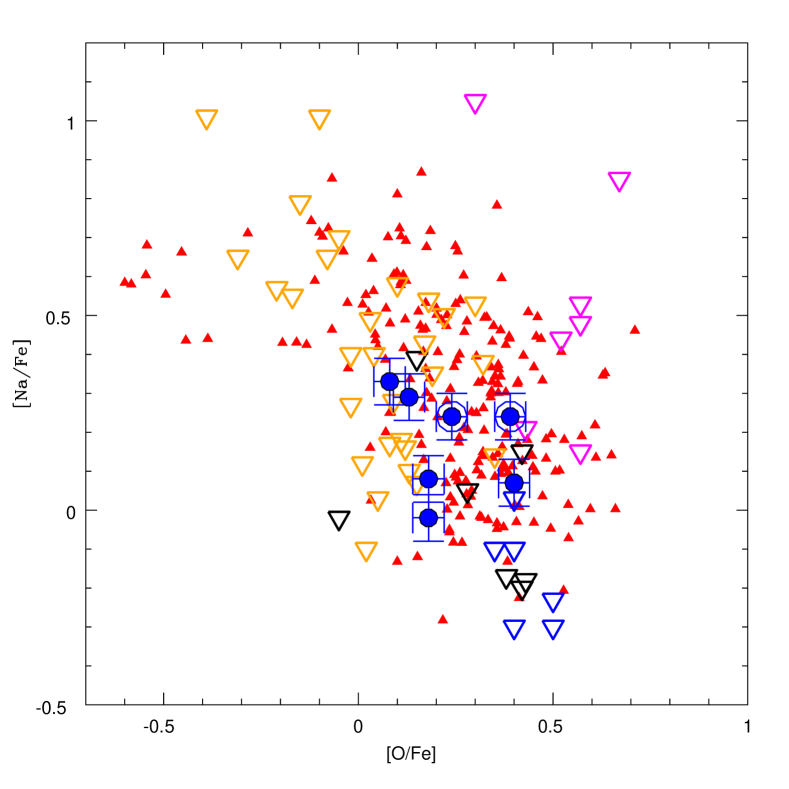
In almost every GC an anti-correlation exist between O and Na and it has been well studied in many of them (e.g. Carretta et al. (2009b)). This anti-correlation is one of the most important chemical signature of MPs since we can differentiate populations along the extension of the anti-correlation (Carretta et al. (2009a)). In the case of NGC 5927, the first study of the O-Na anti-correlation was performed by P17 and their results are in good agreement with us. The main difference in the Na values in P17 with respect to our measurements are due to the fact that we take NLTE correction on Na into account. The offset in Sodium between the two datasets is dex.
The Figure 9 shows Na as a function of O next to the Na abundances distribution. In our sample, Na seems to be distributed in two groups suggesting a possible bimodal distribution. Of course, our small sample may not be statistical significant and more data are required to verify this behaviour. The mean [Na/Fe] in Na-rich (, , , ) and Na-poor (, , ) groups is 0.28 dex and 0.04 dex respectively, both with a standard deviation of 0.04. However, this bi-modality can be observed in P17 (Figure 2) as well.
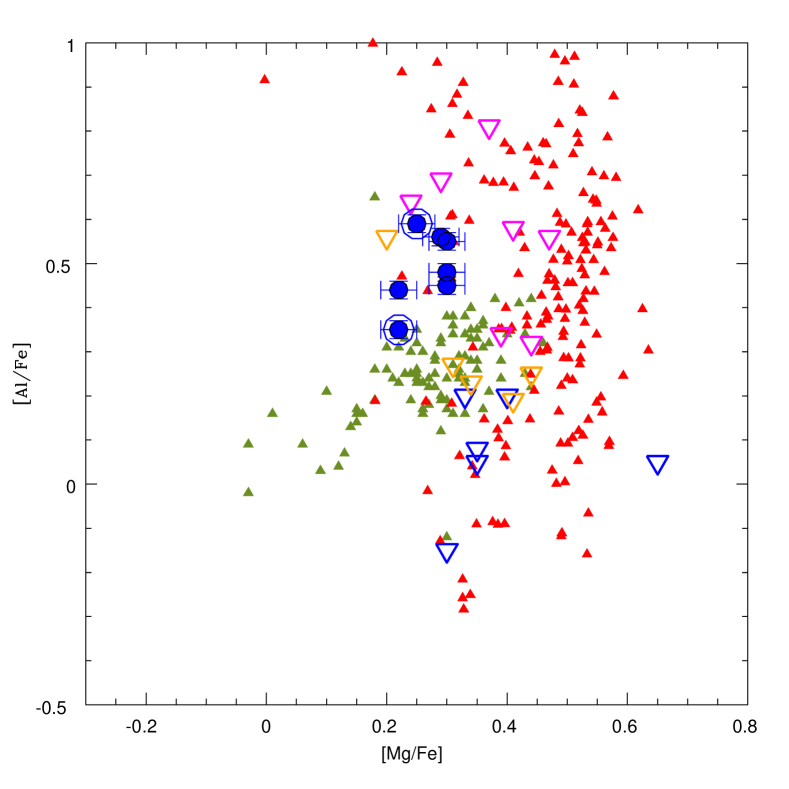
4.3.2 Mg-Al anti-correlation
Unlike Na-O, the Mg-Al anti-correlation is only present in some GCs (Carretta et al., 2009a). In the case of NGC 5927, no signs of a clear anti-correlation can be distinguish in Figure 11. In this figure our Mg values shows an under-abundance compared with the trend of Carretta et al. (2009b) mainly because the sample comes from Halo GCs.
Even when NGC 6440 an NGC 6441 share similar metallicity with NGC 5927, both clusters shows an over-abundance in Mg for the majority of the stars but NGC 5927 follow the galactic trend. This behaiviour may be due that NGC 6440 and NGC 6441 are bulge GCs and they follow similar patterns in Mg but not the case of NGC 5927. The values in Al instead, are over-abundant compared with field stars from Thick Disk and enhanced by dex compared to Mg.
The Mg-Al analysis in NGC 5927 performed by P17 (Figure 3) include data from UVES and GIRAFFE. They also observe no signs of anti-correlation and the abundances in Mg and Al are in good agreement with us.
4.3.3 Na-Al correlation
The correlation between Na and Al in GCs it is probably due to the Ne-Na and Mg-Al chain activation in previous generations where massive stars enhanced Na and Al respectively. For the case of NGC 5927 we observe a correlation between Na and Al in Figure 12 even when we do not see a clear anti-correlation in Mg-Al (See Section 4.3.2). The correlation is not continuous due to the Na distribution, grouping it in two groups as is described in Section 4.3.1. The presence of a Na-Al correlation without a Mg-Al anti-correlation has been observed before in other GCs (e.g. M4 by Marino et al. (2008)). We attribute this behaviour in NGC 5927 to a possible activation of the Mg-Al chain reaction in previous generation but with a slow rate.
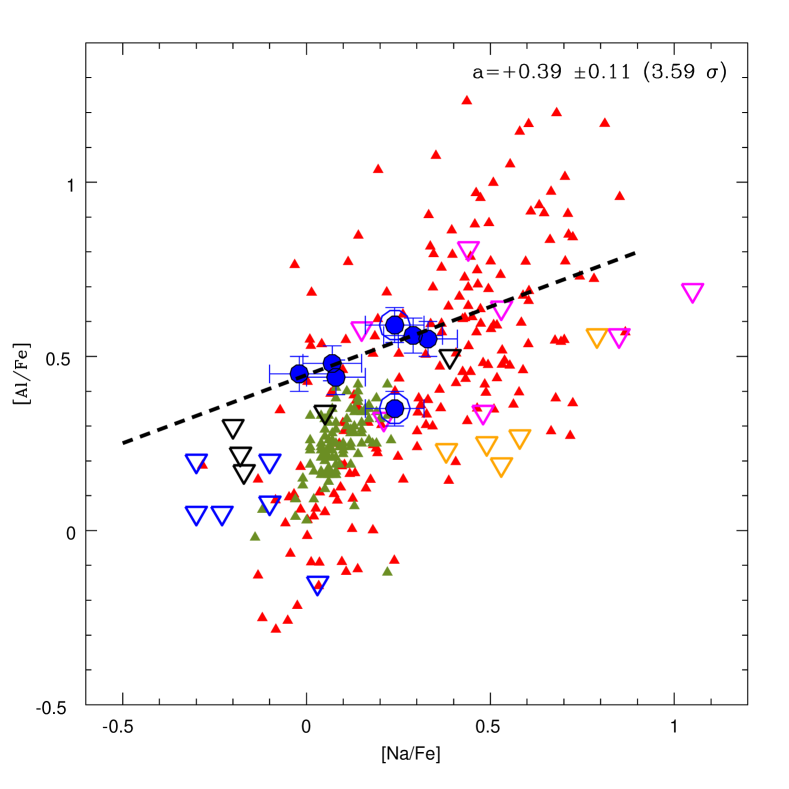
The linear fit used for the correlation has an slope of with an error of . This fit was made excluding Star which is the most Al-poor one and shows chemical behaviours (mostly under-abundances) that do not follow the trends described by their companions. The significance of the slope is about 3.5. The anomalies in star as can be seen also in Figure 11 for Mg-Al and Figure 6 for iron-peak elements (specially in Cu).
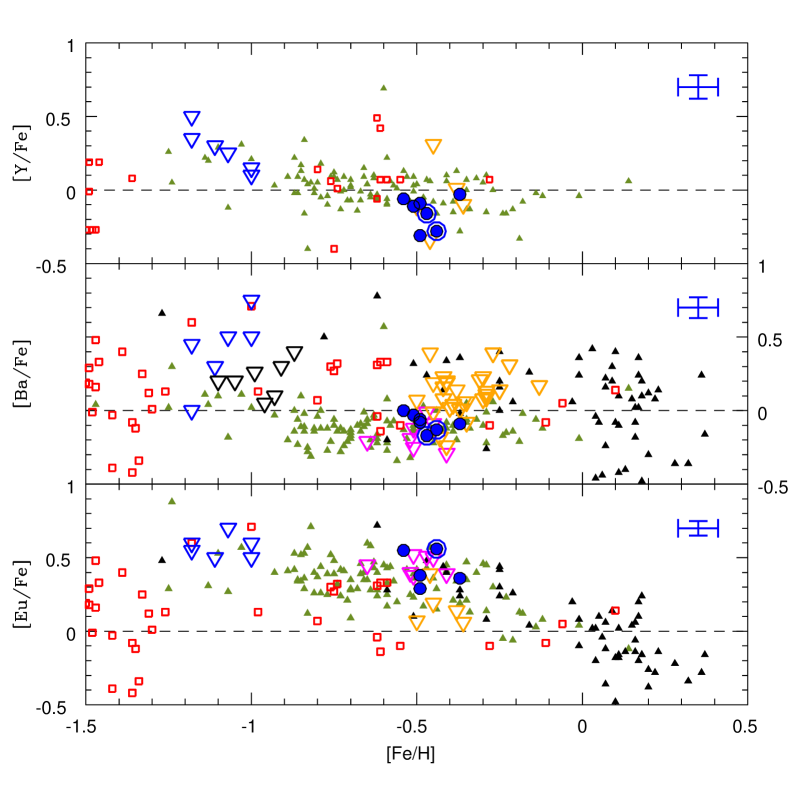
4.4 Heavy elements
The neutron capture is the nuclear reaction process responsible for the formation of heavy elements. Depending on the neutron capture rate, we can separate these process in two types: (1) When the capture time is longer than the beta-decay, it is called s-process. (2) If the neutron capture is faster than the beta-decay, we have the r-process (Sneden et al., 2008).
The elements mainly produced by s-process can be light-s elements such as Y, Zr and heavy-s elements like Ba and Ce. This process occurs principally in the AGB phase of intermediate mass stars. On the other hand, the r-process elements are mainly generated during the SNe II explosions. One of the elements produced mainly by this process is Eu which can be used to determine how strong is the contribution of the process in the chemical evolution of the cluster. Also, SNeII produces iron-peak elements and -elements.
In Figure 13 we compare Y, Ba and Eu abundances of NGC 5927 with field stars and also with Bulge GCs. For Y and Ba, abundance values are sub-solar and shows some differences with respect to the Bulge GCs, with the exception of NGC 6440. We underline the strong similarities in heavy elements enhancements between NGC 5927 and NGC 6440. These similarities have also been observed in the and iron-peak elements (Sections 4.2 and 4.1 respectively). For Eu instead, values are over-abundant with respect to the Sun. This indicates a large contribution of SNeII to the proto-cluster cloud.
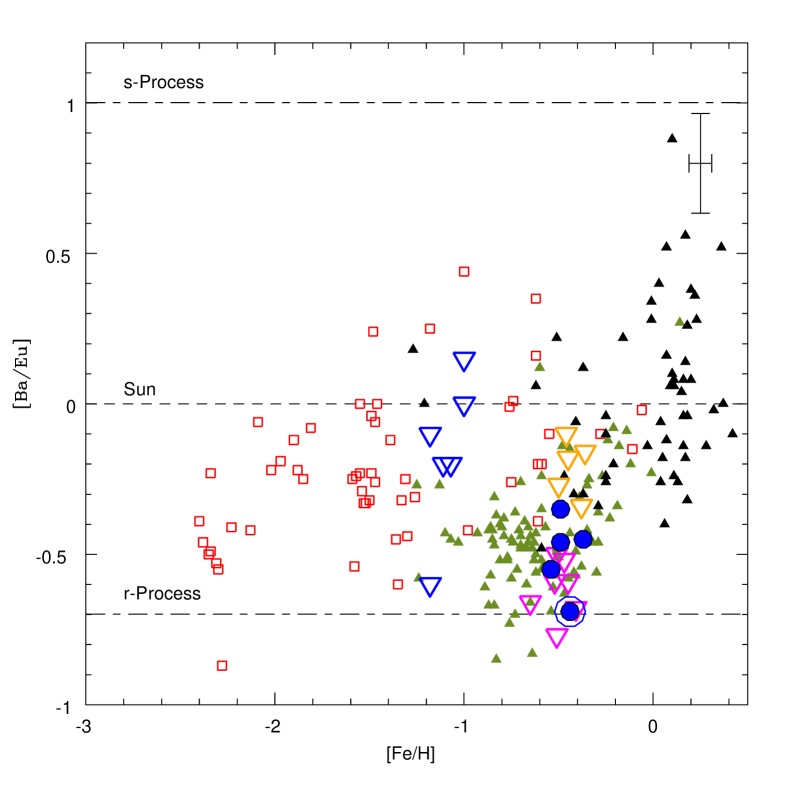
Since Ba is mainly processed by s-process and Eu mainly by r-process, the [Ba/Eu] ratio is an indicator of which process contributed more in the chemical evolution of the cluster. In Figure 14, we observe that [Ba/Eu] ratio in NGC 5927 is mainly dominated by r-process contributions. This suggest that the early proto-cluster environment was polluted mainly by SNeII. In addition, is notable the similarity (again) between NGC 5927 and NGC 6440 showing values very similar indicating that both cluster share similar evolutionary scenarios.
5 SUMMARY AND CONCLUSIONS
In this paper we present a detailed chemical abundances analysis of the Globular Cluster NGC 5927. A total of 22 elements in 7 giant stars are consider for the analysis using high resolution spectroscopy taken by UVES instrument with a moderate S/N (). We measure 16 elements by spectrum-synthesis and 7 elements by EW, including an accurate error analysis. The results are compared with different components of the Milky Way such Thick Disk, Bulge field stars and Bulge GCs.
We obtained the following results:
-
•
We found a mean metallicity of [Fe/H]=-0.47 dex with a . This value is in good agreement with the value estimated by Harris (1996, 2010 ed.) ([Fe/H]=-0.49). Also we rule out an intrinsic spread in the iron content. No significant spread is visible in other iron-peak elements. For some elements, NGC 5927 seem to follow the Bulge trend rather than the Thick Disk. Previous literature refers to NGC 5927 as one of the most metal-rich Thick Disk GCs but its metallicity is comparable with the Bulge field stars and Bulge GCs (ie. NGC 6440). There is a difference of dex between our measurements and Pancino et al. (2017) ([Fe/H]=-0.39 dex).
-
•
We confirm the existence of an anti-correlation between O and Na but the spread in O is small. The Na distribution seem to be bi-modal but we caution that our sample size is small. A large sample is required to confirm this behaviour.
-
•
We observe no clear evidence for Mg-Al anti-correlation in NGC 5927, however we observe a Na-Al correlation. The spread in Al may indicate a low Mg-Al cycle activity. Also, our abundances are in good agreement with Pancino et al. (2017) in this topic.
-
•
About content, NGC 5927 matches the typical trends of the Galaxy field stars. We found an alpha enrichment of [/Fe]=0.25 0.08. In each element (Mg, Si,Ca and Ti), the values for NGC 5927 are not so enhanced as those for Bulge GCs but they still are over-abundant. These enhancements indicate that the cluster has experienced rapid chemical evolution which is related to contributions from SNeII. We decide not to relate NGC 5927 with the Bulge or Disk components using alpha abundances, since whether there exists a difference in alpha abundance between these two components is still under debate.
-
•
A strong contribution of r-process is suggested by analysing [Ba/Eu] ratios pointing out SNeII as principal polluter for the proto-cluster cloud.
-
•
The heavy s-process elements shows no significant spread, which seems to contradict the theory that AGB stars are polluters for the second generation stars.
-
•
We highlight the similarity of NGC 5927 with NGC 6440 Bulge GC in , iron-peak and heavy elements, suggesting similar origins between these two GCs.
-
•
Star shows anomalies abundances with respect to the other stars of the sample. Even when this star is one of the AGB stars in our sample, we attribute this behaviour to some problem with the spectrum of star . Also exist a very low probability, but still possible, that this star may be a field star, even when it passed all the membership criteria.
In addition, considering that NGC 5927 (1) is a very old GC with an age between 10.7 Gyr VandenBerg et al. (2013) and 12.25 Gyr (Dotter et al., 2010), as old as the Milky Way itself; (2) its calculated orbit using proper motions (Allen et al., 2008) take place between 4 and 6 kpc; (3) the iron-peak enhancement in some elements follows the Bulge trend rather than the Thick Disk and; (4) the chemical similarities of NGC 5927 with Bulge GCs and especially with NGC 6440, lead us to consider a formation scenario where NGC 5927 was formed from material in-between the Bulge and Disk, when both structures were still in formation. The gas in this region of transition, with which NGC 5927 was formed, left chemical traces in the cluster with its properties in-between the Bulge and the Disk observed today.
6 AKNOWLEDGEMENTS
A.M gratefully acknowledges the support provided by Dirección de Postgrado UdeC and Chilean BASAL Centro de Excelencia en Astrofísica y Tecnologías Afines (CATA) grant PFB-06/2007 for international conference which helped to develop the paper. SV gratefully acknowledges the support provided by Fondecyt reg. n. 1170518. C.M. is supported by CONICYT (Chile) through Programa Nacional de Becas de Doctorado 2014 (CONICYT-PCHA/Doctorado Nacional/2014-21141057)
References
- Adibekyan et al. (2012) Adibekyan V. Z., Sousa S. G., Santos N. C., Delgado Mena E., González Hernández J. I., Israelian G., Mayor M., Khachatryan G., 2012, A&A, 545, A32
- Allen et al. (2008) Allen C., Moreno E., Pichardo B., 2008, ApJ, 674, 237
- Armandroff & Zinn (1988) Armandroff T. E., Zinn R., 1988, AJ, 96, 92
- Barbuy et al. (2016) Barbuy B., et al., 2016, A&A, 591, A53
- Beaulieu et al. (2000) Beaulieu S. F., Freeman K. C., Kalnajs A. J., Saha P., Zhao H., 2000, AJ, 120, 855
- Bensby et al. (2003) Bensby T., Feltzing S., Lundström I., 2003, A&A, 410, 527
- Bensby et al. (2010) Bensby T., et al., 2010, A&A, 512, A41
- Caloi & D’Antona (2011) Caloi V., D’Antona F., 2011, mnras, 417, 228
- Carretta et al. (2009a) Carretta E., et al., 2009a, aap, 505, 117
- Carretta et al. (2009b) Carretta E., Bragaglia A., Gratton R., Lucatello S., 2009b, aap, 505, 139
- Carretta et al. (2009c) Carretta E., Bragaglia A., Gratton R., D’Orazi V., Lucatello S., 2009c, A&A, 508, 695
- Casetti-Dinescu et al. (2007) Casetti-Dinescu D. I., Girard T. M., Herrera D., van Altena W. F., López C. E., Castillo D. J., 2007, AJ, 134, 195
- D’Antona et al. (2002) D’Antona F., Caloi V., Montalbán J., Ventura P., Gratton R., 2002, aap, 395, 69
- Decressin et al. (2007) Decressin T., Meynet G., Charbonnel C., Prantzos N., Ekström S., 2007, aap, 464, 1029
- Dekker et al. (2000) Dekker H., D’Odorico S., Kaufer A., Delabre B., Kotzlowski H., 2000, in Iye M., Moorwood A. F., eds, Proc. SPIEVol. 4008, Optical and IR Telescope Instrumentation and Detectors. pp 534–545, doi:10.1117/12.395512
- Denisenkov & Denisenkova (1989) Denisenkov P. A., Denisenkova S. N., 1989, Astronomicheskij Tsirkulyar, 1538, 11
- Dotter et al. (2010) Dotter A., et al., 2010, ApJ, 708, 698
- Francois (1991) Francois P., 1991, A&A, 247, 56
- Gilmore & Reid (1983) Gilmore G., Reid N., 1983, MNRAS, 202, 1025
- Gonzalez et al. (2011) Gonzalez O. A., et al., 2011, A&A, 530, A54
- Gratton et al. (2000) Gratton R. G., Carretta E., Matteucci F., Sneden C., 2000, A&A, 358, 671
- Gratton et al. (2006) Gratton R. G., Lucatello S., Bragaglia A., Carretta E., Momany Y., Pancino E., Valenti E., 2006, A&A, 455, 271
- Gratton et al. (2007) Gratton R. G., et al., 2007, A&A, 464, 953
- Harris (1996) Harris W. E., 1996, aj, 112, 1487
- Heitsch & Richtler (1999) Heitsch F., Richtler T., 1999, A&A, 347, 455
- Johnson et al. (2014) Johnson C. I., Rich R. M., Kobayashi C., Kunder A., Koch A., 2014, AJ, 148, 67
- King (1962) King I., 1962, aj, 67, 471
- Kurucz (1970) Kurucz R. L., 1970, SAO Special Report, 309
- Langer et al. (1993) Langer G. E., Hoffman R., Sneden C., 1993, PASP, 105, 301
- Marino et al. (2008) Marino A. F., Villanova S., Piotto G., Milone A. P., Momany Y., Bedin L. R., Medling A. M., 2008, A&A, 490, 625
- Mashonkina & Gehren (2001) Mashonkina L., Gehren T., 2001, A&A, 376, 232
- Minniti (1996) Minniti D., 1996, ApJ, 459, 579
- Muñoz et al. (2013) Muñoz C., Geisler D., Villanova S., 2013, mnras, 433, 2006
- Oort (1977) Oort J. H., 1977, ARA&A, 15, 295
- Origlia et al. (2005) Origlia L., Valenti E., Rich R. M., 2005, MNRAS, 356, 1276
- Origlia et al. (2011) Origlia L., et al., 2011, ApJ, 726, L20
- Ortolani et al. (1995) Ortolani S., Renzini A., Gilmozzi R., Marconi G., Barbuy B., Bica E., Rich R. M., 1995, Nature, 377, 701
- Pancino et al. (2017) Pancino E., et al., 2017, aap, 601, A112
- Pritzl et al. (2005) Pritzl B. J., Venn K. A., Irwin M., 2005, AJ, 130, 2140
- Reddy et al. (2003) Reddy B. E., Tomkin J., Lambert D. L., Allende Prieto C., 2003, mnras, 340, 304
- Reddy et al. (2006) Reddy B. E., Lambert D. L., Allende Prieto C., 2006, mnras, 367, 1329
- Renzini & Buzzoni (1986) Renzini A., Buzzoni A., 1986, in Chiosi C., Renzini A., eds, Astrophysics and Space Science Library Vol. 122, Spectral Evolution of Galaxies. pp 195–231, doi:10.1007/978-94-009-4598-2_19
- Rich et al. (2007) Rich R. M., Reitzel D. B., Howard C. D., Zhao H., 2007, ApJ, 658, L29
- Rojas-Arriagada et al. (2016) Rojas-Arriagada A., Zoccali M., Vásquez S., Ripepi V., Musella I., Marconi M., Grado A., Limatola L., 2016, A&A, 587, A95
- Rojas-Arriagada et al. (2017) Rojas-Arriagada A., et al., 2017, preprint, (arXiv:1704.03325)
- Rutledge et al. (1997) Rutledge G. A., Hesser J. E., Stetson P. B., 1997, pasp, 109, 907
- Schuster et al. (2006) Schuster W. J., Moitinho A., Márquez A., Parrao L., Covarrubias E., 2006, A&A, 445, 939
- Simmerer et al. (2013) Simmerer J., Feltzing S., Primas F., 2013, aap, 556, A58
- Sneden (1973) Sneden C., 1973, apj, 184, 839
- Sneden (2004) Sneden C., 2004, Mem. Soc. Astron. Italiana, 75, 267
- Sneden et al. (2008) Sneden C., Cowan J. J., Gallino R., 2008, ARA&A, 46, 241
- Sofue et al. (2009) Sofue Y., Honma M., Omodaka T., 2009, PASJ, 61, 227
- Tinsley (1979) Tinsley B. M., 1979, apj, 229, 1046
- Van der Swaelmen et al. (2016) Van der Swaelmen M., Barbuy B., Hill V., Zoccali M., Minniti D., Ortolani S., Gómez A., 2016, A&A, 586, A1
- VandenBerg et al. (2013) VandenBerg D. A., Brogaard K., Leaman R., Casagrande L., 2013, apj, 775, 134
- Villanova & Geisler (2011) Villanova S., Geisler D., 2011, A&A, 535, A31
- Villanova et al. (2013) Villanova S., Geisler D., Carraro G., Moni Bidin C., Muñoz C., 2013, apj, 778, 186
- Zoccali et al. (2003) Zoccali M., et al., 2003, A&A, 399, 931
- de Mink et al. (2009) de Mink S. E., Pols O. R., Langer N., Izzard R. G., 2009, Proceedings of the International Astronomical Union, 5, 169