The Association of Molecular Gas and Natal Super Star Clusters in Henize 2-10
Abstract
We present ALMA observations of the dwarf starburst galaxy He 2-10 in combination with previous SMA CO observations to probe the molecular environments of natal super star clusters. These observations include the HCO+(1-0), HCN(1-0), HNC(1-0), and CCH(1-0) molecular lines, as well as 88 GHz continuum with a spatial resolution of . After correcting for the contribution from free-free emission to the 88 GHz continuum flux density ( 60% of the 88 GHz emission), we derive a total gas mass for He 2-10 of M⊙, roughly 5-20% of the dynamical mass. Based on a principle component analysis, HCO+ is found to be the best “general” tracer of molecular emission. The line widths and luminosities of the CO emission suggests that the molecular clouds could either be as small as pc, or alternately have enhanced line widths. The CO emission and 88 GHz continuum are anti-correlated, suggesting that either the dust and molecular gas are not cospatial, which could reflect the 88 GHz continuum is dominated by free-free emission. The CO and CCH emission are also relatively anti-correlated, which is consistent with the CCH being photo-enhanced, and/or the CO being dissociated in the regions near the natal super star clusters. The molecular line ratios of regions containing the natal star clusters are different from the line ratios observed for regions elsewhere in the galaxy. In particular, the regions with thermal radio emission all have CO(2-1)/HCO, and the HCO+/CO ratio appears to be correlated with the evolutionary stage of the clusters.
1. Introduction
Millimeter observations of starburst galaxies have demonstrated that their spectra contain numerous molecular lines. Over the last two decades spatially resolved observations using interferometers of relatively nearby systems Mpc have become prevalent (e.g. NGC 253, García-Burillo et al. 2000 and IC 342, Meier & Turner 2005). Now with the addition of the Atacama Large Millimeter/submillimeter Array (ALMA) to our toolbox, detailed studies of molecular lines in even more distant galaxies are becoming commonplace. The detected molecular lines can provide new insight into the physical conditions of their host galaxies, including temperatures, densities, and radiation fields. Our goal in this program is to utilize the sensitivity and resolution of ALMA to investigate the physical conditions associated with the so-called “super star clusters”.
Super star clusters (SSCs) have stellar densities exceeding stars pc-3 in their cores and masses often exceeding M⊙. As “extreme” objects, one might be tempted to simply think of SSCs as “cosmic curiosities”. However, these objects are not only fascinating because of their extreme nature, but also because they hold clues to an important mode of star formation during the time of galaxy assembly. Specifically, most present-day research strongly supports the idea that SSCs are the adolescent precursors to the ancient globular clusters ubiquitous around massive galaxies in the local universe today (e.g. Harris, 2003, and references therein). Given their estimated infant mortality rates (possibly as high as 99%; Fall & Zhang, 2001), the production of SSCs must have been truly prodigious in the early universe, making this extreme type of star formation a critical (and perhaps dominant) mode in the early evolution of today’s massive galaxies.
SSCs are also important components of galaxies in the present-day universe. These clusters can have a major impact on their surrounding interstellar medium (ISM), and in some cases even the intergalactic medium (IGM). Each of these clusters can host thousands of massive stars with powerful stellar winds that will all die in a violent way within a span of a few million years. The collective effect of these massive stars can cause tremendous outflows, ionize large volumes of the ISM and IGM, and enrich vast amounts of interstellar material (e.g. Johnson, et al., 2000; Heckman, 2001; Martin, Kobulnicky, & Heckman, 2002)
Radio and infrared observations have identified nascent SSCs (e.g. Kobulnicky & Johnson, 1999; Turner, Beck, & Ho, 2000), still embedded in their birth material. However, the physical conditions in these regions have been virtually impossible to assess without sufficient millimeter capabilities.
1.1. The Target Galaxy: Henize 2-10
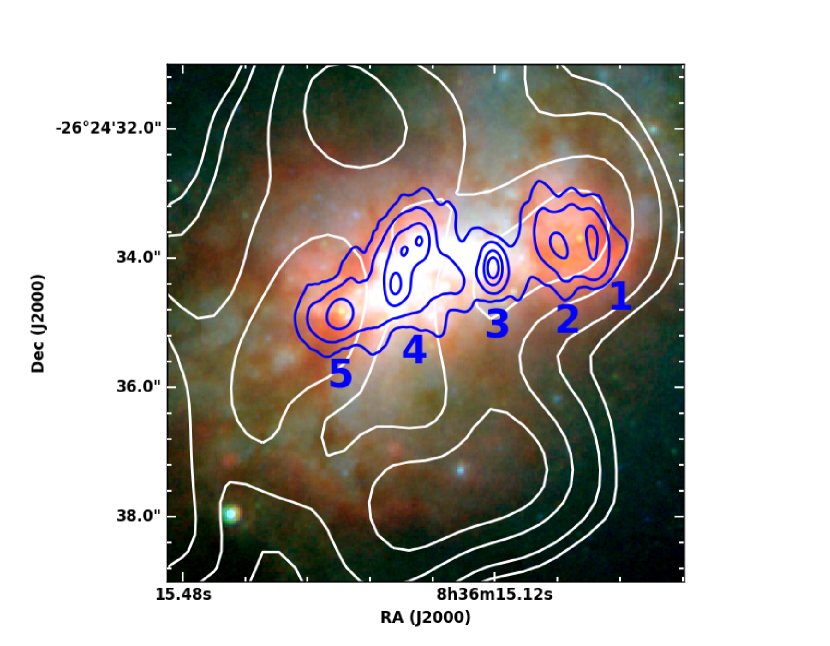
Henize 2-10 (He 2-10) is a remarkable blue compact dwarf galaxy that has attracted astronomers’ interest for decades, largely due to its high star formation rate (0.7 M⊙ yr-1, Lee, et al., 2009) and powerful outflows ( km s-1 Johnson, et al., 2000). He 2-10 is the nearest ( Mpc) galaxy known to host multiple nascent super star clusters detected in radio and infrared observations (see Figure 1, Kobulnicky & Johnson, 1999; Johnson & Kobulnicky, 2003; Vacca, Johnson, & Conti, 2002; Cabanac, Vanzi, & Sauvage, 2005). More recently, a low-luminosity AGN was identified in this system, making He 2-10 the first known example of a starbursting dwarf hosting a massive black hole (Reines, et al., 2011, 2016).
With its intense burst of star formation, irregular morphology (see Figure 2), large population of adolescent super star clusters (Johnson, et al., 2000), and low-luminosity AGN (Reines, et al., 2011), many of the properties of He 2-10 are similar to those expected of protogalaxies at high redshift during the early stages of hierarchical galaxy assembly and globular cluster formation. Especially important for this study is the presence of multiple nascent super star clusters detected through their thermal radio emission. Given these characteristics, He 2-10 is (arguably) one of the best available nearby laboratories in which to study the extreme physical conditions that lead to the formation of SSCs (and may have led to the formation of globular clusters). In this context it is also important to note that, unlike most dwarf galaxies, He 2-10 actually has relatively high metallicity of log(O/H) inferred by Kobulnicky, Kennicutt, & Pizagno (1999), however the effect of non-primordial metallicities on star formation remains poorly constrained. Long wavelength observations are essential to probe the birth environments of these clusters, and (sub)millimeter observations also provide molecular diagnostics that can be used to infer physical properties.
He 2-10 has a range of existing millimeter observations (Santangelo, et al., 2009; Vanzi et al., 2009; Imanishi, et al., 2007; Meier, et al., 2001; Kobulnicky, et al., 1995). The CO(1-0) observations of Kobulnicky, et al. (1995) with a beam size of indicated a dynamically perturbed system, with the peak CO emission offset by pc from the optical peak, and an elongated feature roughly ( kpc) in extent, which those authors interpreted as a tidal feature, but is also consistent with an infalling cloud. Using CO(3-2), CO(2-1), and CO(1-0) observations with a beam, Meier, et al. (2001) find a best-fit solution of cm-3 and T K. These results are in apparent tension with those of Bayet, et al. (2004), who found T K and cm-3 using higher level CO transitions (up to CO(7-6)) with beam sizes ranging from (although these authors note that He 2-10 is point-like for all lines). Imanishi, et al. (2007) observed He 2-10 with a beam of , and find the HCN(1-0)/HCO+(1-0), which is relatively low compared to the AGN-dominated galaxies in their sample 111The massive black hole in He 2-10 is radiating significantly below its Eddington limit ( LEdd Reines, et al., 2016), and therefore we do not necessarily expect the line ratios to be similar to more luminous AGNs.. Vanzi et al. (2009) obtained APEX observations of He 2-10 in CO(3-2) and HCN(4-3) with a beam; they do not detect the CO elongation noted by Kobulnicky, et al. (1995), but they clearly detect two velocity components including a feature to the north-east. Santangelo, et al. (2009) obtained significantly higher spatial resolution observations of He 2-10 than previous studies, with a beam from the SMA. These observations revealed complex spatial structure, including a bright CO feature toward the south-east, which could be associated with the “tail” identified by Kobulnicky, et al. (1995). In addition, they find possible evidence for the association of compact molecular clouds and super star clusters.
Figure 1 shows the central region of He 2-10 with the CO(2-1) and 3.6 cm radio emission overlaid in contours, and the radio sources 1-5 (as originally numbered by Kobulnicky & Johnson, 1999). Sources 1, 2, 3, and 5 are consistent with locations of CO emission. Source 4 appears to fall in a CO valley, which is consistent with the slightly non-thermal radio spectral index, and the inference of Cabanac, Vanzi, & Sauvage (2005) that this region includes supernova remnants, suggesting the presence of star clusters at least a few Myr in age. Cabanac, Vanzi, & Sauvage (2005) also determine that Sources 1, 2, and 5 likely have optical extinctions A, consistent with these sources still being highly embedded in their birth material. Source 3 has a non-thermal spectral index (Johnson & Kobulnicky, 2003), and was confirmed by Reines, et al. (2011) to host a low-luminosity AGN.
In order to better understand the complex molecular emission in this dwarf galaxy, we present sensitive new ALMA observations of the HCO+(1-0), HCN(1-0), HNC(1-0), and CCH(1-0) transitions together with analysis of existing SMA CO(2-1) data.
The paper is organized as follows: In §2 we give an overview of the observations used in this analysis. §3, we present the properties of the line and continuum emission, including morphologies, strengths, line widths, ratios, as well as a principle component analysis, a comparison to single dish observations, and the inferred gas and dust mass. In §4 we discuss the extent to which these molecular line ratios may be tracking the evolution of super star clusters, and further compare the results to those of other galaxies. Finally, in §5, we summarize the main points of this paper.
2. Observations
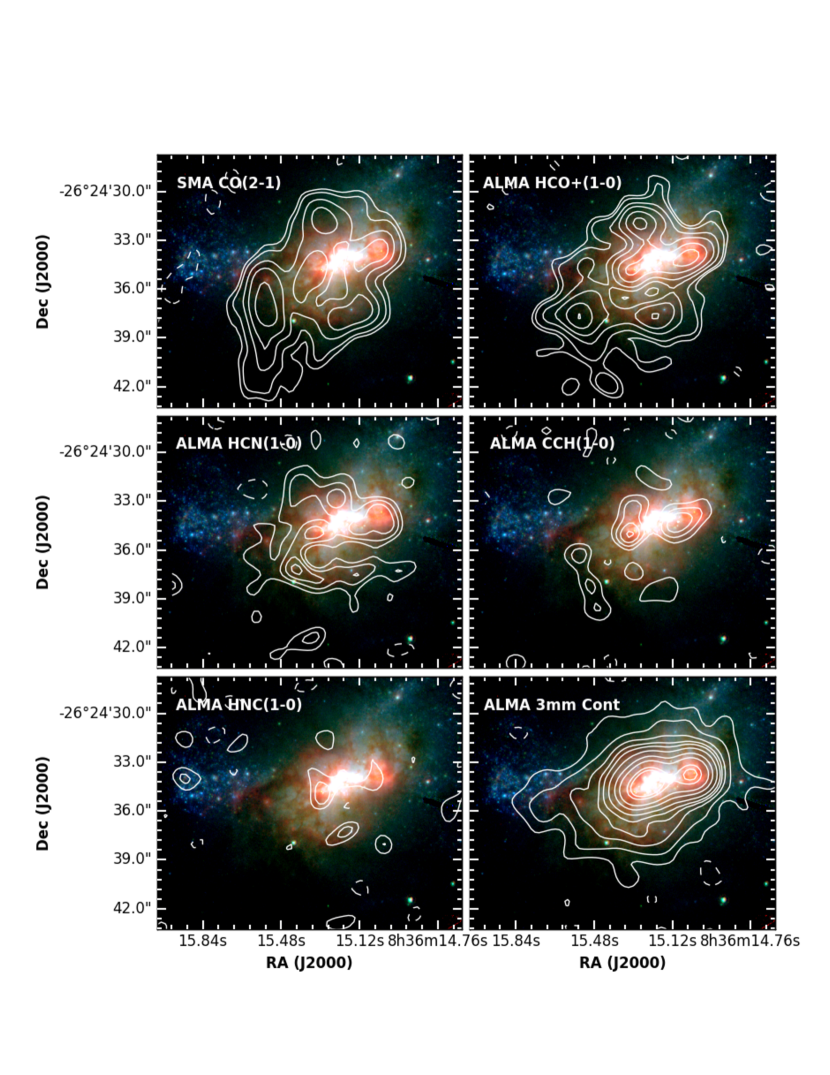
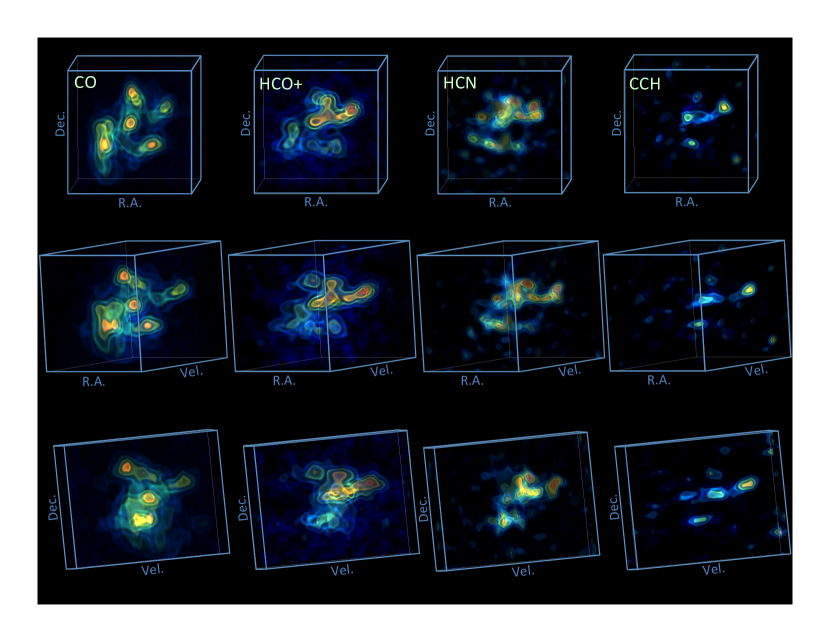
Henize 2-10 was observed with ALMA Band 3 (86.9-90.7 GHz and 98.8-102.5 GHz) between May and December of 2012 (program code 2011.0.00348.S). The total time on source was 3.6 hours, with the number of antennas on-line varying between 15-25 and projected baseline lengths from m. Titan and Ceres were used as the primary amplitude calibrators, and based on the observed variation we estimate the flux uncertainty to be %. The bandpass calibrator used was J053851-440507, and the phase calibrator was J082601-223027. Synthesis images were created with Briggs weighting and a robust parameter of 0.5. Spectral regions around the emission lines were flagged and the remaining 7GHz of bandwidth in 4 spectral windows was combined to create a 3.3 mm continuum image with angular resolution of (70 pc65 pc) and rms of 1.110-5 Jy bm-1. The HCN(1-0), HNC(1-0), HCO+(1-0), and CCH(1-0) lines were imaged at (75 pc70 pc) resolution with an rms of 0.45 mJy bm-1 per 10 km s-1 channel. All lines were strongly detected (Figure 2). Rotations of the full velocity cubes created with the yt program (Turk et al., 2011) are shown in Figure 3. The telescope primary beam (55′′) is much larger than the galaxy (10′′) so no primary beam correction is required.
We also incorporate existing SMA CO(2-1) observations with a resolution of (Santangelo, et al., 2009) in this analysis. SMA data was combined from both a compact and an extended configuration, resulting in baseline lengths between 10 and 180m, and imaged with natural weighing. The rms noise for these observations was 19 mJy beam-1 per 5 km s-1 channel. The original observations and data reduction are described in Santangelo, et al. (2009).
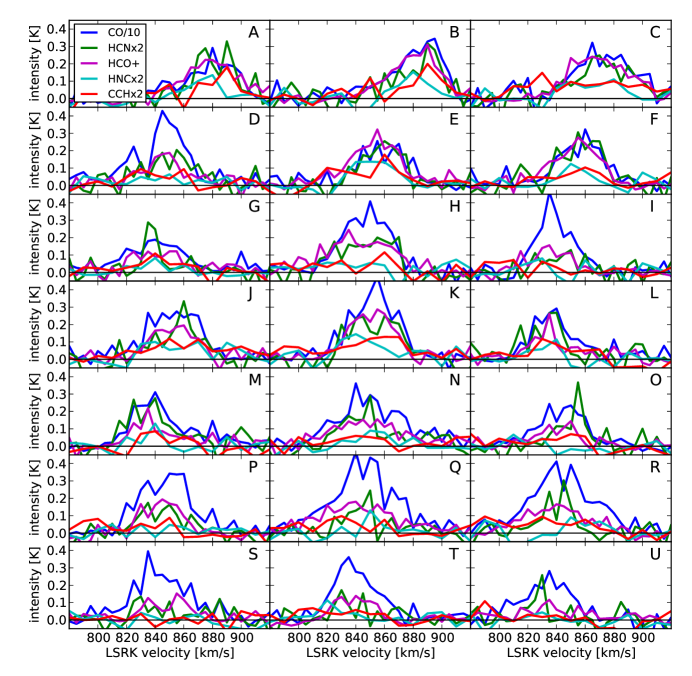
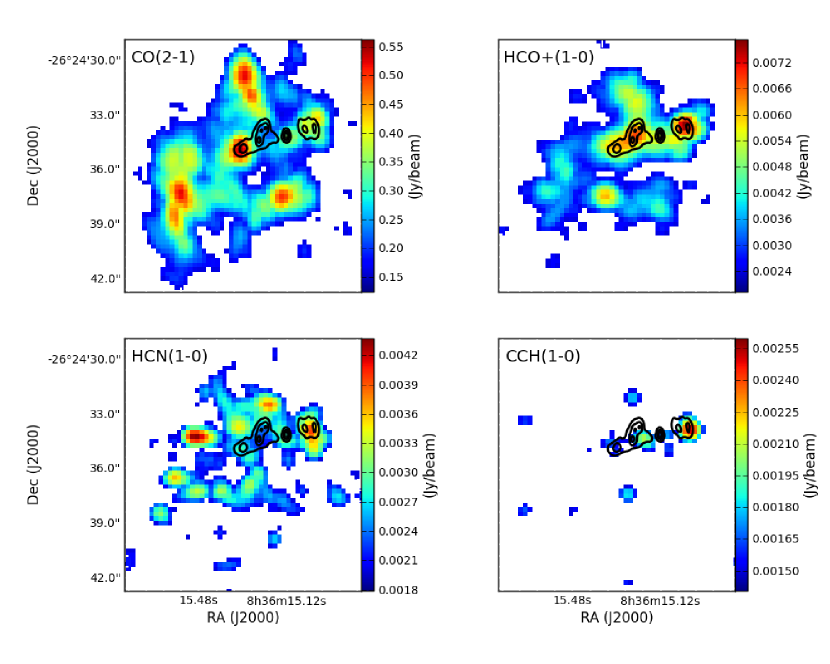
The spectra of molecular species discussed here for each of the regions analyzed in this paper are shown in Figure 4. Total intensity maps (moment 0) were created by integrating between velocities of 770-935 km s-1. Peak intensity (moment 8) maps were created using the following thresholds: 160 mJy beam-1 for CO(2-1), 2.4 mJy beam-1 for HCO+(1-0), 2.0 mJy beam-1 for HCN(1-0) and HNC(1-0), and 1.5 mJy beam-1 for CCH(1-0).
3. Results
3.1. Morphology of the molecular emission
The different molecular lines observed here have the potential to aid in the physical interpretation of the starburst taking place in He 2-10. To first order their critical densities (ncrit) and transition energies can provide insight into their physical environment, even if the full astrochemical solutions including formation and destruction pathways are undoubtedly more complex.
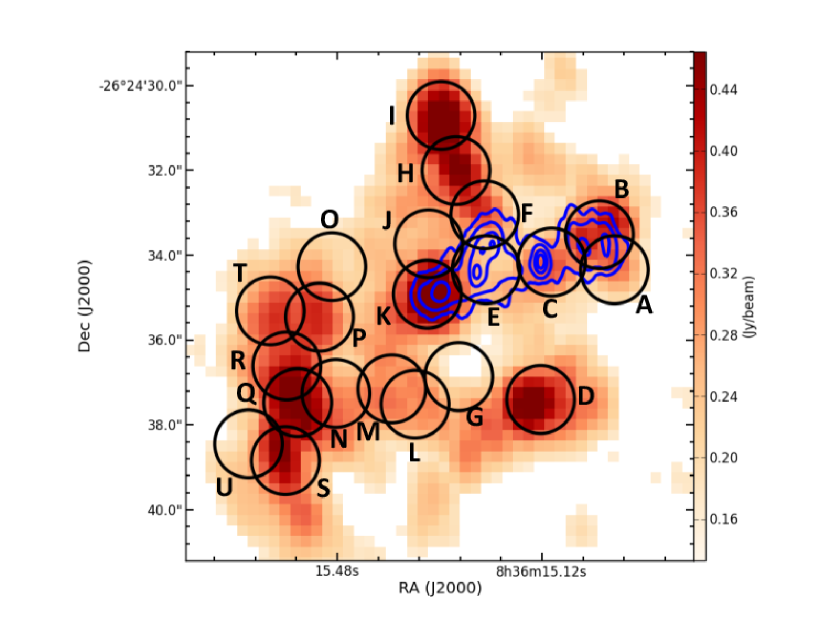
To facilitate the analysis of these observations we define regions of radius (roughly the beam size) around peaks in the Moment 8 (peak intensity) maps for each transition, as shown in Figure 5 and Figure 6. Fluxes were measured in r=0.8′′ circular apertures on the image integrated in velocity from 770 to 935 km s-1. The emission lines do not peak at precisely the same positions, so to calculate a conservative uncertainty, the peak position of each line in each aperture was determined, a new flux measured for each recentered aperture, and the dispersions of those recentered fluxes used as a measure of the uncertainty due to source position. To that in quadrature was added a 20% absolute calibration uncertainty and the rms noise in images. For non detections, 5 times the rms noise of the image is quoted as an upper limit. These values along with the inferred molecular masses for these regions, Mmol, are provided in Table 1.
| ID | R.A. | Dec. | CO(2-1) | HCO+(1-0) | HCN(1-0) | HNC(1-0) | CCH(1-0) | Mmol |
|---|---|---|---|---|---|---|---|---|
| (J2000) | (J2000) | (K km s-1) | (K km s-1) | (K km s-1) | (K km s-1) | (K km s-1) | ( M⊙) | |
| A | 8h36m14.99s | -26d24m34.4s | 87.6 17.5 | 9.01.8 | 4.81.0 | 2.9 0.7 | 3.5 | |
| B | 8h36m15.02s | -26d24m33.5s | 137.327.5 | 10.32.1 | 4.20.8 | 1.4 0.5 | 3.4 1.0 | 5.5 |
| C | 8h36m15.10s | -26d24m34.2s | 142.928.6 | 12.52.5 | 4.20.8 | 2.1 0.4 | 5.5 1.1 | 5.8 |
| D | 8h36m15.12s | -26d24m37.4s | 157.931.6 | 6.81.4 | 3.90.8 | 1.5 0.7 | 2.3 0.5 | 6.5 |
| E | 8h36m15.22s | -26d24m34.4s | 102.420.5 | 12.32.5 | 3.60.7 | 2.8 0.8 | 1.4 0.6 | 4.1 |
| F | 8h36m15.22s | -26d24m33.1s | 114.422.9 | 10.12.0 | 4.60.9 | 2.0 0.7 | 1.4 0.3 | 1.9 |
| G | 8h36m15.27s | -26d24m36.9s | 106.721.3 | 5.61.1 | 2.00.4 | 1.3 0.5 | 1.3 0.4 | 4.6 |
| H | 8h36m15.27s | -26d24m32.0s | 148.329.7 | 11.82.4 | 3.10.6 | 1.9 0.5 | 1.1 0.3 | 5.9 |
| I | 8h36m15.30s | -26d24m30.7s | 107.121.4 | 4.81.0 | 1.80.4 | 1.5 0.3 | 4.3 | |
| J | 8h36m15.32s | -26d24m33.7s | 141.328.3 | 7.91.6 | 2.40.5 | 2.4 0.6 | 3.8 1.0 | 5.7 |
| K | 8h36m15.32s | -26d24m34.9s | 169.033.8 | 11.52.3 | 4.30.9 | 2.8 0.6 | 3.7 0.9 | 6.8 |
| L | 8h36m15.34s | -26d24m37.5s | 107.121.4 | 5.41.1 | 4.00.8 | 1.4 0.7 | 4.3 | |
| M | 8h36m15.38s | -26d24m37.2s | 114.322.9 | 5.41.1 | 4.91.0 | 4.6 | ||
| N | 8h36m15.48s | -26d24m37.3s | 163.732.7 | 9.01.8 | 3.40.7 | 2.2 0.5 | 6.5 | |
| O | 8h36m15.49s | -26d24m34.3s | 85.717.1 | 4.30.9 | 2.30.5 | 1.5 0.3 | 3.4 | |
| P | 8h36m15.51s | -26d24m35.5s | 153.130.6 | 4.91.0 | 2.80.6 | 1.4 0.6 | 1.5 0.4 | 6.1 |
| Q | 8h36m15.55s | -26d24m37.5s | 220.244.0 | 11.12.2 | 2.40.5 | 1.7 0.5 | 8.8 | |
| R | 8h36m15.57s | -26d24m36.6s | 205.641.1 | 7.61.5 | 2.80.6 | 1.5 0.5 | 8.2 | |
| S | 8h36m15.57s | -26d24m38.9s | 134.226.8 | 5.01.0 | 1.30.3 | 5.4 | ||
| T | 8h36m15.60s | -26d24m35.3s | 131.426.3 | 3.80.8 | 2.40.5 | 1.2 0.3 | 1.2 0.3 | 5.3 |
| U | 8h36m15.64s | -26d24m38.4s | 87.517.5 | 4.10.8 | 1.30.3 | 3.5 |
Note. — Mmol calculated assuming (K km s-1 pc2)-1 for regions with a radius of (pc at a distance of 9 Mpc).
3.1.1 CO(2-1) Emission
Given its high abundance and low critical density ( cm-3), CO is an important “generic” molecular gas tracer. This line has the highest upper state energy of the tracers used here of T K. CO is also relatively easily photo-dissociated from the ground-state, requiring only 11.09 eV. Thus, we expect CO to be rapidly destroyed amid the strong ultraviolet emission from young massive stars.
While CO(2-1) emission is detectable throughout the body of He 2-10, it is not preferentially peaked near the locations of the natal super star clusters (see Figure 5). In fact, only the eastern-most thermal radio source shows particularly strong CO(2-1) emission (region K, see Fig. 6), suggesting that perhaps this cluster is among the youngest in the system. However, a number of distinct CO clouds are located throughout the full 3D cube. Assuming a CO line intensity to mass conversion factor of M⊙ pc-2 (K km s-1)-1 (Bolatto, Wolfire, & Leroy, 2013) and adopting a conversion of CO(2-1)CO(1-0) these regions have masses of up to M⊙ and likely indicate the regions where the next generation of star clusters will form.
3.1.2 HCN(1-0) and HNC(1-0) Emission
HCN(1-0) is the highest critical density tracer used here, with cm-3 at 50 K for optically thin gas (Shirley, 2015)222Note that for optically thick gas, radiative trapping will result in an “effective” excitation density which can be significantly lower than the value calculated for optically thin gas (Shirley, 2015), but has an upper state energy of T K, similar to HCO+. HNC(1-0) has a somewhat lower critical density than HCN(1-0) with cm-3 at 50 K for optically thin gas (Shirley, 2015), but requires an upper state energy of T K.
The relative strength of these isomers is likely driven by the hydrogen exchange reaction (Talbi, Ellinger, & Herbst, 1996). The activation barrier for these two reactions is quite different, with the requiring four times the activation energy of (Talbi, Ellinger, & Herbst, 1996; Graninger, et al., 2014). The behavior of the HNC/HCN ratio was studied extensively by Schilke, et al. (1992) and appears to show a strong inverse temperature dependence – with HNC/HCN near unity in the cold regions of OMC-1, but falling to in the warm Orion-KL region.
For these ALMA observations of He 2-10, we would have predicted relatively higher molecular gas temperatures in the vicinity of the natal super star clusters. Although the HNC is only detected at the 3-5 level, and only in the vicinity of the nascent SSCs, the apparent HNC/HCN ratio in these areas varies between . If we assume this ratio is inversely related to temperature, this suggests the warmest molecular regions are in the vicinity of regions B and F, which are in the vicinity of natal super star clusters detected via thermal radio emission. However, regions E and K which are also associated with young super star clusters have ratios of HNC/HCN – indicating cooler temperatures. Thus, our original hypothesis that the HNC/HCN ratio would be lowest near the natal clusters in not confirmed. However, it is entirely possible that given the spatial resolution of these data, each region could contain a range of physical conditions, and some gas affected more and some less by the natal clusters, which complicates the analysis.
3.1.3 HCO+(1-0) Emission
With an optically-thin critical density of cm-3 at 50 K (Shirley, 2015), and an upper state energy of T K, HCO+ is a prevalent moderate-density tracer. Of the molecular lines studied here, HCO+ is the most closely associated with the natal super star clusters (see Figure 5), with strong peaks on each of the sources of thermal radio emission. Curiously, the HCO+ and HCN emission are not particularly well correlated (see Figure 5 and Section 3.3), despite their similar critical densities and upper state energies; the ratio of HCN/HCO+ varies between across He 2-10, with the highest values associated with regions outside of the area of thermal radio emission.
3.1.4 CCH(1-0) Emission
The CCH(1-0) emission observed here is a blend of two hyperfine lines at 87.317 GHz and 87.329 GHz and , which have upper state energies of T K. CCH is one of the most abundant hydrocarbons and is believed to be enhanced by CO dissociation in strong ultraviolet radiation fields (e.g., Beuther et al., 2008; Mártin, et al., 2014). Therefore, it is not surprising that the CCH emission peaks near the locations of the natal super star clusters (see Figure 5) where the CO emission is relatively low.
The CCH may also indicate another interesting feature: as noted in Section 1, the CO-bright Eastern cloud may be associated with a gas-rich cloud falling into the galaxy; Kobulnicky, et al. (1995) detect a kinematically distinct elongated CO feature to the south-east of the main galaxy (with the southern end pointing at RA=8h36m15.48s), which could be interpreted as an infalling gas cloud. In Figure 2 a bright elongated region of CCH emission that can be seen running northeast-southwest. This CCH feature is coincident with the inside edge of the kinematically distinct CO cloud – if the CO cloud is falling in, the CCH could be highlighting the area of intersection. This correspondence could be merely circumstantial, but may indicate the radiation from the central star-forming zone is leaking out and illuminating the front edge of the in-falling CO cloud.
3.2. Line Widths
The width of the emission lines from each of the regions identified in Figure 6 were fit with a Gaussian model and measured in CASA. In general, the strength of the HNC and CCH emission was not strong enough to measure a line width, and for a few regions this was also true of the HCN and/or HCO+ lines. The resulting line widths are presented in Table 2.
| ID | CO(2-1) | HCN(1-0) | HCO+(1-0) |
|---|---|---|---|
| (km s-1) | (km s-1) | (km s-1) | |
| A | |||
| B | |||
| C | |||
| D | |||
| E | |||
| F | |||
| G | — | — | |
| H | |||
| I | — | ||
| J | |||
| K | |||
| L | |||
| M | |||
| N | |||
| O | — | ||
| P | |||
| Q | — | ||
| R | — | ||
| S | — | ||
| T | — | ||
| U | — | — |
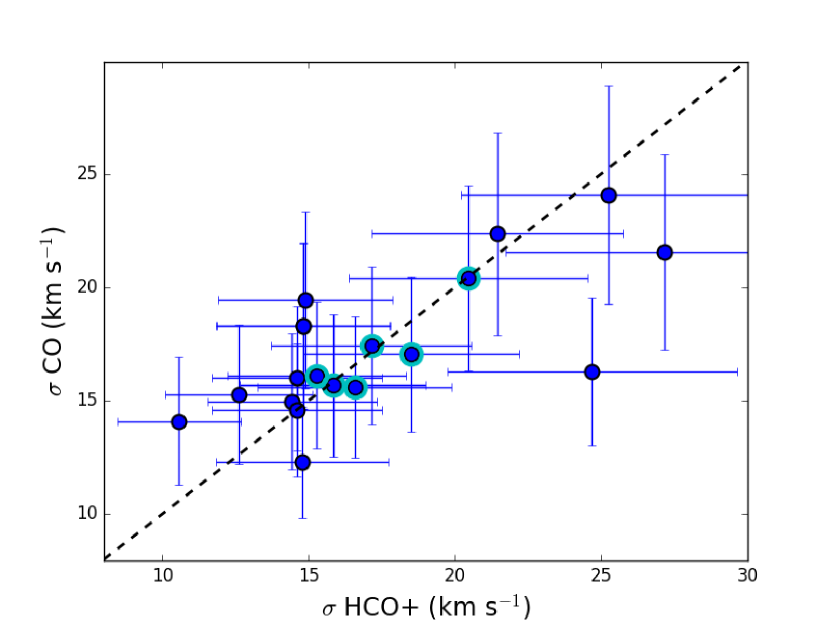
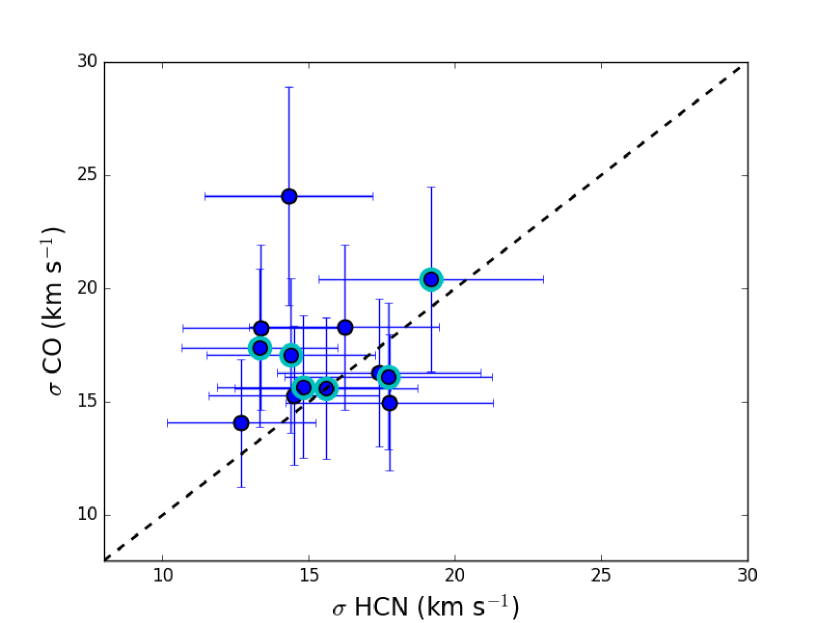
As shown in Figure 8, the line-widths of CO, HCN, and HCO+ roughly follow a one-to-one relationship with some scatter. The lack of an apparent trend in line-width with respect to species is circumstantial evidence that these molecules are tracking the same components of a given molecular cloud. If, for example, any of these species were preferentially associated with outflows or cloud collapse, one might predict a difference in the observed line widths. However, on the size scales of the regions measured here (1.′′6 diameter, pc ), any trends in molecular line widths may well be rendered invisible by averaging over numerous discrete clouds. The regions that include areas of thermal radio emission are also indicated in Figure 8. We originally hypothesized that regions containing natal SSCs might preferentially exhibit larger line-widths as the stars inject energy into the surrounding ISM; in so far as line-widths are related to the temperature and turbulence in a cloud, these should increase as stars inject energy into their surrounding medium. However there are no apparent trends with respect to whether a region is associated with thermal radio emission.
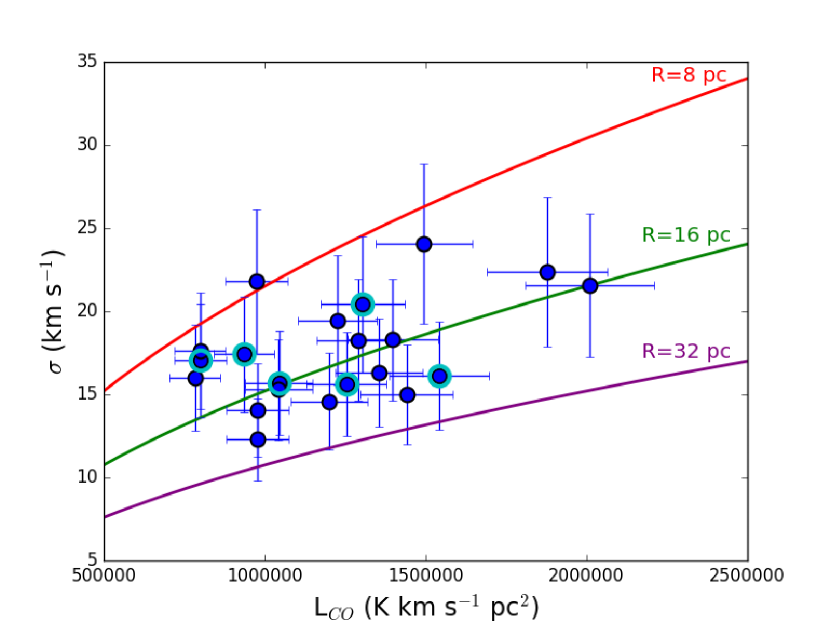
In addition, we investigate the relationship between the CO luminosity and the associated line width, as shown in Figure 9. Given that these molecular clouds are not resolved, we cannot put these data points on a size-line-width relation. However, based on the work of Heyer, et al. (2009), we rearrange the standard size-linewidth-surface density relationship as follows:
| (1) |
We again adopt M⊙ pc-2 (K km s-1)-1 (Bolatto, Wolfire, & Leroy, 2013), and assume CO(2-1)CO(1-0). Thus, for a given radius, it is possible to determine the predicted line width based on this equation. Lines corresponding to radii of 8 pc, 16 pc, and 32 pc are over-plotted in Figure 9. The location of the data points from the regions in He 2-10 suggest that either 1) the molecular clouds have radii of pc, or alternatively 2) the clouds could be larger, but have enhanced line widths – potentially due to high pressure environments as seen in Johnson, et al. (2015).
3.3. Principle Component Analysis
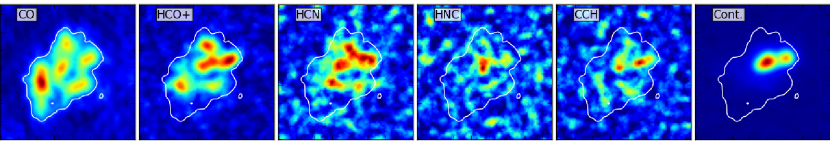
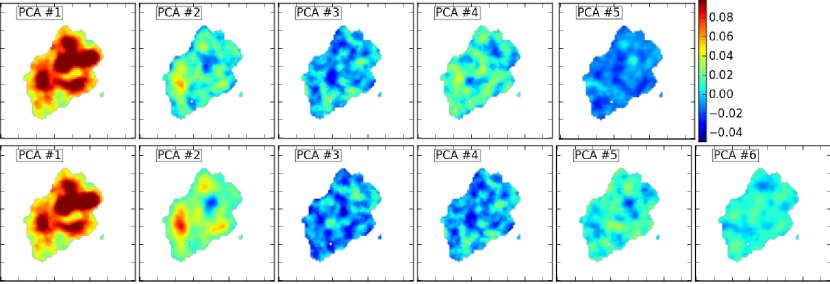
To quantify the emission distribution in an objective way, we perform a Principle Component Analysis (PCA) of the integrated intensity images. The images are first normalized before calculation of eigenvectors and eigenimages in order to avoid the calculation dominated by the strongest emission (CO in this case). We tested normalizing both each integrated intensity image by its peak, and alternatively normalizing each image by its rms. The ratio of peak to rms varies between 4.5 and 6.5 and therefore the results do not change qualitatively depending on the normalization; here we show the results when images are normalized by their rms. In order to mitigate spurious results, we apply a threshold in the CO(2-1) emission of 3, and the associated region is adopted in the analysis of all images. The results are not sensitive to choices for that threshold between 2.5 and 4. Figure 7 shows the integrated intensity images and the principle component images on the same scale. Figure 10 shows the eigenvectors.
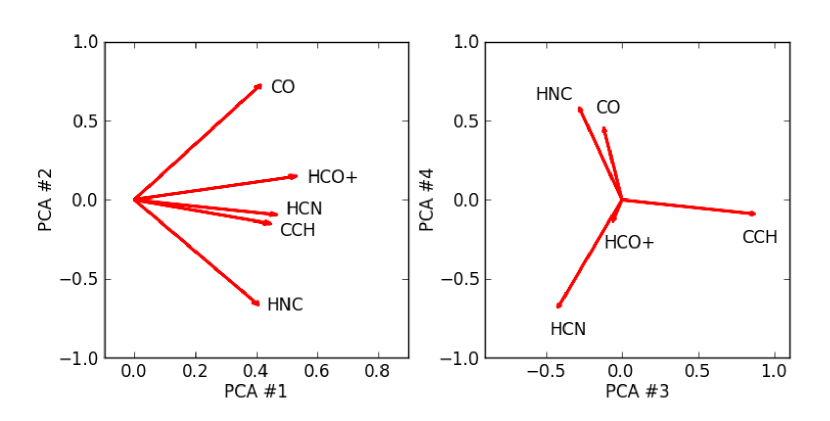
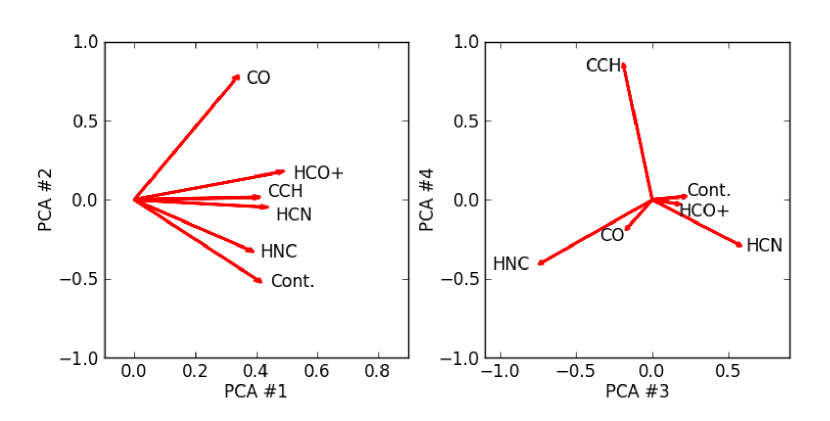
The PCA analysis reveals several interesting trends. For example, looking at the first component (which indicates how similar or different emission from a given line is to the average emission morphology of the galaxy); quantitatively, HCO+ is the most generic tracer of molecular emission (its eigenvector is nearly along PCA#1 with little projection along the other components in Figure 10).
The second component (which indicates how different emission morphology in a given line is from the average) also reveals interesting features. From the PCA#2 vectors (Fig. 10), it is apparent that the CO(2-1) and HNC(1-0) are the most different, and strongly anti-correlated. The morphology of the PCA#2 intensity map (Fig. 7) and its morphology highlights the southeastern cloud complex (containing sources N,U,Q,R,S,T), which is particularly strong in CO emission, but has limited emission in the other lines. It is also noteworthy that CO and CCH show substantially different vectors, which would be expected if CCH emission is enhanced by CO photodissociation. Curiously the CO and continuum emission are the most different, suggesting that the either the dust and molecular gas components of the galaxy are not cospatial, or the 88 Ghz continuum is dominated by free-free emission (see Section 3.6). A similar result was previously observed by Kepley, et al. (2016) for the relatively low metallicity galaxy IIZW40 (12+log(O/H)=8.09, Z⊙ Guseva, Izotov, & Thuan, 2000), where they found that dust emission was not significant below frequencies of Ghz. Given the metallicity of IIZW40, the reduced dust content is not surprising. However, He 2-10 has roughly solar metallicity (Kobulnicky, et al., 1995), and we would not expect a reduced dust content.
In general, higher order principle components tend to have decreasing signal to noise, but it is evident by eye that components 3 and 4 are still capturing physically interesting information. In the analysis without the continuum, PCA#3 indicates the difference between CCH and the other lines, highlighting an elongated region, also bright in the CCH image, that lies in between the CO-bright E cloud and the main body of He 2-10. That region is captured by PCA#4 in the analysis including continuum.
3.4. Line Ratios
While the PCA analysis in Section 3.3 provides a general census of the relationship between emission from the molecular lines observed here, in order to probe how this line emission may depend on local physical conditions, we determine the various line strengths and ratios in specific regions. In particular, we determine the line intensities in the regions of radius located around peaks in the peak intensity maps for each transition (see Figure 6 and Table 1).
As discussed in Section 3.1, the ratios of different molecular transitions hold the potential of providing constraints on the physical conditions due to their differential dependence on temperature and density. These line ratios are also dependent on the relative abundances of each species, which reflects the chemical pathways (both formation and destruction) in a given physical environment. Here we utilize CO(2-1), HCN(1-0), HNC(1-0), HCO+(1-0), and CCH(1-0), (although we caution the reader that many of the HNC(1-0) and CCH(1-0) measurements are relatively weak, and have correspondingly large uncertainties.
Given the critical densities and the energy levels of these transitions, to first order, we expect the CO(2-1)/HCN(1-0) and CO(2-1)/HCO+(1-0) ratios to reflect the relative density of the gas. The ratio of the HCN(1-0) to HNC(1-0) isomers can also be instructive because these isomers have similar dipole moments and energy levels; the ratio of the HCN(1-0) and HNC(1-0) lines can provide insight into chemical pathways and activation temperatures. We also expect the CCH(1-0)/CO(2-1) ratio to track the hard radiation field of newly-formed massive stars, given that CCH is enhanced by the photodissociation of CO. Despite their similar energy levels and critical densities, the HCN(1-0)/HCO+(1-0) ratio is known to show strong variations near XDRs (decreasing to ), while it is larger () in PDRs if the density is relatively high (Meijerink, Spaans, & Israel, 2007).
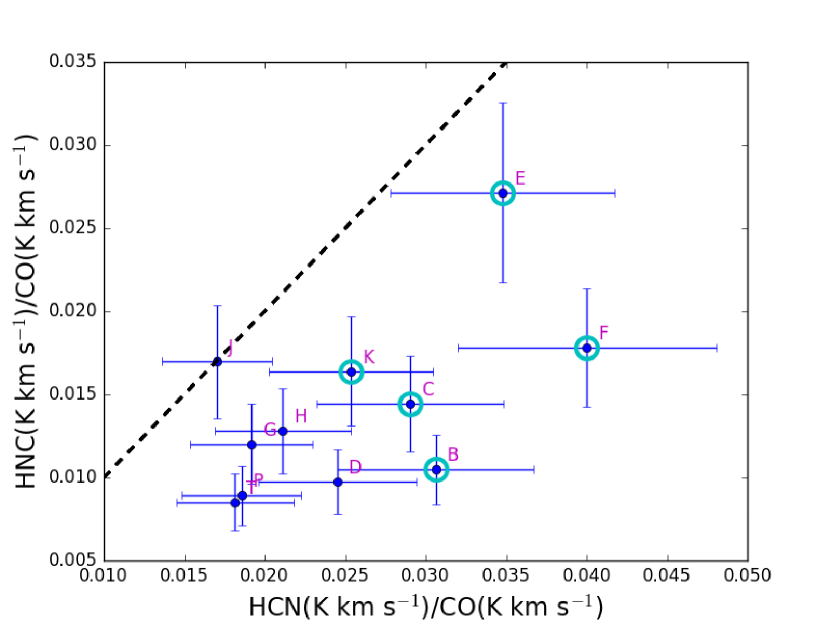
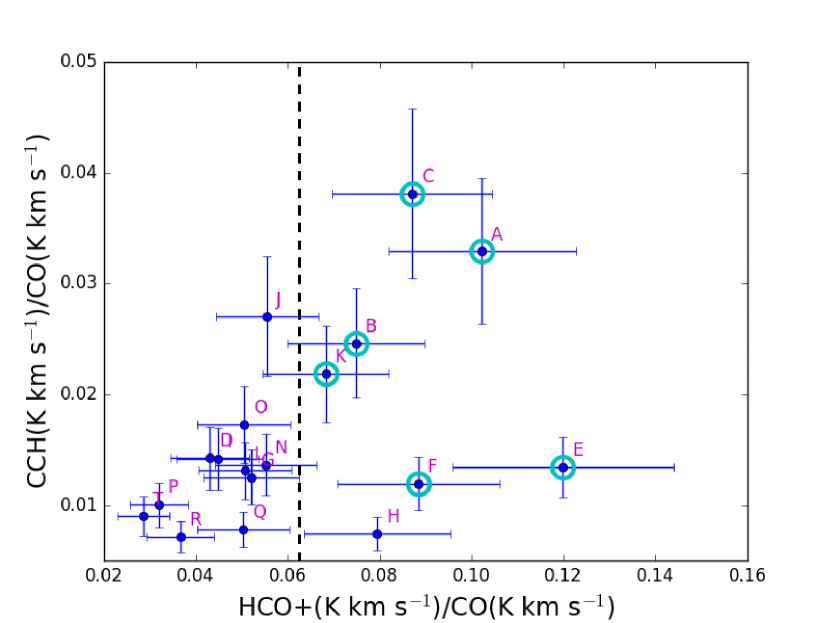
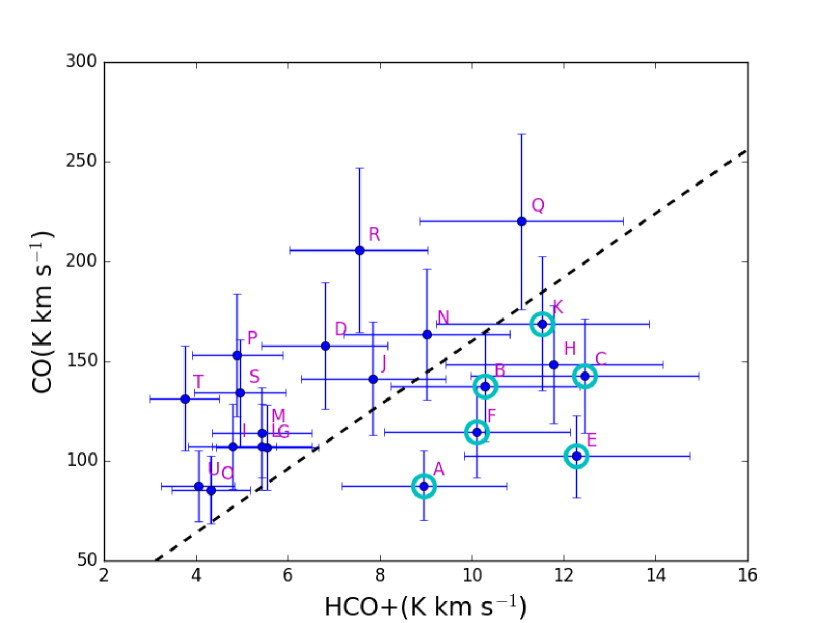
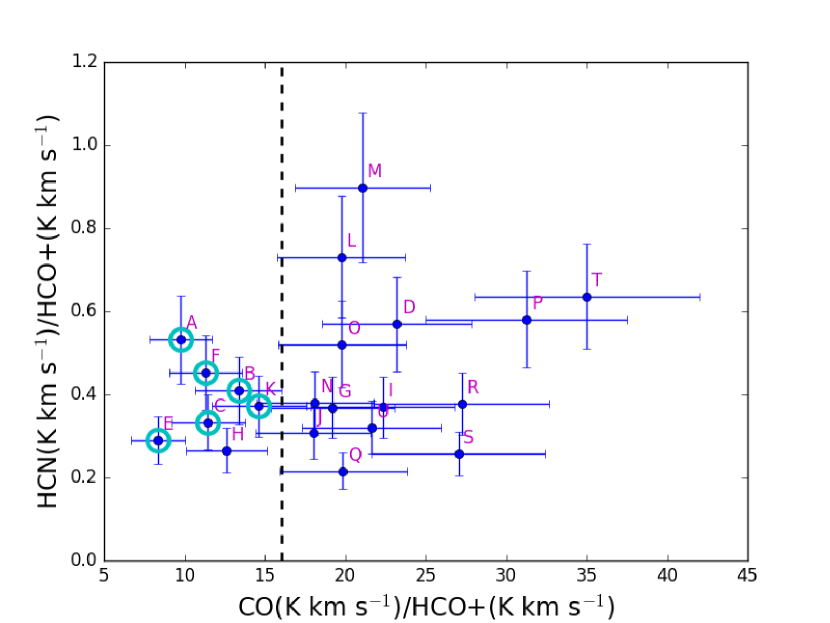
In Figures 11 and 12 we plot the results of the line ratios (in units of K km s-1) that result from the apertures labeled in Figure 6 that correspond to peaks in the integrated intensity map in one of the lines observed here. We also highlight (in cyan) the apertures that overlap with the observed thermal radio emission resulting from natal super star clusters.
A number of trends are apparent in these Figures 11 and 12, but perhaps most striking is the extent to which the line strengths and ratios associated with the natal super star clusters are clearly distinct. For example, with the exception of CO, the other line emission all tends to be stronger near the radio sources. The radio sources are particularly well separated in CO/HCO+ as shown in Figure 12. With the exception of region H, the line of CO(2-1)HCO+ cleanly separates the line emission from the radio and non-radio regions. The HCN/HCO+ ratio is always for all of the regions sampled, and for the radio sources, potentially indicating XDRs. On the other hand the HNC/HCN ratio is for all regions except J, with typical values of for the radio sources, indicating that these regions are not particularly cold but have T K (Schilke, et al., 1992).
3.5. Comparison Between Single Dish and Interferometric Observations
A comparison to single dish observations can be used to determine what fraction of the total flux we are recovering with these SMA observations. Integrating the CO(2-1) emission of these SMA data within a contour around the galaxy results in an integrated CO(2-1) intensity of Jy km s-1. (Meier, et al., 2001) present single dish observations of He 2-10 using the CO(3-2) transition with a total intensity K km s-1 ( Jy km s-1 for their beam size of ). Adopting the brightness temperature ratio of CO(3-2)/C(2-1) inferred by (Meier, et al., 2001) (equivalent to ), results in a total CO(2-1) intensity of 415 Jy km s-1. Thus, these SMA observations appear to recover % of the CO(2-1) flux from He 2-10.
We can also compare the total HCN(1-0) emission from the ALMA data to previous observations of Santangelo, et al. (2009) using the IRAM 30 m telescope, with a beam size of 28′′ for the target HCN(1-0) line, in which they report a single dish integrated flux of Jy km s-1. Using the same CO(2-1) contour as above, we measure a HCN(1-0) integrated flux of Jy km s-1, suggesting that these ALMA observations only recover % of the HCN(1-0) emission. We note that this fraction of recovered flux is similar to the value found with very similar ALMA observations by Kepley, et al. (2016) of 70% for the dwarf starburst galaxy IIZw40.
It is striking that the ALMA observations of He2-10 appear to recover a smaller fraction of the HCN(1-0) flux than of the CO(2-1) flux; in the absence of calibration issues, this result would suggest that the HCN emission is coming from more extended structures than the CO emission – clearly contrary to expectations. Instead, we offer two additional potential explanations: 1) The fraction of the CO flux that appears to be recovered by ALMA is inflated. If we instead assume that the CO(3-2) is fully thermalized, and the CO(3-2)/CO(2-1), the recovered fraction of CO is partially mitigated (bringing the recovered fraction down to 80%). 2) The single-dish flux calibration is too low. Given the difficulty in calibrating single-dish observations, it is not out of the question that this uncertainty could be off by as much as %. Either or both of these explanations could be contributing to the apparent discrepancy between the total recovered flux of CO and HCN.
3.6. The Gas and Dust Mass
3.6.1 88 GHz Continuum
As shown in Figure 2, the 88 GHz continuum emission is strongly detected throughout the main body of He 2-10, with an integrated flux density of mJy. The strongest peaks are co-spatial with known thermal radio sources (indicating natal super star clusters).
The 88 GHz continuum is likely to be a combination of both dust and free-free emission. Based on the radio observations of Johnson & Kobulnicky (2003), we can extrapolate the free-free contribution to 88 GHz assuming a standard spectral index of . We find that % of the 88 GHz emission from the compact regions surrounding the thermal radio sources is due to dust emission. If the more diffuse emission throughout the galaxy has a similar contribution from free-free emission, that suggests that the 88 GHz emission due to dust is mJy. If the more diffuse component has a minimal contribution from free-free emission, then the total dust emission at 88 GHz due to dust is mJy. These values are not inconsistent with the Santangelo, et al. (2009) observations at 230 GHz, in which the mm continuum was not detected, and they derived a peak upper limit of mJy. Extrapolating this upper limit assuming a dust spectral energy distribution suggests the dust contribution at 88 GHz is either small and/or the dust emission is extended.
Adopting a dust contribution to the 88 GHz flux density of 4.2-6.5 mJy, the total dust continuum flux density can be used to calculate the total gas mass following (Launhardt & Henning, 1997, but adopting a ):
| (2) |
where,
| (3) |
We assume the emission is optically thin isothermal emission, and a temperature of 25 K. Assuming that the dust opacity at 230 Ghz is cm2 g-1 (per gram of gas), and that implies that cm2 g-1 (Andre, Ward-Thompson, & Barsony, 2000). The resulting gas mass is M⊙. This value is broadly consistent with that inferred by Kobulnicky, et al. (1995) of M⊙ based on CO(1-0) observations. The stellar mass of He 2-10 was inferred to be M⊙ by Nguyen, et al. (2014) based on the surface brightness profile, which is the dynamical mass of found by Kobulnicky, et al. (1995). These differences could be attributable to the mass being measured out to different radii; Nguyen, et al. (2014) measure the mass within kpc, while the measurement of Kobulnicky, et al. (1995) Kobulnicky is within kpc. These results suggest that roughly 5-20% of the dynamical mass of He 2-10 is due to the gaseous component, depending on whether one adopts the results of Kobulnicky, et al. (1995) or Nguyen, et al. (2014). This value might be regarded as a lower limit given the potential for flux to be resolved out in these interferometric observations, however, as discussed in Section 3.5, these observations appear to recover % of the CO emission compared to single-dish measurements. On the other hand, contamination from free-free emission at 88 GHz would cause the inferred gas mass to be an overestimate. Future continuum observations at higher frequency should help resolve this issue.
4. Discussion
4.1. Molecular Line Ratios as an Indicator of Cluster Evolution
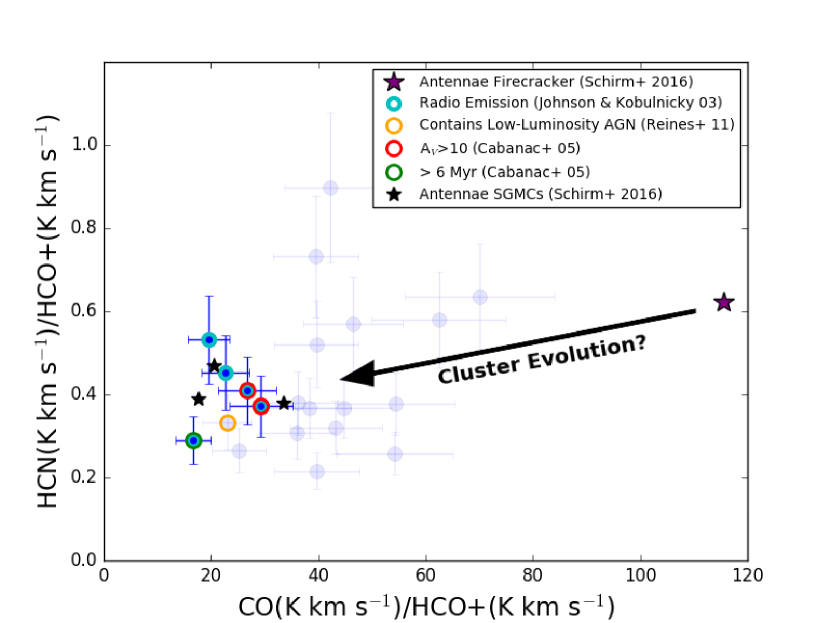
Given that regions around the thermal radio sources have clearly distinct line ratios (as shown in Figures 11 and 12), we further investigate the evolutionary state of the natal clusters associated with these regions. Figure 13 is similar to Figure 12b, but in order to facilitate comparison with other data sets we convert the CO(2-1) line strengths to CO(1-0) assuming CO(1-0)/CO(2-1). We also now include information about evolutionary states of specific sources, as well as the location of the “Firecracker” source in the Antennae galaxy system that was shown by Johnson, et al. (2015) to be a pre-stellar molecular cloud likely to form a super star cluster in the next Myr. Subsequent observations by Schirm, et al. (2016) measured the relevant line ratios for this region, as indicated in Figure 13, which place it at a high CO/HCO+ ratio and higher than average HCN/HCO+ ratio relative to the regions in He 2-10. We also show the line ratios for the entire super giant molecular clouds (SGMCs) in the Antennae, which are known to already host a large number of star clusters. Additionally we identify the two natal clusters known to have high optical extinction (A Cabanac, Vanzi, & Sauvage, 2005, suggesting a very young evolutionary state), and a cluster known to be relatively old, with an age Myr (Cabanac, Vanzi, & Sauvage, 2005).
Examining Figure 13 reveals an apparent trend in line ratios with cluster evolutionary state, with CO/HCO age-1. Although this trend could be inferred from only the He 2-10 data, it is even more apparent by including the “Firecracker” region in the Antennae. The dependance of the CO/HCO+ ratio might be understood in a few different ways: 1) The change in this ratio could reflect the density of the molecular gas. Given that the critical density of HCO+ is significantly larger than CO(2-1) (e.g. Shirley, 2015), this scenario could only work if the molecular gas becomes denser as a cluster evolves, which we find unlikely. 2) The HCO+ emission could be enhanced in the PDRs surrounding the young star clusters (e.g. Ginard et al., 2012). This behavior in HCO+ emission has been observed in a number of sources, and therefore we find this scenario to be plausible. 3) The CO could be subject to dissociation amid the strong radiation fields and mechanical luminosity of the young massive stars. This behavior is predicted by theory (e.g. Kazandjian, et al., 2015), and therefore we also find this scenario to be likely.
The ratio of HCN/HCO+ shows a hint of a trend inversely related to age, but this is less clear than the CO/HCO+ trend. If this apparent trend is real, it could be understood as either 1) the enhancement of HCO+ in the PDRs driving this ratio down, or 2) the density of the gas falling below the critical density of HCN as clusters evolve, but staying above the critical density of HCO+. Anderson, et al. (2014) found typical values of HCN/HCO+ of for parsec-scale molecular clumps not obviously associated with current star formation in the 30 Doradus region, which supports the apparent trend in this line ratio with evolutionary state presented here. The numerical PDR models of Meijerink, Spaans, & Israel (2007) suggest that the “typical” HCN/HCO+ ratios for the regions in He 2-10 of indicate densities of cm-3.
4.2. Comparison to Observations in Other Galaxies
In order to put these results in context, here we compare the molecular line ratios presented here to those that have been observed in other galaxies. In particular, the relatively nearby starburst galaxies NGC 253 and M82 provide important benchmarks; not only do they have high levels of star formation, but their proximity has enabled studies with relatively small synthesized beams which better facilitates comparison. The NCG 253 observations were presented by Meier, et al. (2015) and Leroy, et al. (2015) and cover the inner kpc of the galaxy, with synthesized beams of and , respectively (corresponding to pc and pc). The M82 observations of Kepley, et al. (2014) have a beam size of , corresponding to pc. The Antennae observations of Schirm, et al. (2016) have a resolution of , corresponding to pc, while the observations of Bigiel, et al. (2015) have a resolution of , corresponding to a pc.
Comparing these data sets is complicated by their different linear resolutions, but some trends are still apparent. For example, with the exception of the SGMCs in the Antennae, all of the other data points are in a different region of Figure 13. In particular, these regions from other galaxies appear to have systematically higher HCN/HCO+ ratios, and lower CO/HCO+ ratios. If the hypothesis presented in Section 4.1 and Figure 13 is correct, the location of the points from the comparison galaxies would suggest that they contain more evolved star forming regions than the natal clusters sampled in He 2-10. Given the location of these regions in the heart of major starbursts, it is not surprising that the molecular material has been significantly affected by the intense star formation. The decreasing CO/HCO+ ratio in these regions can be understood by the same mechanisms discussed in Section 4.1 – enhancement of HCO+ in PDRs, and photodissociation of CO. However, the apparent increase in the HCN/HCO+ ratio is more puzzling, and we do not at present have an explanation for this behavior. The models of Meijerink, Spaans, & Israel (2007) would suggest that the higher values of HCN/HCO+ correspond to higher densities, which is contrary to our expectation for the behavior of the surrounding molecular material as clusters evolve.
5. Summary
We present ALMA observations of the dwarf starburst galaxy He 2-10 that include the molecular lines of HCO+(1-0), HCN(1-0), HNC(1-0), and CCH(1-0) as well as 88 GHz continuum. These observations are combined with previous CO(2-1) observations obtained with the SMA in order to characterize the molecular emission of natal super star clusters. The main results of this work are the following:
Based on continuum measurements at 88 GHz, we infer a total gas mass of He 2-10 of M⊙, roughly 5-20% of the dynamical mass.
Of the molecular lines observed here, HCO+ most closely traces the thermal radio emission, suggesting that it is most strongly correlated with the natal super star clusters. From a principle component analysis, HCO+ is also the best “general” tracer of molecular emission in He 2-10.
The line widths and CO luminosities associated with the regions in He 2-10 suggest that the molecular clouds could have sizes as small as pc, or alternately the line widths are enhanced, potentially due to a high pressure environment.
The principle component analysis indicates that the CO emission and the 88 GHz continuum are anti-correlated, which suggests that either the dust and molecular gas components are not cospatial, or the 88 GHz continuum is dominated by free-free emission.
The CO and CCH emission are also anti-correlated, which is consistent with CCH being enhanced by the photo-dissociated of CO in the vicinity of the hot young stars in the natal clusters.
The molecular line ratios of regions containing the natal star clusters are distinct from the line ratios observed for regions elsewhere in the galaxy. In particular, the regions with thermal radio emission all have CO(2-1)/HCO.
Based on known properties of the natal super star clusters in He 2-10, the HCO+/CO ratio appears to be correlated with the evolutionary stage of the clusters. This trend could be due to increasing photo-enhancement of HCO+ as a clusters’ massive stars begin to fully impact their environment, and/or photodissociation of CO as the high energy radiation from the massive stars begins to permeate the surrounding regions.
We suggest that the line ratios in He 2-10, resolved on typical molecular cloud scales, might help provide insight into more distant unresolved systems containing embedded star formation.
References
- Anderson, et al. (2014) Anderson, C.N., Meier, D.S., Ott, J., Hughes, A., Wong, T., Henkel, C., Chen, R., Indebetouw, R., Looney, L., Muller, E., Pineda, J.L., Seale, J. 2014, ApJ, 793, 37
- Andre, Ward-Thompson, & Barsony (2000) Andre, P., Ward-Thompson, D., & Barsony, M. 2000, in Protostars and Planets IV, Mannings, V., Boss, A.P., and Russell, S. S., ed., University of Arizona Press, p. 59
- Bayet, et al. (2004) Bayet, E., Gerin, M., Phillips, T., & Contursi, A. 2004, A&A, 427, 45
- Beuther et al. (2008) Beuther, H., Semenov, D., Henning, T., & Linz, H. 2008, ApJ, 675, 33
- Bigiel, et al. (2015) Bigiel, F., Leroy, A.K., Blitz, L., Bolatto, A.D., da Cunha, E., Rosolowsky, E., Sandstrom, K., & Usero, A. 2016, ApJ, 815, 103
- Bolatto, Wolfire, & Leroy (2013) Bolatto, A.D., Wolfire, M., Leroy, A.K. 2013, ARAA, 51, 207
- Cabanac, Vanzi, & Sauvage (2005) Cabanac, R.A., Vanzi, L., & Sauvage, M. 2005, ApJ, 631, 252
- Darling, Brogan, & Johnson (2008) Darling, J., Brogan, C., & Johnson, K. 2008, ApJ, 685, 39
- Fall & Zhang (2001) Fall, S.M. & Zhang, Q. 2001, ApJ, 561, 751
- García-Burillo et al. (2000) García-Burillo, S., Martín-Pintado, J., Fuente, A., & Neri, R. 2000, A&A, 355, 499
- Ginard et al. (2012) Ginard, D., Gonzalez-Garcia, M., Fuente, A., Cernicharo, J., Alonso-Albi, T., Pilleri, P., Gerin, M., Garcia-Burillo, S., Ossenkopf, V., Rizzo, J.R., Kramer, C., Goicoechea, J.R., Pety, J., Berne, O., Joblin, C. 2012, A&A, 543, 27
- Graninger, et al. (2014) Graninger, D.M., Herbst, E., Oberg, K.I., & Vasyunin, A. 2014, ApJ, 787, 74
- Guseva, Izotov, & Thuan (2000) Guseva, N.G., Izotov, Y.I., & Thuan, T.X. 2000, ApJ, 531, 776
- Harris (2003) Harris, W.E. 2003, p 78, in: A Decade of Hubble Space Telescope Science, STScI Symp. Series, Vol. 14, Cambridge University Press
- Heckman (2001) Heckman, T.M. 2001, in: Gas and Galaxy Evolution, ASP Conference Proceedings, Vol. 240, p. 345
- Heyer, et al. (2009) Heyer, M., Krawczyk, C., Duval, J., Jackson, J.M. 2009, ApJ, 699, 1092
- Imanishi, et al. (2007) Imanishi, M., Nakanishi, K., Tamura, Y., Oi, N., & Kohno, K. 2007, AJ, 134, 2366
- Kobulnicky & Johnson (1999) Kobulnicky, H.A. & Johnson, K.E. 1999, ApJ, 527, 154
- Johnson, et al. (2000) Johnson, K.E., Leitherer, C., Vacca, W.D., & Conti, P.S. 2000, AJ, 120, 1273
- Johnson & Kobulnicky (2003) Johnson, K.E. & Kobulnicky, H.A. 2003, ApJ, 597, 923
- Johnson, et al. (2015) Johnson, K.E., Leroy, A.K., Indebetouw, R.I., Brogan, C.L., Whitmore, B.C., Hibbard, J., Sheth, K., & Evans, A.S. 2015, ApJ, 806, 35
- Kazandjian, et al. (2015) Kazandjian, M.V., Meijerink, R., Isreal, F.P., & Spaans, M. 2015, A&A 574, 127
- Kepley, et al. (2014) Kepley, A.A., Leroy, A.K., Frayer, D., Usero, A., Marvil, J., Walter, F. 2013, ApJL, 780, 13
- Kepley, et al. (2016) Kepley, A.A., Leroy, A.K., Johnson, K.E., Sandstrom, K., & Chen, C.-H. 2016, ApJ, 828, 50
- Kobulnicky, et al. (1995) Kobulnicky, H.A., Dickey, J.M., Sargent, A.I., Hogg, D.E., & Conti, P.S. 1995, AJ, 110, 116
- Kobulnicky & Johnson (1999) Kobulnicky, H.K. & Johnson, K.E. 1999, ApJ, 527, 154
- Kobulnicky, Kennicutt, & Pizagno (1999) Kobulnicky, H.A., Kennicutt, R.C., & Pizagno, J.L., ApJ, 514, 544
- Launhardt & Henning (1997) Launhardt, R. & Henning, Th. 1997, A&A, 326, 329
- Lee, et al. (2009) Lee, J.C. et al. 2009, ApJ, 706, 599
- Leroy, et al. (2015) Leroy, A.K., Bolatto, A.D., Ostriker, E.C., Rosolowsky, E., Walter, F., Warren, S.R., Donovan Meyer, J., Hodge, J., Meier, D.S., Ott, J., Sandstrom, K., Schruba, A., Veilleux, S., & Zwaan, M. 2015, ApJ, 801, 25
- Martin, Kobulnicky, & Heckman (2002) Martin, C.L., Kobulnicky, H.A., & Heckman, T.M. 2002, ApJ, 574, 663
- Mártin, et al. (2014) Mártin, S., Verdes-Montenegro, L., Aladro, R., Espada, D., Argudo-Fernández, M., & Scott, T.C. 2014, A&A, 563, 6
- Meier, et al. (2001) Meier, D.S., Turner, J.L., Crosthwaite, L.P., & Beck, S.C. 2001, AJ, 121, 740
- Meier & Turner (2005) Meier, D.S. & Turner, J.L. 2005, ApJ, 618, 259
- Meier, et al. (2015) Meier, D.S., Walter, F., Bolatto, A.D., Leroy, A.K., Ott, J., Rosolowsky, E., Veilleux, S., Warren, S.R., Weiss, A., Zwaan, M.A., & Zschaechner, L.K. 2015, ApJ, 801, 63
- Meijerink, Spaans, & Israel (2007) Meijerink, R., Spaans, M., & Israel, F.P. 2007, A&A, 461, 793
- Nguyen, et al. (2014) Nguyen, D.D., Seth, A.C., Reines, A.E., den Brok, M., Sand, D., McLeod, B 2014, ApJ, 794, 34
- Reines, et al. (2011) Reines, A.E, Sivakoff, G.R., Johnson, K.E., & Brogan, C.L. 2011, Nature, 470, 66
- Reines, et al. (2016) Reines, A.E., Reynolds, M.T., Miller, J.M., Sivakoff, G.R., Greene, J.E., Hickox, R.C., & Johnson, K.E. 2016, ApJ, 830, 35
- Santangelo, et al. (2009) Santangelo, G., Testi, L., Gregorini, L., Leurini, S., Vanzi, L., Walmsley, C.M., Wilner, D.J. 2009, A& A, 501, 495-503
- Schilke, et al. (1992) Schilke, P., Walmsley, C.M., Pineau Des Forets, G., Roueff, E., Flower, D.R., & Guilloteau, S. 1992, A&A, 256, 595
- Schirm, et al. (2016) Schirm, M.R.P., Wilson, C.D., Madden, S.C., & Clements, D.L. 2016, ApJ, 823, 87
- Shirley (2015) Shirley, Y.L. 2015, PASP, 127, 299
- Talbi, Ellinger, & Herbst (1996) Talbi, D., Ellinger, Y., & Herbst, E. 1996, A&A, 314, 688
- Turk et al. (2011) Turk, M.J., Smith, B.D., Oishi, J.S., Skory, S., Skillman, S.W., Abel, T., Norman, M.L. 2011, ApJS, 192, 9
- Turner, Beck, & Ho (2000) Turner, J.K., Beck, S.C., & Ho, P.T.P. 2000, ApJ, 532, 109
- Vacca, Johnson, & Conti (2002) Vacca, W.D., Johnson, K.E., Conti, P.S. 2002, AJ, 123, 772
- Vanzi et al. (2009) Vanzi, L., Combes, F., Rubio, M, Kunth, D 2009, A& A, 496, 677