Analysis of Magnetic Field Variations Produced by Equatorial Electro-Jets.
Abstract
The Equatorial Electrojet (EEJ) is a narrow band of electrons flowing from east to west at daytime at low latitudes. The electron current produces a magnetic field variation that can be measured at different latitudes. In this work, we have used the data analysis in order to quantify the solar and lunar contributions to those variations and study the morphology of the EEJ current.
keywords:
Equatorial Electrojet, magnetic field, data analysis.1 Introduction
Observations of the magnetic field at Huancayo in 1922 showed the existence of Equatorial Electrojet (EEJ), which is a narrow band of electrons traveling from east to west, 180 km above the surface of the Earth ([Chapman (1951), Chapman, 1951]). Wind-driven currents, through the dynamo mechanism, produce an accumulation of positive charges at sunrise and negative at sunset ([Huang (2005), Huang, 2005]), which results in considerable variations of the geomagnetic field. The variations of the magnetic field are no constant, instead, they depend on solar activity, geographical location and vary temporally with season ([Rigoti(1999), Rigoti, 1999]).
2 Data Set
Ground magnetometers allow a deeper understanding of the terrestrial ionosphere. The Quito Astronomical Observatory, in collaboration with the University of Kyushu, has installed a Magnetic Acquisition System (MAGDAS) in Jerusalem, located 35 km northward from Quito, Ecuador. The magnetometer location has geographic coordinates GLAT: 0°0’ 8.67” S, GLON: 78°21’24.87” W ([Lopez (2014), López, 2014]), and it is operative from October 2012 until now.
We have used the horizontal component of the magnetic field (H) recorded by the Ecuadorian MAGDAS magnetometer in combination with the data downloaded for free from the project: A Global Ground-Based Magnetometer Initiative, available at web page
(http://supermag.jhuapl.edu/mag/?), during the period since October 2012 to December 2016. The geographic and geomagnetic locations of the stations used in this work are indicated in the Table 1.
| Station | Acronym | GLON | GLAT | MLON | MLAT |
|---|---|---|---|---|---|
| Vulcan | T03 | 247.02 | 50.37 | -50.40 | 57.60 |
| Boulder | BOU | 254.77 | 40.13 | -38.68 | 48.51 |
| Fredericksburg | FRD | 282.63 | 38.20 | -0.64 | 48.05 |
| Fresno | FRN | 240.30 | 37.10 | -54.87 | 42.65 |
| Bay Sait Louis | BSL | 270.37 | 30.35 | -17.88 | 40.69 |
| Tucson | TUC | 249.27 | 32.17 | -43.96 | 39.32 |
| San Antonio | M08 | 261.39 | 29.44 | -29.35 | 38.74 |
| San Juan | SJG | 293.85 | 18.11 | 11.85 | 26.75 |
| Jerusalem | JRS | 282.64 | -0.0024 | -5.9800 | 9.67 |
| Kourou | KOU | 307.27 | 5.21 | 24.46 | 8.62 |
| Huancayo | HUA | 284.67 | -12.05 | -2.75 | 1.17 |
| Villa Remedios | VRE | 292.38 | -17.28 | 3.97 | -4.53 |
| Pilar | PIL | 294.47 | -31.40 | 4.76 | -18.39 |
| Osorno | OSO | 286.91 | -40.34 | -0.03 | -26.48 |
| Punta Arenas | PAC | 289.91 | -40.34 | 1.97 | -26.64 |
| Port Stanley | PST | 302.11 | -51.70 | -38.96 | -38.96 |
3 Data Analysis
The magnetic field measurements provided by the ground stations is the sum of multiple contributions, among the more significant are: the Earth main magnetic field, the secular current (), the field aligned currents and so on. In order to study the cyclic variations, we have removed the non-periodic variations by correction of the disturbance field () described by [Yamazaki(2017), Yamazaki (2017)]. The zero level of secular variations () has been obtained using the hourly index which provides a quantitative measure of geomagnetic disturbance, that can be correlated with other solar and geophysical parameters. For an station with a geomagnetic latitude , the disturbance field over H can be related by the expression [Takeda, 2002, Takeda, 2002].
Fourier Series Analysis. Given the periodicity of the secular variations of the terrestrial magnetic field, it is possible to expand it in Fourier series, it means to express as an infinite sum of sines and cosines. In general, in order to capture the solar variability, it is enough if we use the first four solar harmonics (i.e., 24, 12, 8 and 6 hours).
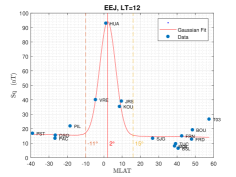
The mean values of average secular variations () as function of magnetic latitude (MLAT) are plotted in the Figure 1, where we can see that the EEJ current band is symmetric, centered at MLAT and with full-width at half-maximum of .
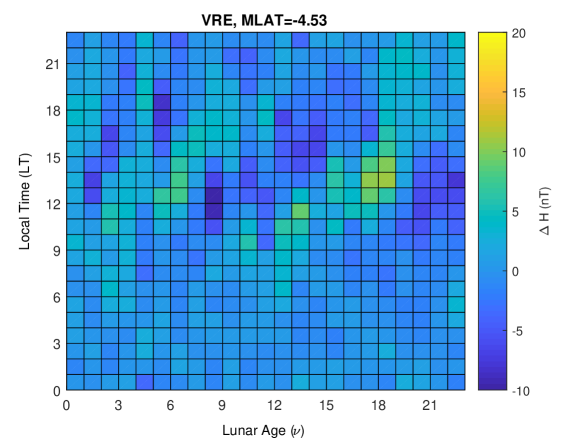
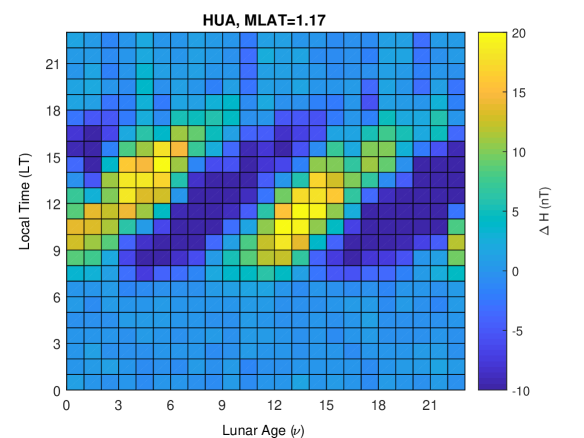
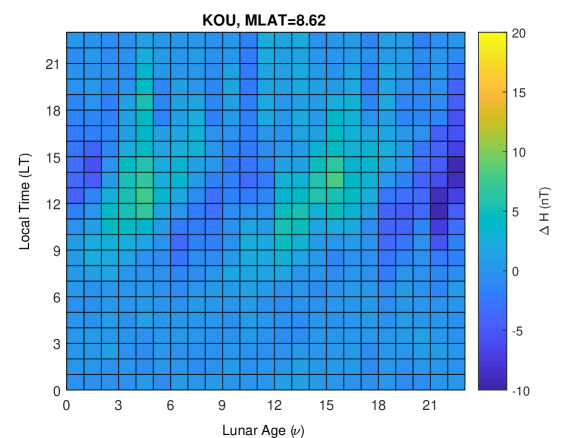
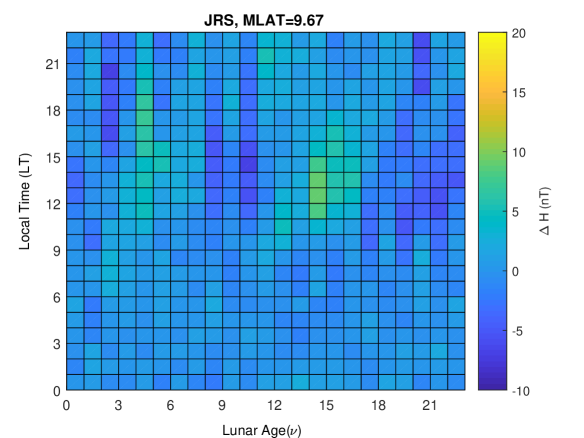
Lunar Contributions to Magnetic Field Variations. We define the lunar age by analogy with the solar day. A lunar cycle ( solar days) has a duration of 24 lunar hours. This means that lunar hours represents the new moon and lunar hours represents the full moon. The Moon has a significant contribution during EEJ production, in order to quantify the lunar contribution we have subtracted the first harmonic calculated through the Fourier series expansion from the original data. The residual can be considered as the contribution of the Moon to the variation of the horizontal magnetic field. Then, the residuals are grouped by lunar age and local time (LT) as we show in the Figure 2.
|
|
|
|
|
|
4 Conclusions
From the Gaussian fit of the secular variations of the horizontal magnetic field component as a function of the geomagnetic latitude, we are able to derive that the full-width at half-maximum for average EEJ on America’s equatorial region is . The mean EEJ current during the years 2012 - 2016 extends from to magnetic latitudes and it is centered at .
We found a dependence on the lunar age and the day time in the electrojet generation. Our results are similar to those presented by Yamazaki ([Yamazaki(2017), Yamazaki 2017]), but derived by another method. Although, the Moon contribution is important in the EEJ formation, its contribution to the magnetic field is, in average, five times less important than the Sun contribution.
References
- [Chapman (1951)] Chapman, S., 1951, Arc. Metereol. Geophyis. Res., 4, 369-390
- [Huang (2005)] Huang, C.-M.& Richmond A.D. 1995, J. Geophys. Res., 110, A05312
- [Gjerloev (2012)] Gjerloev, J. W. 2012, J. Geophys. Res., 117, A09213
- [Lopez (2014)] López, E, Maeda, G, et. al. 2014, Sun and Geosphere, 9, 31-34
- [Rigoti(1999)] Rigoti, A., Chamalaun, N.B. & Padilha, A. L., 1999, Earth Planets Space, 51,115-128
- [Takeda, 2002] Takeda, M., 2002, J. Atmos. Sol. , Terr. Phys. 64, 1617-1621
- [Yamazaki(2017)] Yamazaki, Y., Maute, A. 2017, Space Sci. Rev., 2017, 206-299