Efficient Machine-type Communication using Multi-metric Context-awareness for Cars used as Mobile Sensors in Upcoming 5G Networks
Abstract
Upcoming 5G-based communication networks will be confronted with huge increases in the amount of transmitted sensor data related to massive deployments of static and mobile Internet of Things (IoT) systems. Cars acting as mobile sensors will become important data sources for cloud-based applications like predictive maintenance and dynamic traffic forecast. Due to the limitation of available communication resources, it is expected that the grows in Machine-Type Communication (MTC) will cause severe interference with Human-to-human (H2H) communication. Consequently, more efficient transmission methods are highly required. In this paper, we present a probabilistic scheme for efficient transmission of vehicular sensor data which leverages favorable channel conditions and avoids transmissions when they are expected to be highly resource-consuming. Multiple variants of the proposed scheme are evaluated in comprehensive real-world experiments. Through machine learning based combination of multiple context metrics, the proposed scheme is able to achieve up to 164% higher average data rate values for sensor applications with soft deadline requirements compared to regular periodic transmission.
I Introduction
The deployment of autonomous cars will act as a catalyst for data-driven sensor systems. Crowdsensing-based applications such as road-roughness detection and distributed weather-forecasting will achieve significant gains in the availability and up-to-dateness of sensor data with the help of cars acting as mobile sensor nodes. Those kinds of applications do not have real-time requirements for the data, but soft deadlines, where too old data is discarded. Consequently, upcoming 5G networks will require mechanisms for dealing with a high increase in the amount of transmitted MTC-data. In addition to reliable data transfer, highly efficient data transmissions mechanisms are required to keep the interference with H2H communication as low as possible. In earlier work, we have proposed the opportunistic transmission scheme Channel-aware Transmission (CAT) [1] for Long Term Evolution (LTE) cellular networks, which has been extended with a predictive component to consider future channel conditions with predictive CAT (pCAT) in [2]. Its general idea is to store sensor data locally as long as the channel quality is low in order to avoid packet loss and retransmissions. The buffered data is sent to a cloud-server when the device is experiencing a connectivity hotspot with very high channel quality. The actual transmissions are triggered depending on a passive downlink channel quality indicator. In this paper, we generalize the principles and extend CAT with a generalized multi-metric model for context-aware MTC in vehicular environments. The paper is structured as follows. After presenting relevant state-of-the-art work in this area, we present the analytical model of the proposed probabilistic transmission scheme and discuss methods for combining multiple transmission metrics based on generic approaches and means of machine learning. Afterwards, the setup of the experimental evaluation study is introduced and finally the results are presented. In order to guarantee a high level of reproducibility, we provide the developed measurement software in an Open Source way as well as the raw data obtained from our measurements.
II Related Work
Due to a constantly increasing amount of mobile traffic, anticipatory and opportunistic data transmission approaches gain greater attraction, especially for MTC. Therefore, researchers have started to excessively analyze the performance of real-life mobile networks to derive metrics and methods for the optimization of versatile mobile applications or the network itself at different system levels [3].
While many works address the optimization of the infrastructure side, e.g., optimizing the radio-resource scheduler by forecasting the User Equipment (UE) traffic [4, 5] and mobility [6, 7], numerous approaches focus on the UE side as the main trigger of transmissions in a cellular network: With knowledge of the UE trajectory, centralized approaches like [8] incrementally generate maps of the link-quality at corresponding locations. Such measurements, in conjunction with online-learning algorithms, may be used to derive coverage maps of a cellular network [9] and finally schedule transmissions according to the current connectivity. Other researches propose decentralized approaches with the focus on QoS and QoE for continuous or buffered transmissions, e.g., video streaming [10, 11]. Here, the throughput-measurements of recent transmissions feed an adaption logic in the client to request a dynamically-scaled quality of the content according to the current link capacity.
For short transmissions, e.g. MTC, passive metrics become more important since active probing is impractical in these cases [12]. An empirical comparison of passive downlink indicators like Received Signal-Strength Indicator (RSSI) and Signal-to-Noise-Ratio (SNR) on the throughput in different environments is addressed in [13]. In [14] the authors analyze and identify the suitability of indicators like Reference Signal Received Power (RSRP) and Reference Signal Received Quality (RSRQ) for estimations of the uplink connectivity at different cell loads.
III Solution Approach
Regular transmission schemes for sensor data are mostly periodic and do not consider the current channel quality situation for timing the data transfer. Consequently, many transmissions are performed with a low transmission efficiency, require retransmissions and consume a lot of energy. Moreover, channel capacity is occupied for a long time period and is not available for other cell participants. It can be concluded, that the determination of favorable transmission times can have a significant impact on the overall system efficiency. Consequently, connection hotspots should be exploited whereas transmissions during connectivity valleys should be avoided. In the following, we first present the analytical model of the proposed probabilistic transmission scheme. Afterwards different methods for combining the available indicators in order to achieve a better measurement for the actual channel quality are discussed.
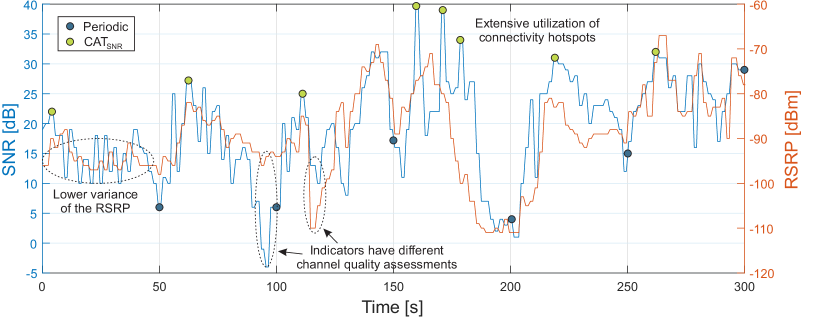
An example trace is shown in Fig. 1. While the periodic transmission approach sends data regardless of the current channel conditions, the proposed CAT scheme avoids transmissions at bad channel conditions and sends data with a higher frequency if the channel quality is high.
III-A Analytical Model of the Transmission Scheme
The generalized model for CAT is shown in Eq. 4. Each seconds, it computes the transmission probability for an abstract metric which is specified by a minimum value and a maximum value . is called conducive if the channel quality gets better with higher values of and harmful if it gets worse. Transmissions are not performed if the time difference since the last transmission is below a minimum value and performed regardless of the current metric value if exceeds a defined maximum value . The timeouts are used to specify the application requirements in terms of packet size and deadline requirements. If is in between those timeouts, a transmission probability is computed depending on the current metric value with the helper function and Eq. 7.
| (4) |
| (7) |
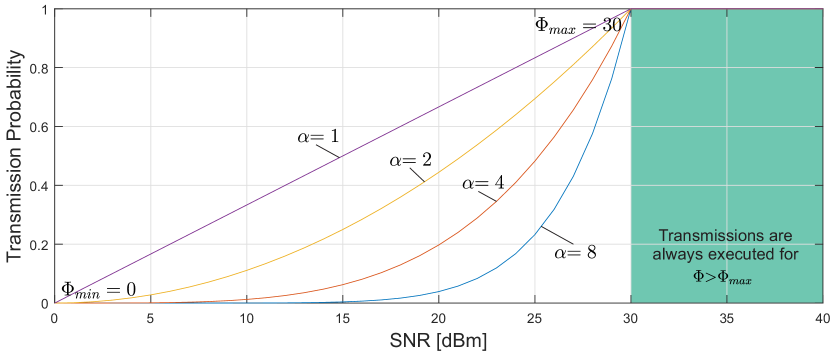
The metric is further characterized using a weighting exponent that controls the convergence speed of towards and specifies the impact of metric differences for the channel quality. Fig. 2 shows the analytical transmission probability with respect to the current metric value for different exponent values.
III-B Multi-metric Transmission
Cellular communication networks provide a wide range of different network quality indicators that can be used on the client side in order to evaluate the actual channel quality. In the following, different generic and machine-learning based approaches for combining the different indicators are described.
III-B1 Optimistic
The transmission probability is computed for all considered metrics. As the resulting transmission probability, the maximum value is chosen (Eq. 8) in order to leverage connectivity hotspots.
| (8) |
III-B2 Pessimistic
The minimum value of all considered metric is used as the transmission probability. This approach focuses on avoiding transmissions during connectivity valleys.
| (9) |
III-B3 Weighted Mean
If knowledge about the impact of the individual metrics on the overall performance is available, it can be used to strengthen or weaken their weight.
| (10) |
III-B4 Machine Learning based Datarate Prediction
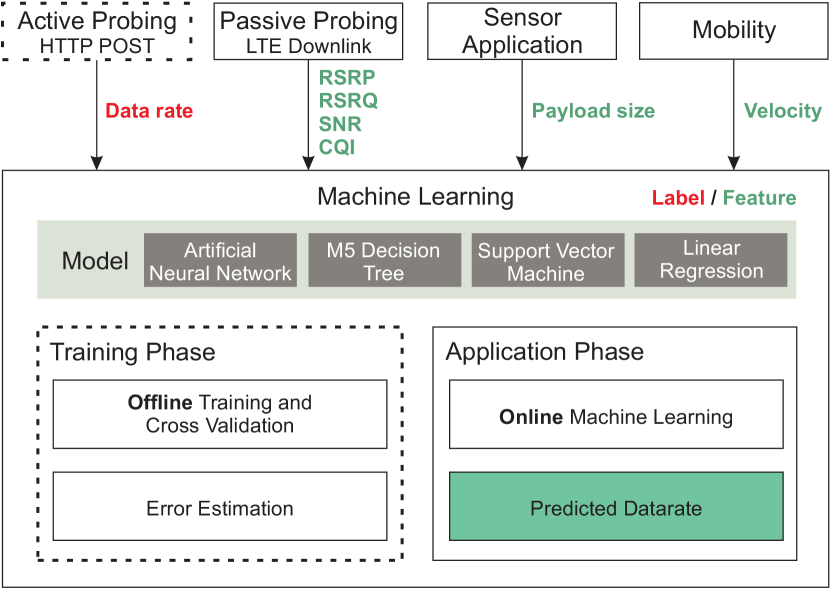
With this approach, the anticipated data rate is computed and used as the decision metric for the transmission scheme. The processing pipeline for the machine learning process is illustrated in Fig. 3. The available context parameters are used as the features and different learning models ( Artificial Neural Network (ANN), M5 Decision Tree (M5T), Support Vector Machine (SVM), Linear Regression (LR)) are applied (cf. Tab. IV for the performance comparison). During the training phase, the measured effective data rate forms the label for the learning process. In contrast to the other multi-metric approaches, also the payload size of the current data packet is integrated into the transmission decision.
IV Methodology
In this section, we present the setup for our empirical study. The default parameters are denoted in Tab. I.
| Parameter | Value |
|---|---|
| Sensor frequency | 1 Hz |
| Sensor payload size | 50 kByte |
| Transmission interval (periodic) | 30 s |
| 1 s | |
| 120 s |
A virtual sensor application is generating data packets according to specified sensor frequency and packet size values. The packets are buffered until a transmission decision is made for the whole buffer and the data has been transmitted successfully. For the performance evaluation, a periodic scheme that uses is used as the transmission interval is used as a reference for the probabilistic model.
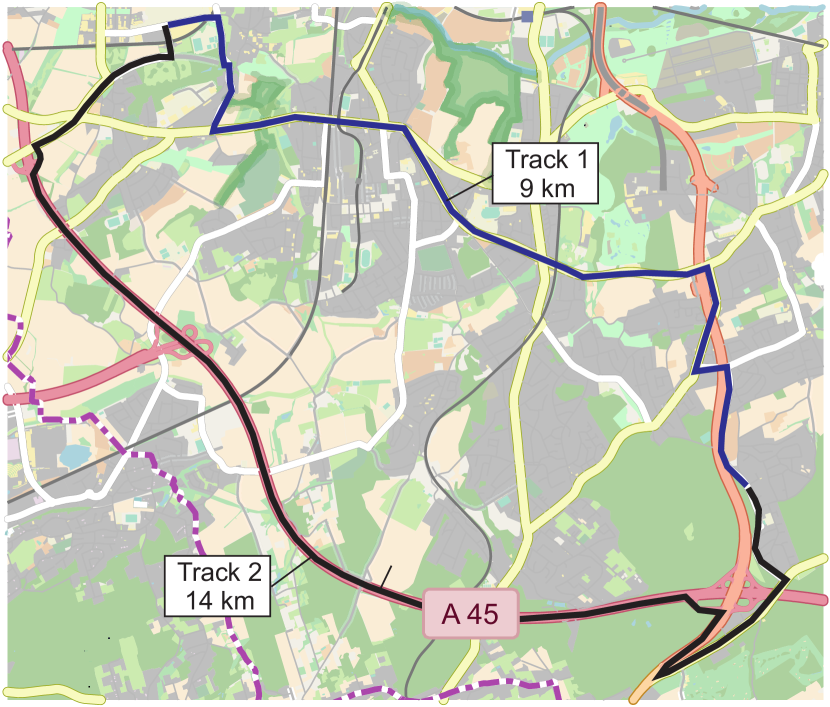
Fig. 4 shows a map of the evaluation scenario and consists of two connected tracks with different characteristics. Track 1 is set up in a typical suburban area with speed limitations ranging from 30 km/h to 70 km/h. Track 2 is mostly highway with a speed limitation of 130 km/h. For most of the following evaluations, data is aggregated from both tracks and separate discussions of the tracks are performed when considered beneficial. For each parametrization of the transmission scheme, 5 runs were performed on each of the tracks. Overall, more than 4000 transmissions were performed on a total distance of more than 1000 km. The measurements were performed in a public LTE network. For the collection of network quality data as well as mobility information, we developed an Android-based measuring app featuring live visualization that is available as Open Source 111Available at https://github.com/BenSliwa/MTCApp . The measurements were performed with a Samsung Galaxy S5 Neo (Model SM-G903F). The raw data of the measurements is provided at [15] as Open Access data.
| min | -120 dBm | -11 dB | 0 dB | 2 | 0 MBit/s |
| max | -80 dBm | -4 dB | 30 dB | 16 | MBit/s |
| 8 | 6 | 8 | 6 | 8 | |
| conducive | true | true | true | true | true |
Tab. II contains the parametrization for the considered metrics. For and , the exponent is chosen lower as the value range is smaller.
V Results
In this work, the evaluation is focused on the application layer throughput (referred to as the goodput) as a measurement for the transmission efficiency and the age of the sensor data. As discussed in [1], higher throughput values significantly reduce the interference with other cell user as well as the overall energy consumption of the mobile device.
V-A Single Metric Transmission Schemes
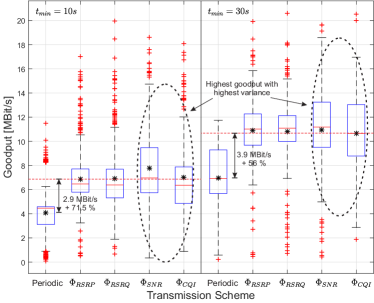
The end-to-end goodput for the considered metrics is shown in Fig. 5. All CAT-based metrics achieve significantly higher goodput values than the periodic scheme. While the highest gain is achieved for the SNR-based metric, it also shows the highest variance. In many cases the reported SNR changes significantly while the transmission is still being performed.
| Deadline | Periodic | |||||
|---|---|---|---|---|---|---|
| 10 s | 0.012 | 0.119 | 0.099 | 0.281 | 0.279 | |
| 30 s | 0.034 | 0.285 | 0.263 | 0.464 | 0.48 | |
| 10 s | 0.001 | 0.046 | 0.029 | 0.139 | 0.186 | |
| 30 s | 0.015 | 0.109 | 0.082 | 0.257 | 0.44 | |
| 10 s | 0 | 0.01 | 0 | 0.017 | 0 | |
| 30 s | 0 | 0.021 | 0.012 | 0.014 | 0 | |
| 10 s | 0 | 0 | 0 | 0.004 | 0 | |
| 30 s | 0 | 0 | 0 | 0 | 0 |
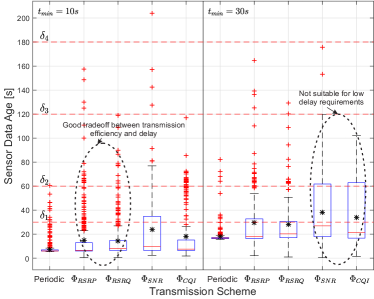
Since the selection of a transmission scheme is bound to the requirements of the actual application, the resulting Deadline Miss Ratio (DMR) values for three different generic applications are compared in Tab. III. The deadlines were chosen with respect to realistic requirements of traffic management systems as discussed in [16]. If the application does not have strict deadline requirements, a higher value should be selected in order to increase the minimal packet size and achieve a better ratio of payload size and protocol overhead.
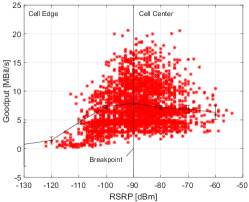
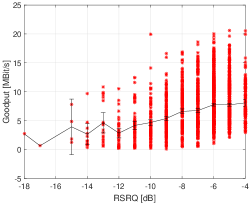
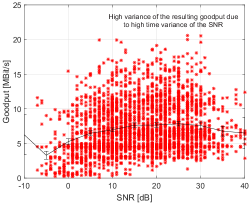
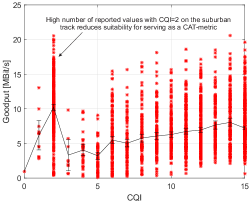
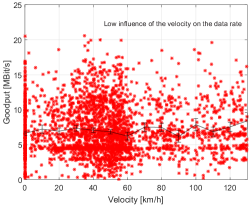
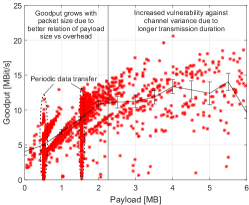
The correlation between the considered metrics and the achieved goodput is shown in Fig. 6 for the acquired data from Sec. V-A. The RSRP is strongly correlated with the resulting data rate if the device is in the cell edge region. A breakpoint of the curve can be identified at -90 dBm that separates cell edge behavior from cell center behavior. After the breakpoint, its meaningfulness is reduced to the increased interference with other communicating devices. Since the plots only consider the value of the Key Performance Indicator (KPI) for the beginning of the transmissions, its meaningfulness is reduced for longer transmission durations. This is even more dramatic if the KPI itself has a high variance, as it is the case for the SNR. The packet size has a high impact on the resulting data rate as it controls the relation of payload and protocol overhead. Two areas with different characteristics can be identified. Up to approximately 2.25 MB, the protocol overhead has a dominant influence and the goodput improves with higher packet sizes. For bigger packets, the variance of the data rate is highly increased, as the longer transmission duration increases dependency to the channel variance. In the plot, both periodic transmission schemes () can be clearly identified, as they do not alter the payload size of the packets. As a result of the correlation considerations, no single metric is able to provide a robust measurement for the channel quality in all considered situations.
V-B Machine Learning Based Datarate Prediction
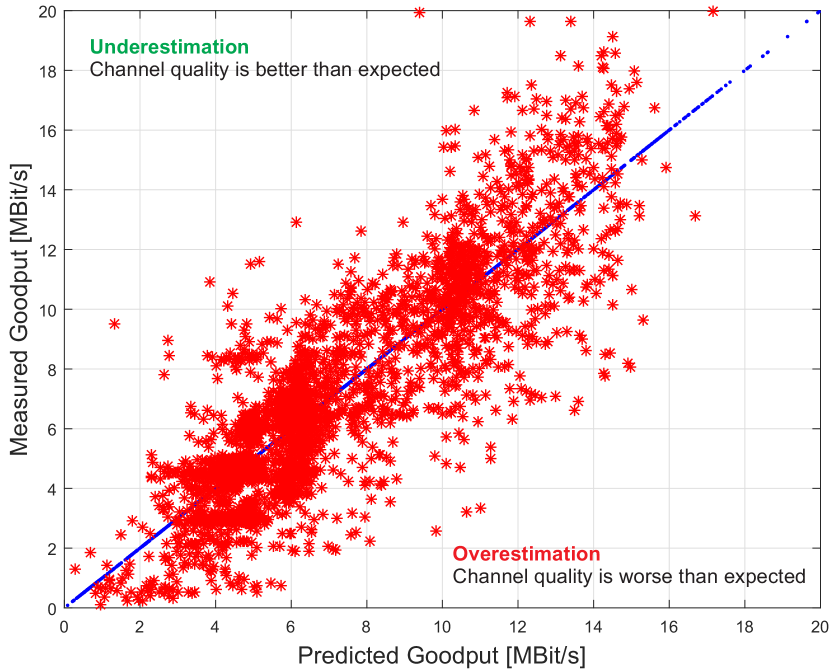
Prediction of the datarate is a regression task. Thus, we train multiple regression methods and validate their performance in 10-fold cross validation. During the training phase, the transmission time and the payload size of the Hypertext Transfer Protocol (HTTP) POST transmissions is monitored and the passive quality indicators are recorded. The models we compare are Artificial Neural Networks, Support Vector Machine (using Polynomial Kernel), M5 decision tree and a simple linear regression. The performance of the models is measured using the test data fold in terms of correlation, mean absolute error and root mean squared error. Results can be found in Table IV. The highest prediction accuracy is achieved for M5T which is the only machine learning model which is considered for further evaluations. The performance of the prediction model is visualized in Fig. 7 where measured data rate and its predicted value are compared. For the proposed transmission scheme, only the overestimation of the channel quality is considered harmful as only a worst-case estimation is required and underestimation will most likely even increase the resulting data rate.
| Model | Correlation | MAE | RMSE |
|---|---|---|---|
| ANN | 0.83 | 1.62 | 2.07 |
| SVM | 0.80 | 1.61 | 2.13 |
| M5T | 0.86 | 1.33 | 1.81 |
| LR | 0.57 | 2.19 | 2.92 |
V-C Multi-metric Transmission Schemes
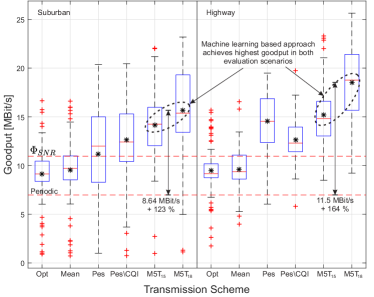
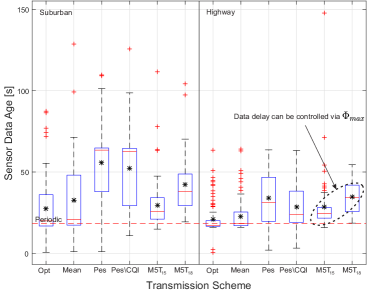
Fig. 8 shows the performance evaluation for the considered multi-metric transmission approaches. For this evaluation, the tracks are treated separately, as different behaviors were detected during the measurements. The weighted mean approach uses the same weights for all considered metrics as they achieved similar data rate values in the single-metric evaluations. It can be observed that the mean goodput for the optimistic and weighted mean approach is below the best single metric result which was achieved for . It can be concluded that low values of a single metric can be considered meaningful indicators for unfavorable channel connections. Contrastingly, high values of a single indicator do not provide enough information for detecting the presence of a connectivity hotspot. For the pessimistic approach, the results differ significantly depending on the considered evaluation track. While very high values are achieved for the highway track (mean: 14.58 MBit/s), the scheme shows a similar performance as the single-metric for the suburban track (mean: 11.16 MBit/s). The high rate of low Channel Quality Indicator (CQI) values as shown in Fig 6 combined with the low time variance due to relatively low velocity values results in a transmission scheme, which is mostly controlled by the transmission timeout and not the actual channel conditions. Therefore, another pessimistic transmission scheme is introduced, which does not integrate the CQI information into the transmission decision. As shown in the figure, the resulting performance is similar for the two tracks (suburban mean: 12.63 MBit/s, highway mean: 12.65 MBit/s). In conclusion, it is much more important to avoid transmissions during connectivity valleys than to leverage connectivity hotspots. The best performance is achieved with the machine learning based approach which does not only achieve the highest mean data rate (18.5 MBit/s for the highway scenario with =18 MBit/s) but also reduces the number of occurrences of low data rate transmissions significantly. It is the only scheme that is not only considering the network quality, but also the size of the payload which has a decent influence on the achievable efficiency as shown in Fig. 6. The tradeoff between goodput and data delay can be controlled by the parameter .
VI Conclusion
In this paper, we presented a probabilistic model for the efficient transmission of sensor data in a vehicular context. Its general goal is to find the optimal transmission time for vehicular sensor data with respect to the channel conditions in order to save communication resources and avoid retransmissions. In comprehensive field evaluations, the impact of different network quality indicators serving as metrics for the transmissions decision was evaluated. Although all considered metrics are able to increase the resulting data rate significantly, they differ in terms of variance and DMR. Through application of a machine learning based combination of the available network quality indicators, the average goodput can be further improved significantly while the delay is only slightly increased. Other variants of the proposed transmission scheme can be considered depending on the DMR requirements of the application. In future work, we want to further improve the transmission scheme by taking interdependencies with the transport layer protocols into account. Furthermore, we want to enhance the accuracy of network quality estimation by integrating knowledge about the cell capacity obtained from passive control channel analysis as described in [17].
Acknowledgment
Part of the work on this paper has been supported by Deutsche Forschungsgemeinschaft (DFG) within the Collaborative Research Center SFB 876 “Providing Information by Resource-Constrained Analysis”, projects A4 and B4 and has been conducted within the AutoMat (Automotive Big Data Marketplace for Innovative Cross-sectorial Vehicle Data Services) project, which received funding from the European Union’s Horizon 2020 (H2020) research and innovation programme under the Grant Agreement No 644657. Thomas Liebig received funding from the European Union Horizon 2020 Programme (Horizon2020/2014-2020), under grant agreement number 688380 “VaVeL: Variety, Veracity, VaLue: Handling the Multiplicity of Urban Sensors”.
References
- [1] C. Ide, B. Dusza, and C. Wietfeld, “Client-based control of the interdependence between LTE MTC and human data traffic in vehicular environments,” IEEE Transactions on Vehicular Technology, vol. 64, no. 5, pp. 1856–1871, May 2015.
- [2] C. Wietfeld, C. Ide, and B. Dusza, “Resource efficient mobile communications for crowd-sensing,” in 2014 51st ACM/EDAC/IEEE Design Automation Conference (DAC), June 2014, pp. 1–6.
- [3] N. Bui, M. Cesana, S. A. Hosseini, Q. Liao, I. Malanchini, and J. Widmer, “A survey of anticipatory mobile networking: Context-based classification, prediction methodologies, and optimization techniques,” IEEE Communications Surveys & Tutorials, 2017.
- [4] N. Abedini and S. Shakkottai, “Content caching and scheduling in wireless networks with elastic and inelastic traffic,” IEEE/ACM Trans. Netw., vol. 22, no. 3, pp. 864–874, Jun. 2014.
- [5] A. Balachandran, V. Sekar, A. Akella, S. Seshan, I. Stoica, and H. Zhang, “Developing a predictive model of quality of experience for internet video,” SIGCOMM Comput. Commun. Rev., vol. 43, no. 4, pp. 339–350, Aug. 2013.
- [6] F. Calabrese, G. D. Lorenzo, and C. Ratti, “Human mobility prediction based on individual and collective geographical preferences,” in 13th International IEEE Conference on Intelligent Transportation Systems, Sept 2010, pp. 312–317.
- [7] R. Margolies, A. Sridharan, V. Aggarwal, R. Jana, N. K. Shankaranarayanan, V. A. Vaishampayan, and G. Zussman, “Exploiting mobility in proportional fair cellular scheduling: Measurements and algorithms,” IEEE/ACM Trans. Netw., vol. 24, no. 1, pp. 355–367, Feb. 2016.
- [8] A. J. Nicholson and B. D. Noble, “Breadcrumbs: Forecasting mobile connectivity,” in Proceedings of the 14th ACM International Conference on Mobile Computing and Networking, ser. MobiCom ’08. New York, NY, USA: ACM, 2008, pp. 46–57.
- [9] M. Kasparick, R. L. G. Cavalcante, S. Valentin, S. Stańczak, and M. Yukawa, “Kernel-based adaptive online reconstruction of coverage maps with side information,” IEEE Transactions on Vehicular Technology, vol. 65, no. 7, pp. 5461–5473, July 2016.
- [10] A. H. Zahran, J. Quinlan, D. Raca, C. J. Sreenan, E. Halepovic, R. K. Sinha, R. Jana, and V. Gopalakrishnan, “Oscar: An optimized stall-cautious adaptive bitrate streaming algorithm for mobile networks,” in Proceedings of the 8th International Workshop on Mobile Video, ser. MoVid ’16. New York, NY, USA: ACM, 2016, pp. 2:1–2:6.
- [11] C. Wang, A. Rizk, and M. Zink, “Squad: A spectrum-based quality adaptation for dynamic adaptive streaming over http,” in Proceedings of the 7th International Conference on Multimedia Systems, ser. MMSys ’16. New York, NY, USA: ACM, 2016, pp. 1:1–1:12.
- [12] E. Halepovic, J. Pang, and O. Spatscheck, “Can you get me now?: Estimating the time-to-first-byte of HTTP transactions with passive measurements,” in Proceedings of the 2012 Internet Measurement Conference, ser. IMC ’12. New York, NY, USA: ACM, 2012, pp. 115–122.
- [13] C.-P. Wu and K. R. Baker, “Comparison of lte performance indicators and throughput in indoor and outdoor scenarios at 700 mhz,” in Proc. of IEEE Vehicular Technology Conference, Quebec City, Canada, Sep. 2012.
- [14] C. Ide, R. Falkenberg, D. Kaulbars, and C. Wietfeld, “Empirical analysis of the impact of LTE downlink channel indicators on the uplink connectivity,” in IEEE Vehicular Technology Conference (VTC-Spring). Nanjing, China: IEEE, may 2016.
- [15] B. Sliwa, “Raw experimental cellular network quality data,” Oct 2017. [Online]. Available: http://doi.org/10.5281/zenodo.1035079
- [16] W. Vandenberghe, E. Vanhauwaert, S. Verbrugge, I. Moerman, and P. Demeester, “Feasibility of expanding traffic monitoring systems with floating car data technology,” IET Intelligent Transport Systems, vol. 6, no. 4, pp. 347–354, December 2012.
- [17] R. Falkenberg, K. Heimann, and C. Wietfeld, “Discover your competition in LTE: Client-based passive data rate prediction by machine learning,” in IEEE Globecom, Singapore, dec 2017.