Send correspondence to Jonas Teuwen: jonas.teuwen@radboudumc.nl. \cftpagenumbersofffigure \cftpagenumbersofftable
Automated soft tissue lesion detection and segmentation in digital mammography using a u-net deep learning network
Abstract
Computer-aided detection or decision support systems aim to improve breast cancer screening programs by helping radiologists to evaluate digital mammography (DM) exams. Commonly such methods proceed in two steps: selection of candidate regions for malignancy, and later classification as either malignant or not. In this study, we present a candidate detection method based on deep learning to automatically detect and additionally segment soft tissue lesions in DM. A database of DM exams (mostly bilateral and two views) was collected from our institutional archive. In total, 7196 DM exams (28294 DM images) acquired with systems from three different vendors (General Electric, Siemens, Hologic) were collected, of which 2883 contained malignant lesions verified with histopathology. Data was randomly split on an exam level into training (50%), validation (10%) and testing (40%) of deep neural network with u-net architecture. The u-net classifies the image but also provides lesion segmentation. Free receiver operating characteristic (FROC) analysis was used to evaluate the model, on an image and on an exam level. On an image level, a maximum sensitivity of 0.94 at 7.93 false positives (FP) per image was achieved. Similarly, per exam a maximum sensitivity of 0.98 at 7.81 FP per image was achieved. In conclusion, the method could be used as a candidate selection model with high accuracy and with the additional information of lesion segmentation.
keywords:
digital mammography, automatic lesion detection, automatic lesion segmentation, deep learning1 Introduction
Population-based breast cancer screening programs with mammography have proven to reduce mortality and the morbidity associated with advanced stages of the disease. Nevertheless, their effectiveness is subject of discussion due to possible overdiagnosis, high false positive rate, or insufficient detection rate for dense breasts. Still, one of the main pitfalls is possible interpretation errors by the radiologists who have to evaluate a large amount of mammograms with a very low prevalence of malignant cases.
Several studies have shown that a significant number of the diagnosed cancers were already visible on previous screening mammograms which were marked as negative [1, 2]. Additionally, there is a significant variability between readers in terms of both sensitivity and specificity [3], and therefore combining assessments by two or more readers [4] improves screening performance.
Computer-aided detection or decision support systems could improve the breast cancer screening programs by helping radiologists. Unfortunately, several studies have shown that radiologists do not improve their screening performance when using computer-aided detection systems, mainly because of a low specificity of these traditional systems[5].
Recent developments in machine learning algorithms have greatly improved the performance of computer vision and models in medical imaging by using deep learning neural networks. It can therefore be expected that a new generation of computer-aided detection or diagnosis systems for digital mammography (DM) could be reliable used by radiologists to improve the efficiency of breast cancer screening programs.
Generally, computer-aided detection or decision support systems proceed in two steps. In the first step, the whole mammogram is processed and regions of interest are selected, the so-called candidate detector. The primary goal of this step is to greatly reduce the number of search locations while achieving a sensitivity near . In the second step, the goal is to remove the false positives, while keeping the true positives. Up to now, most reported candidate selectors are not based on deep learning technology. In this paper we propose a deep learning network as candidate selector, which automatically detects and additionally segments malignant lesions in DM images.
2 Materials and Methods
2.1 Patient population
This study was conducted with anonymized data retrospectively collected from our institutional archive. It was approved by the regional ethics board after summary review, with waiver of a full review and informed consent.
DM exams from women attending the national screening program at our collaborator institution, or our institution for diagnostic purposes between 2000 and 2016 were included.
All cases with biopsy-proven malignant soft tissue lesions were collected, while normal exams were selected if they had at least two years of negative follow-up. This yielded a total of 7196 DM exams, from which 2883 exams (42%) contained a total of 3023 biopsy-verified malignant lesions. Most exams were bilateral and included two views (cranio-caudal -CC- and medio-lateral oblique -MLO-), resulting in a total of 28924 images. The exact distribution is summarized in Table 1.
| General Electric | Siemens | Hologic | |
|---|---|---|---|
| number of studies | 2248 | 1518 | 3430 |
| - normal images | 7771 | 5842 | 12288 |
| - images with malignant lesion(s) | 1292 | 255 | 1476 |
2.2 Image acquisition and preprocessing
The images were acquired by four DM machines from three different vendors (Senographe 2000D and Senographe DS, General Electric, USA; Mammomat Inspiration, Siemens, Germany; Selenia Dimensions, Hologic, USA;). Distributions are shown in Table 1.
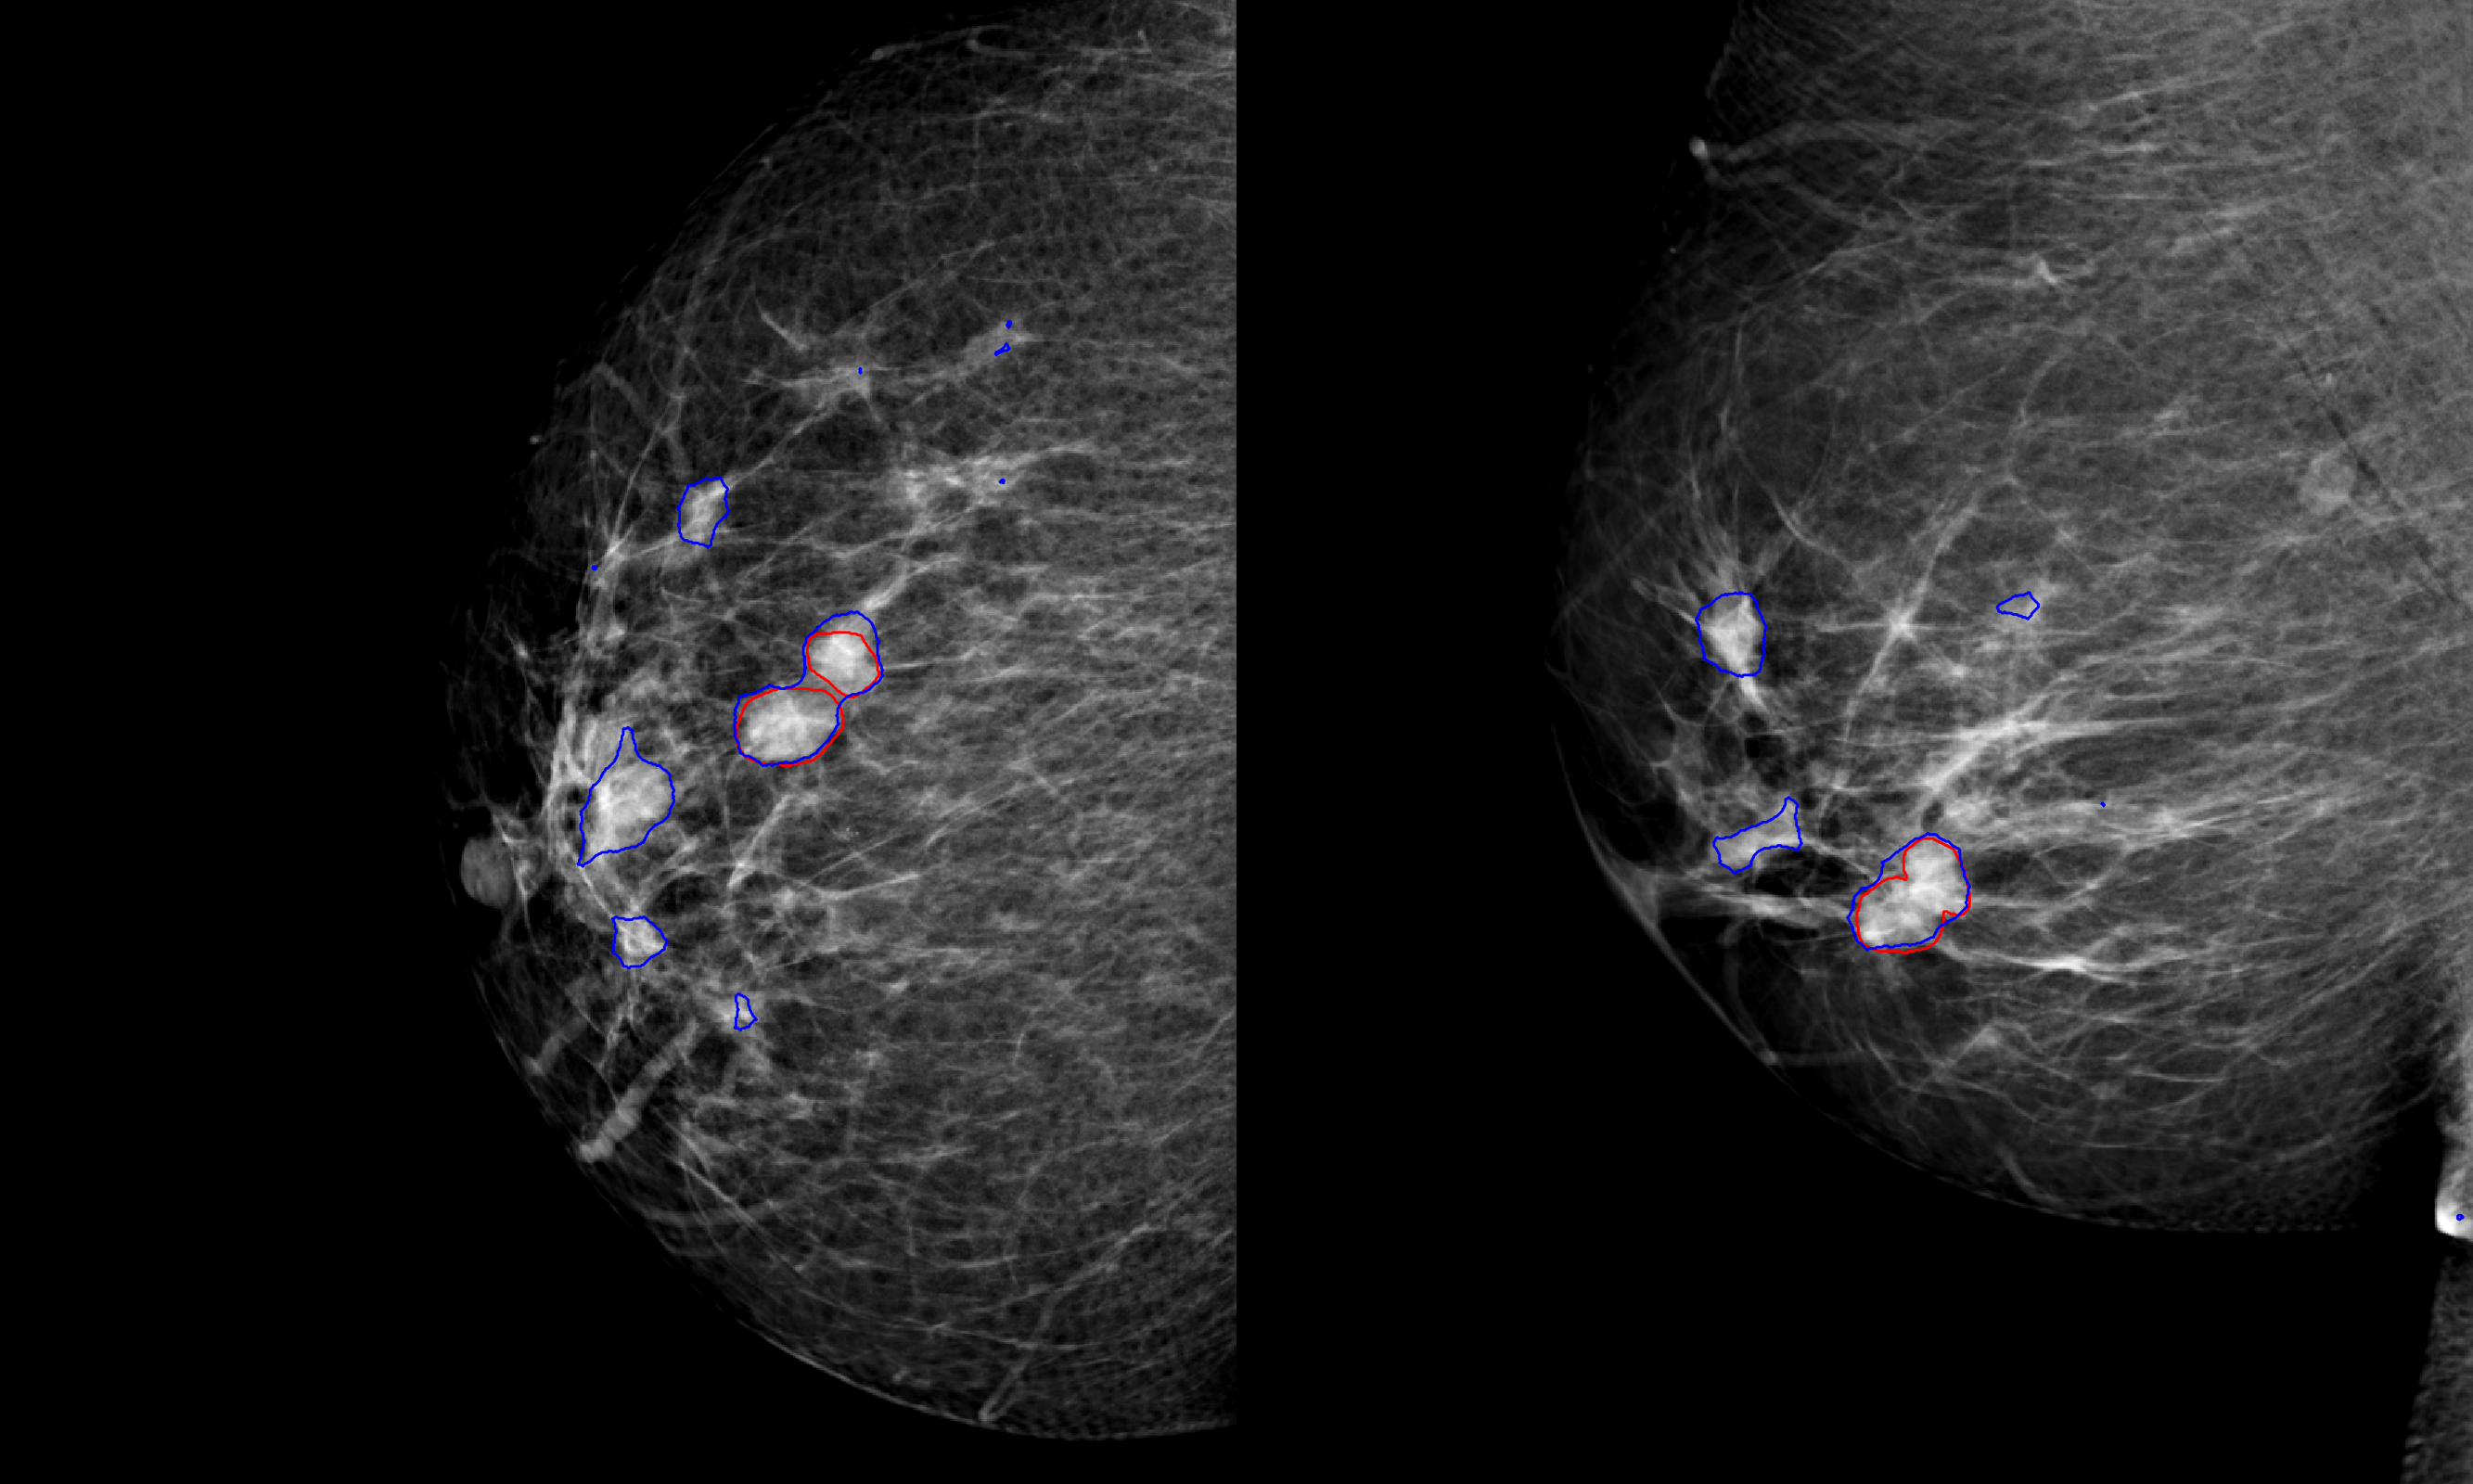
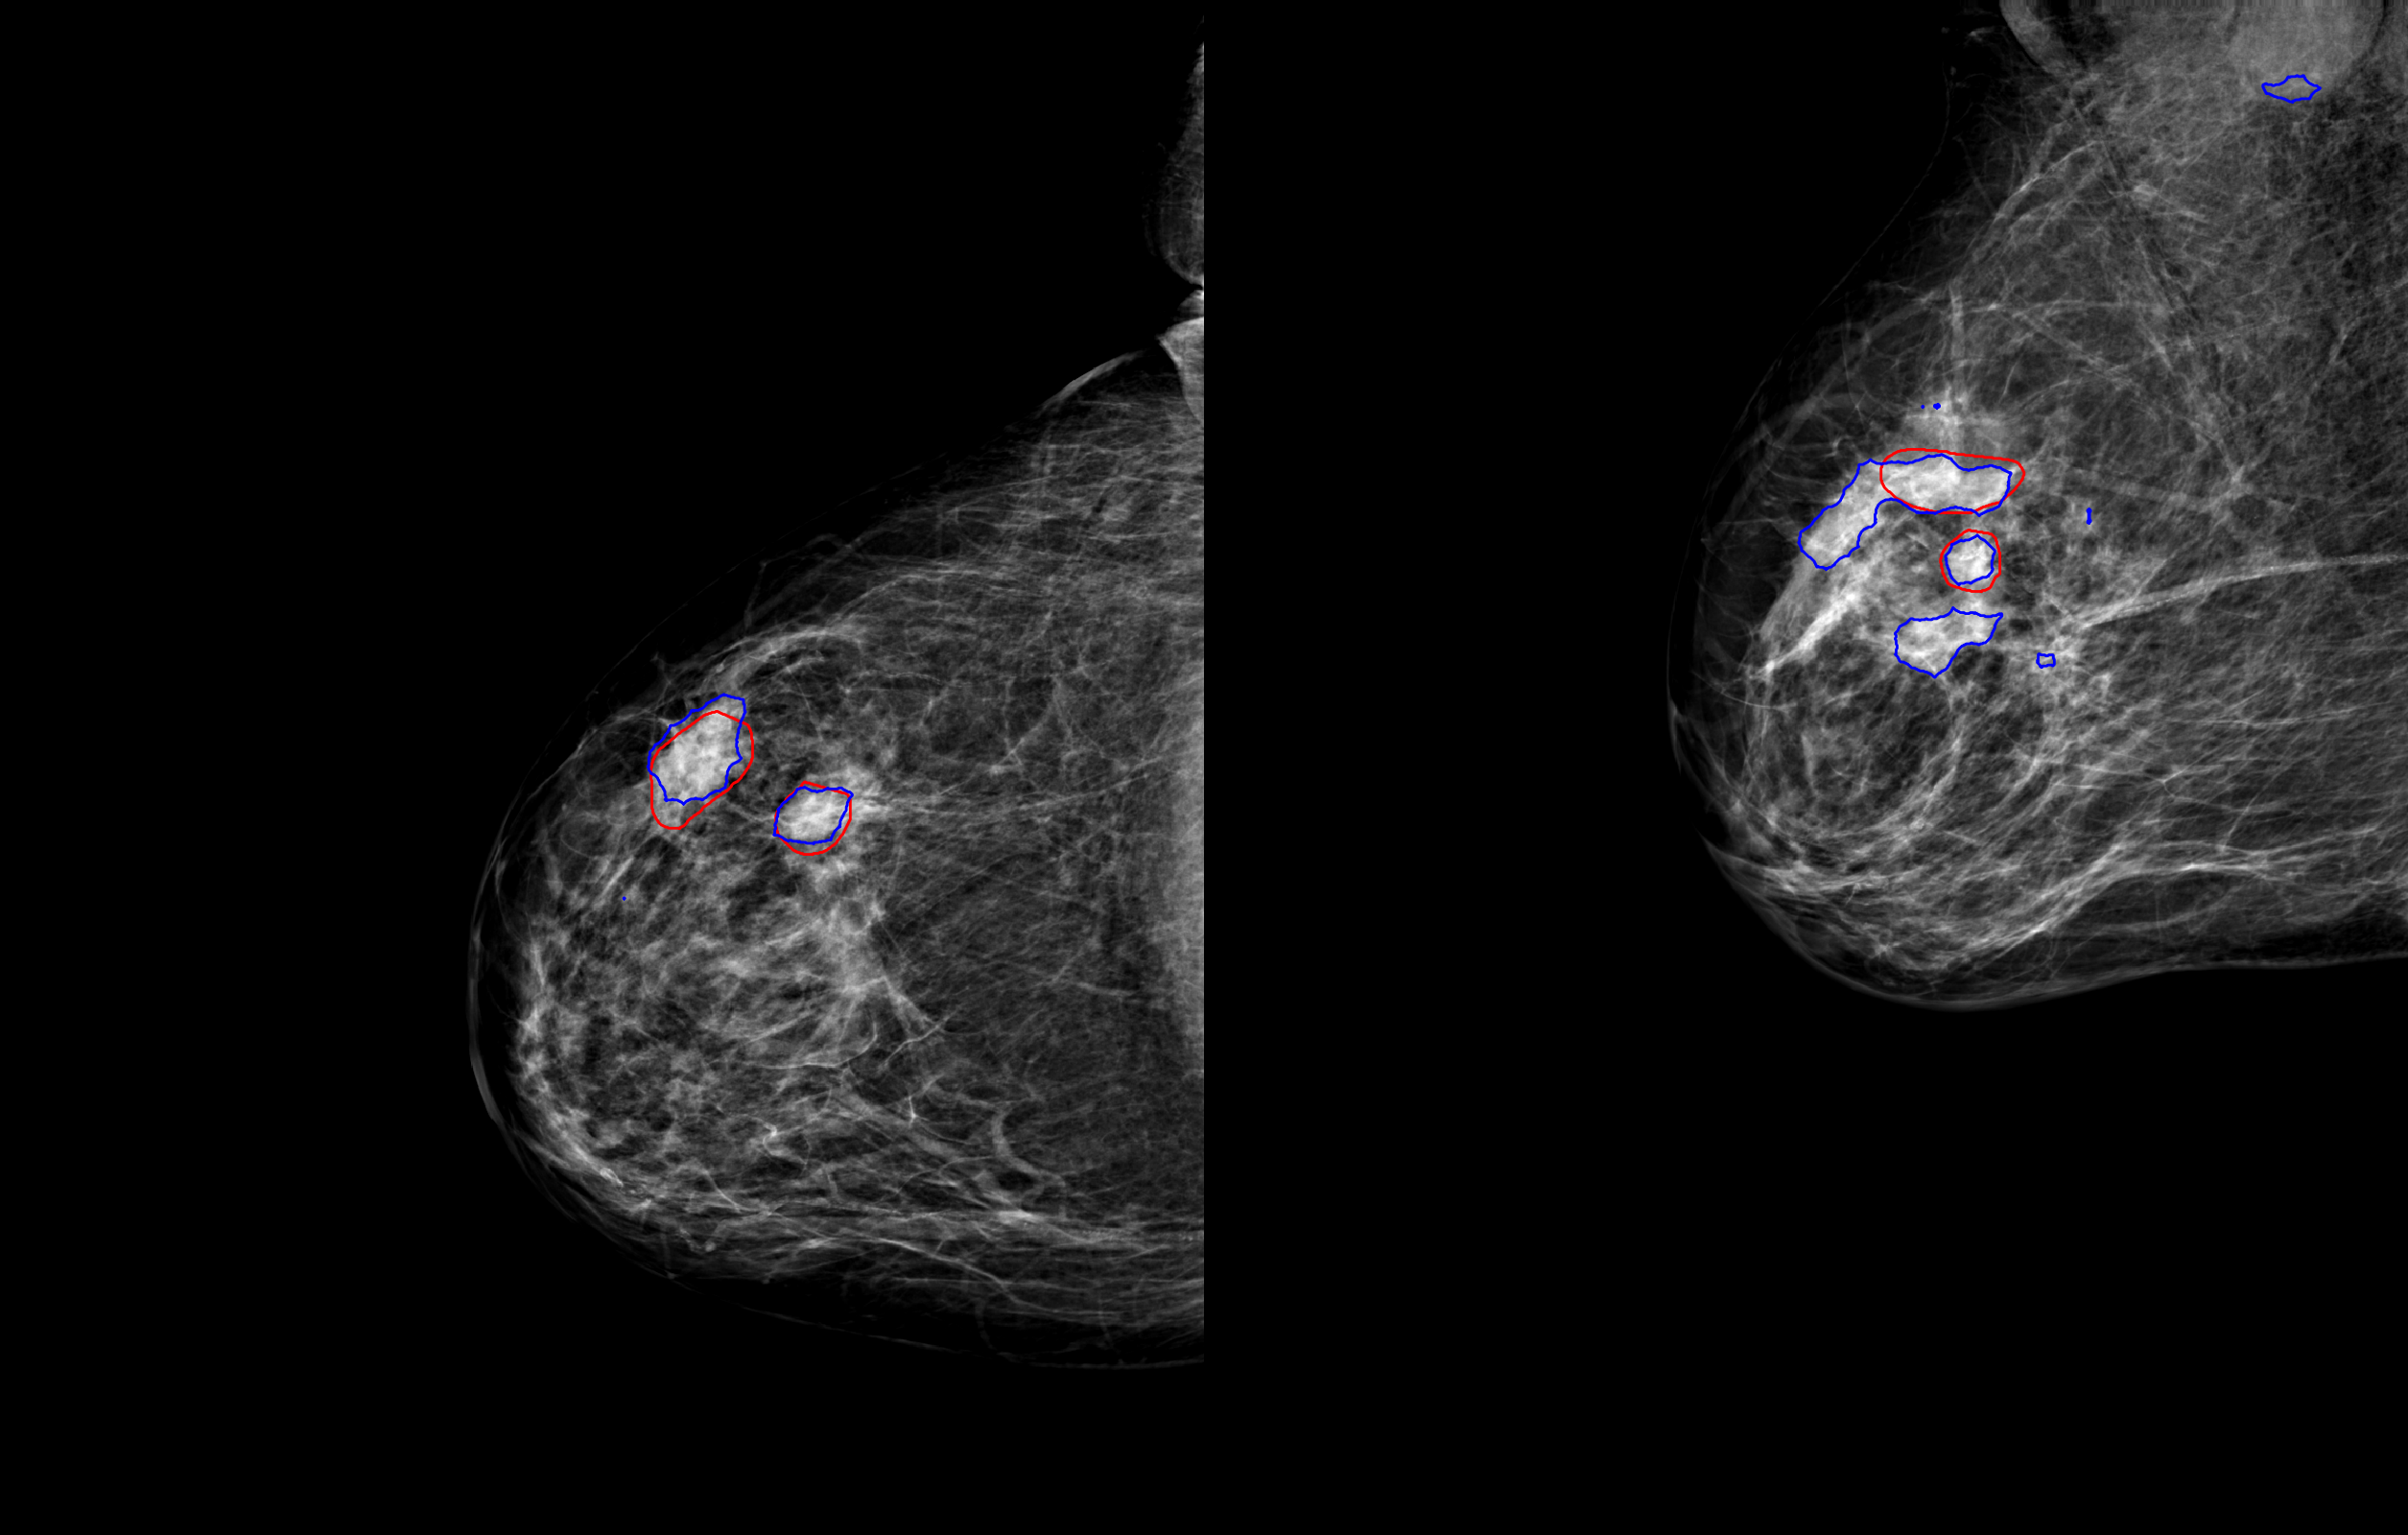
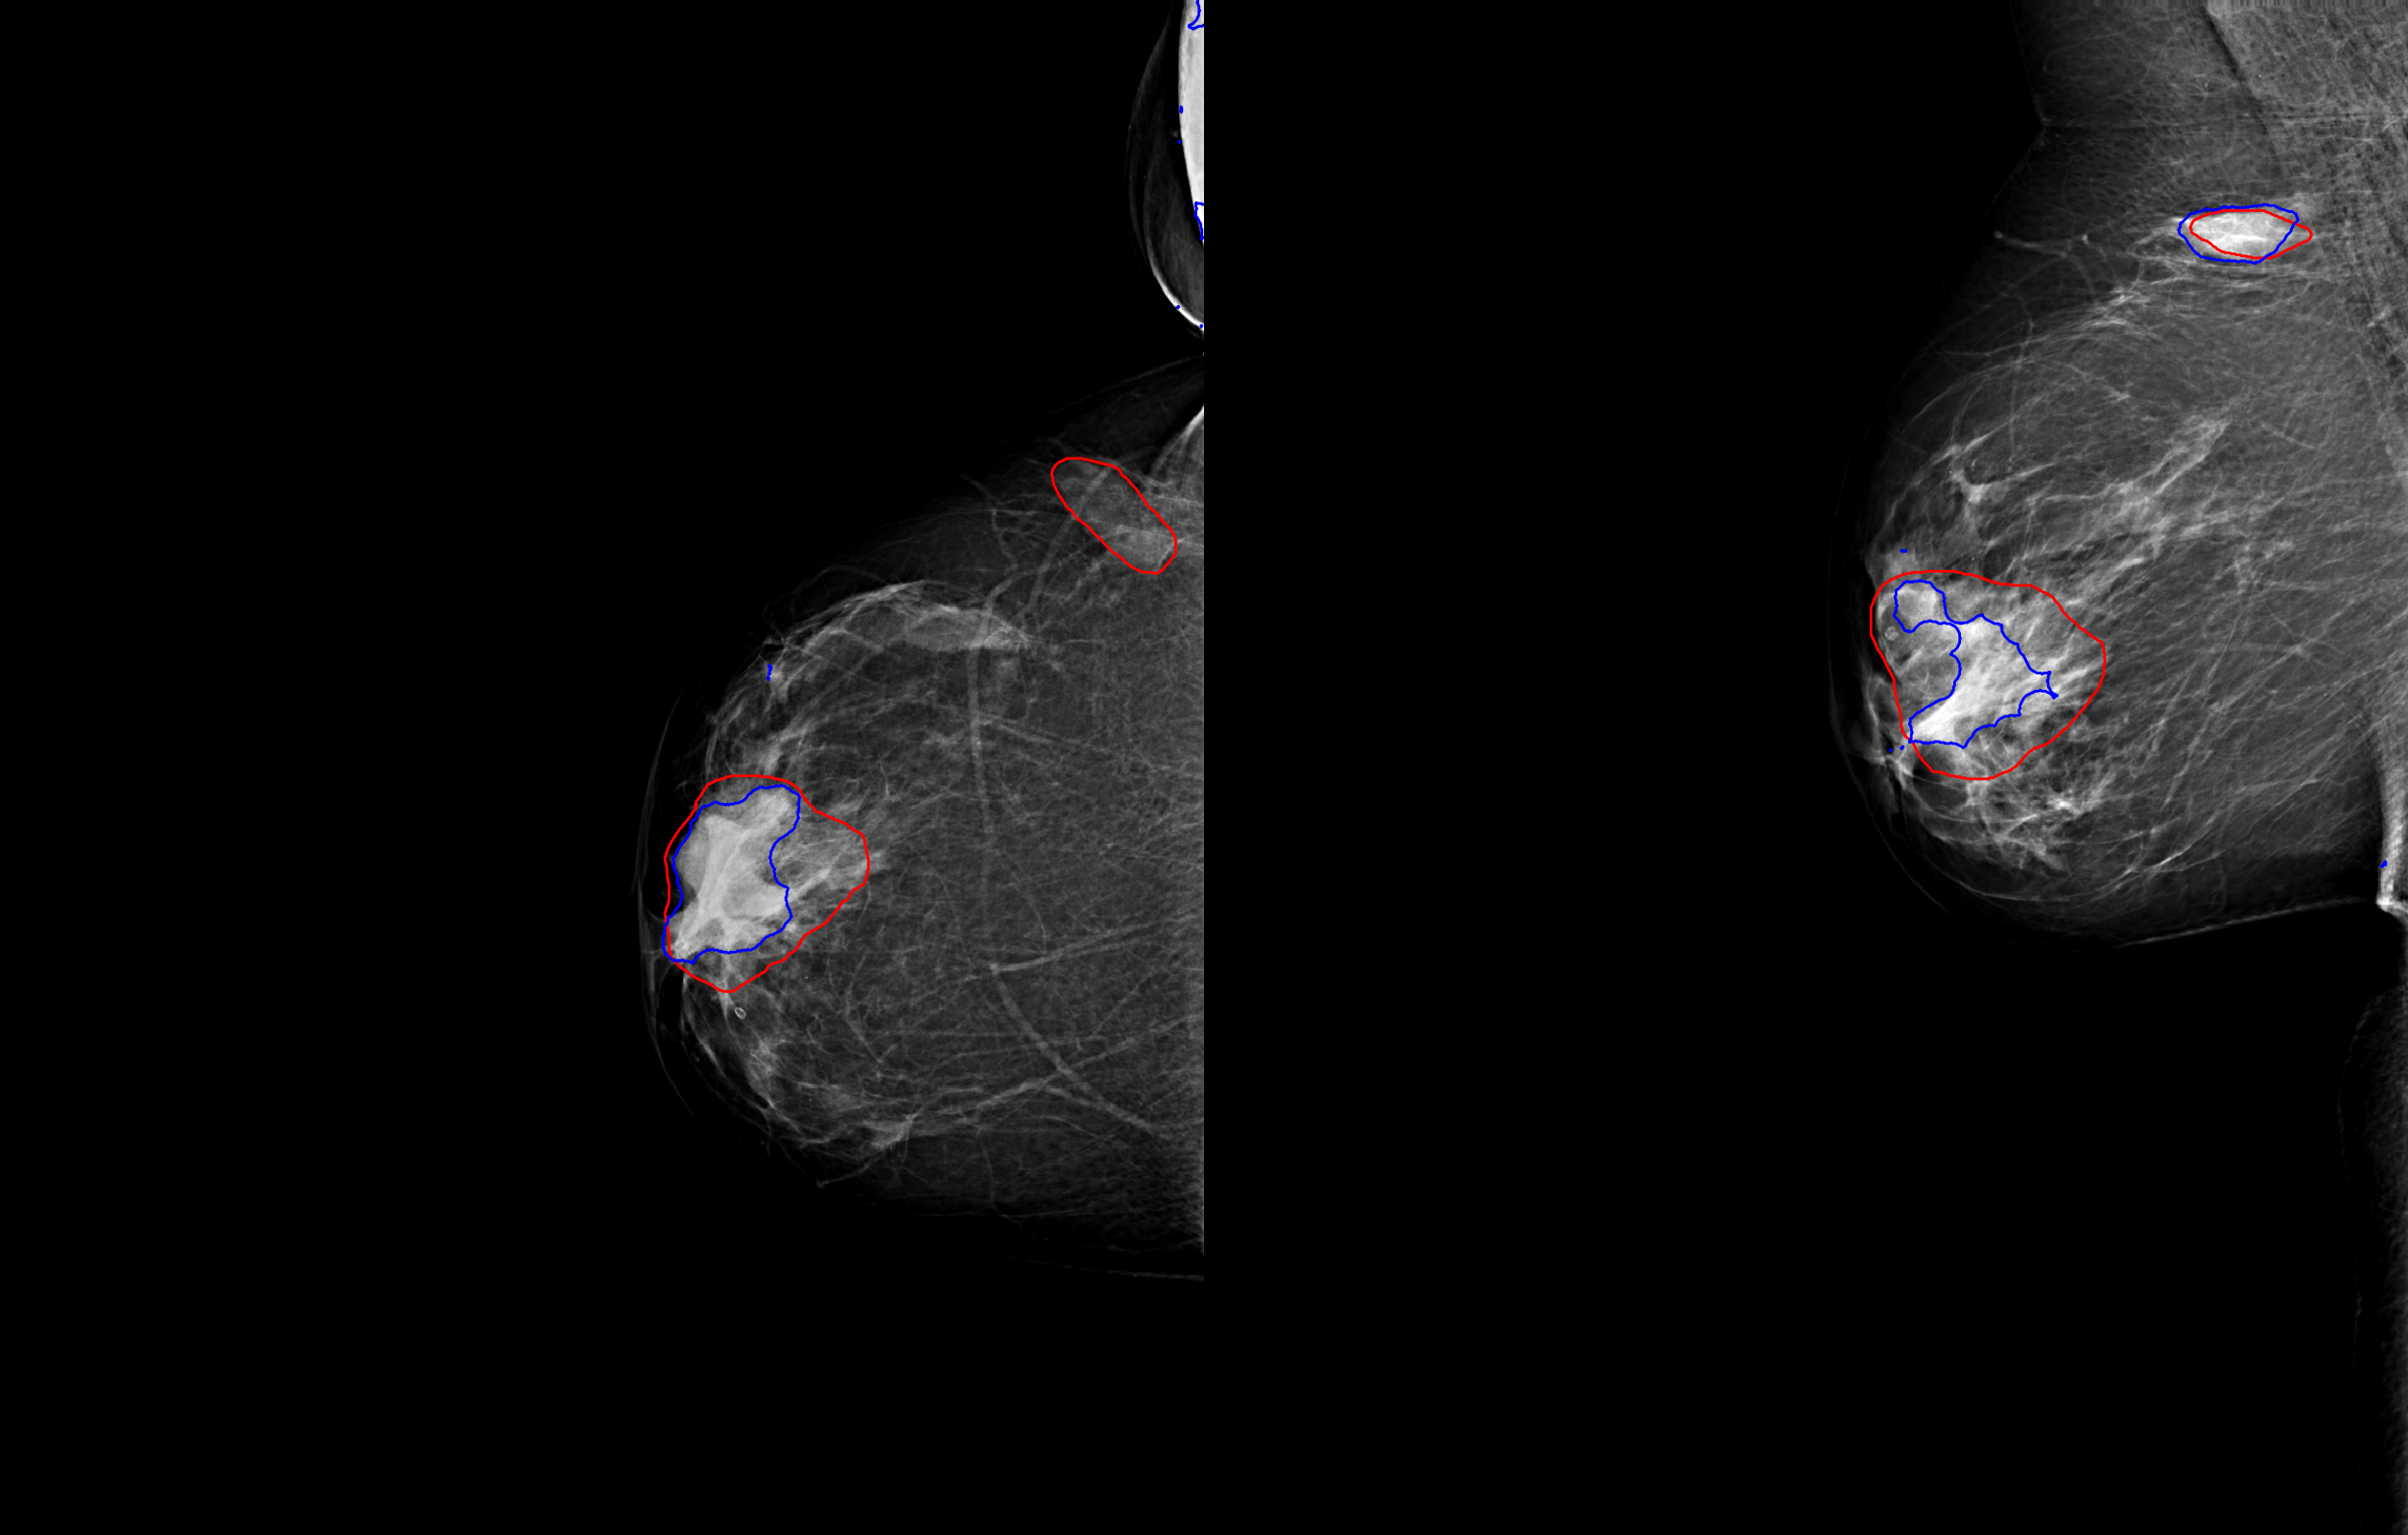
Images were preprocessed in three steps. First, an energy band normalization technique was applied [6]. To homogenize the pixel size across different vendors, images were downscaled to after applying a Gaussian filter. Finally, pixel values were scaled to the range . Examples of preprocessed images with outlined lesions are shown in Figure 1.

2.3 Ground truth labeling and segmentation
All cases with malignant lesions were verified by histopathology and manually annotated and segmented under the supervision of an expert breast radiologist, with access to other breast imaging exams, radiological and histopathological reports. More than of the lesions had a maximal bounding box diameter of and on average had a height/width ratio of about . The negative cases were verified by at least two years of negative follow-up imaging exams.
2.4 Deep learning network and training
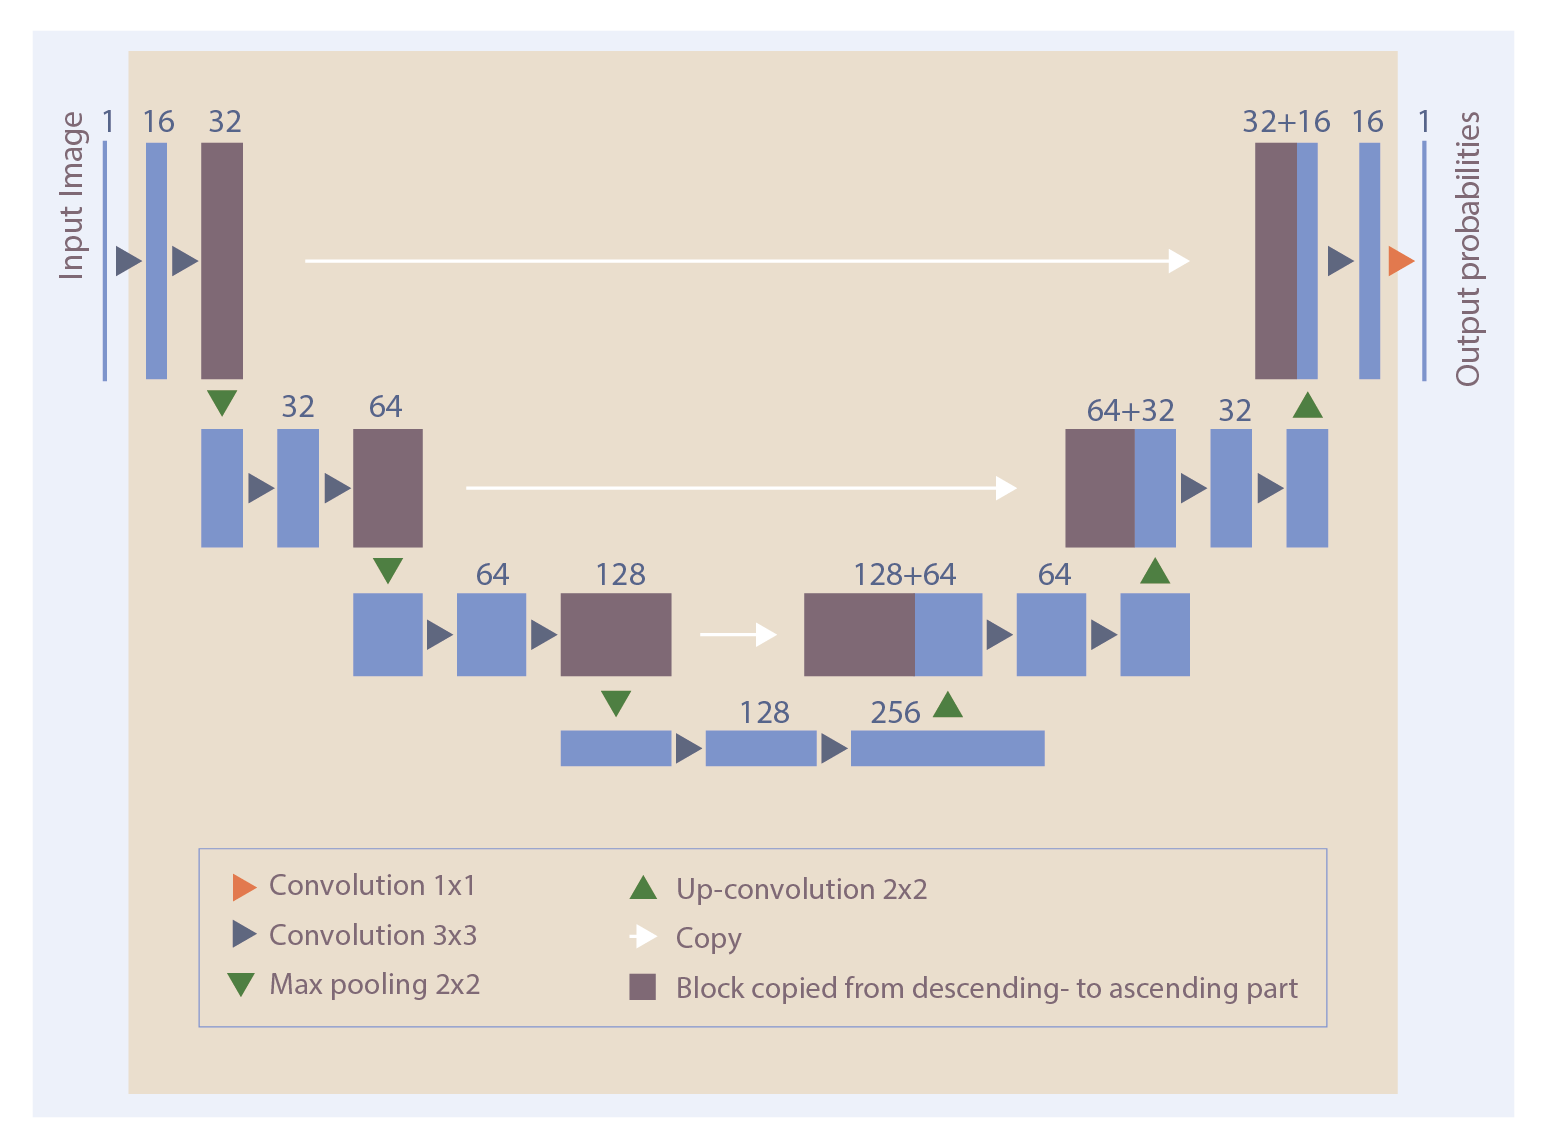
The goal was to detect and segment the malignant lesions. For that, a deep learning convolutional neural network with modified u-net architecture [7] was employed (detailed in Figure 2) and trained on data from all three vendors.
The u-net worked on a patch level ( pixels = , considered to provide enough context to discriminate soft tissue lesions). A u-net is a so-called fully convolutional network, so it is agnostic to the size of the input, so we can evaluate the trained network on complete mammograms. Positive samples were extracted around the center-of-mass of the annotated lesion and zero-padded if necessary. Negative patches were randomly selected patches within the breast from the normal cases. During each epoch all positive samples were presented and an equal number of randomly selected negatives. Data was split on a DM exam level to avoid bias: of the data was used for training of the u-net model, for the validation, and for independent test.
The model was trained using stochastic gradient descent with momentum (0.9) using a weighted logistic loss function with weight for the negative samples. The learning rate, initially was reduced by a factor of if the validation loss did not improve for at least 5 epochs. Up-down and left-right flips were used as data augmentations.
2.5 Performance analysis: FROC
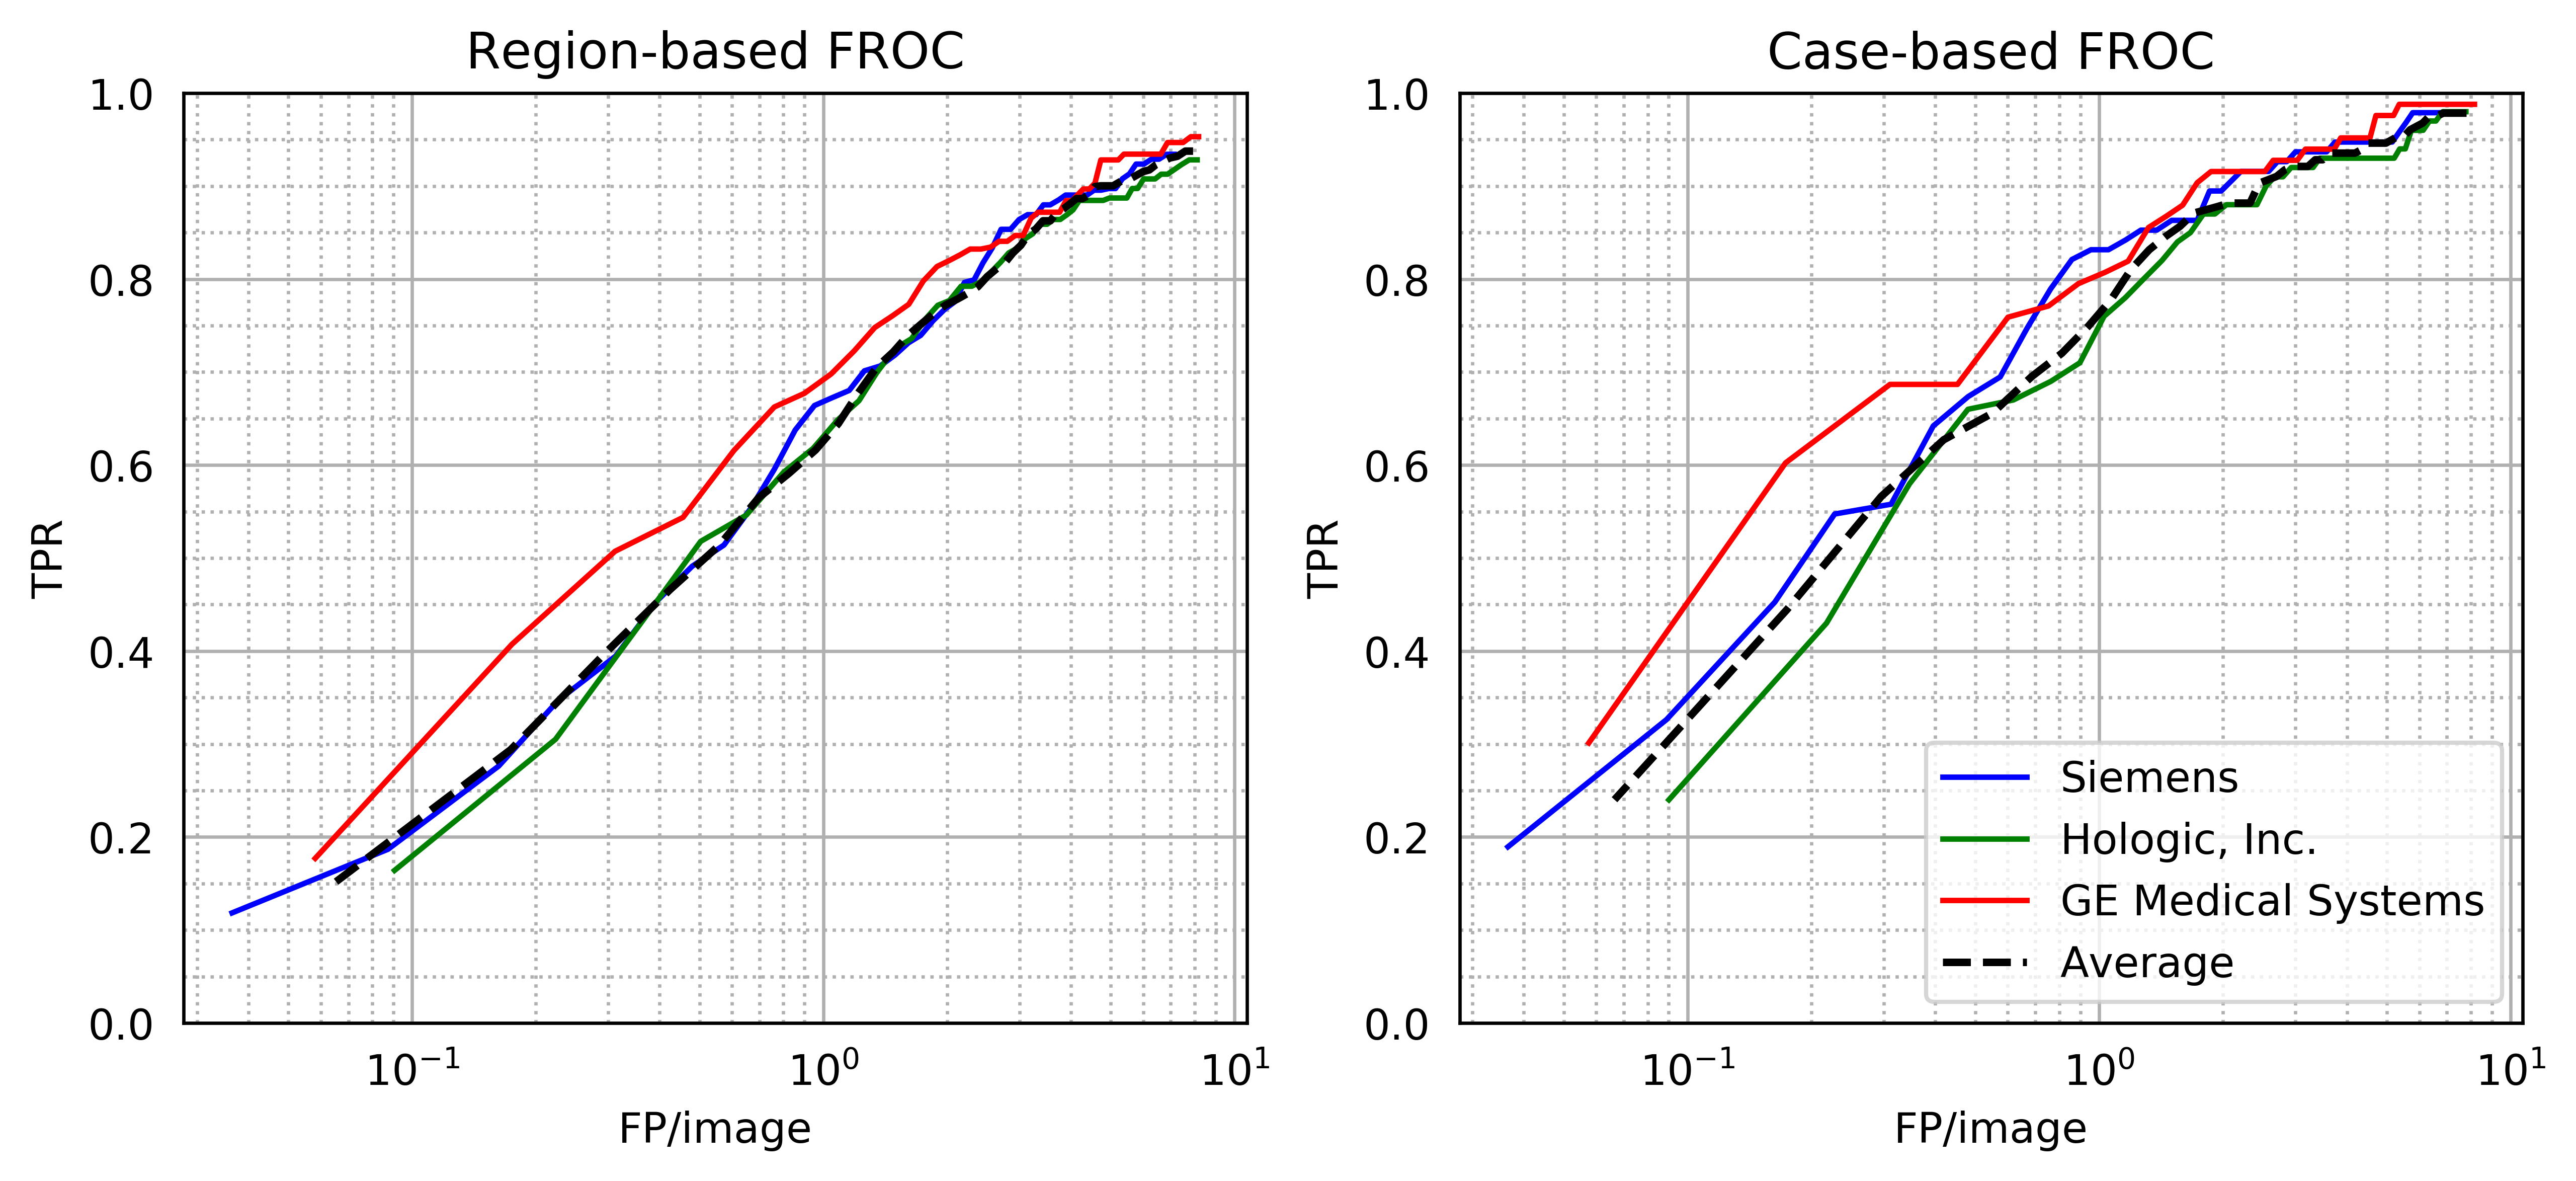
The performance of the model was evaluated with free receiver operating characteristic (FROC) analysis, on a region and case basis.
Given a mammogram, the deep neural network produces a probability map where each pixel represents the probability that this pixel belongs to a suspicious lesion.
Before we proceed with the FROC analysis where we compare predicted locations with the ground truth, we need to convert this probability map to a list of candidate locations and the ground truth segmentation to such a list as well.
To convert the probability map to a list of candidates, we first binarize the map by thresholding at which is the value which gave good performance on the validation and training sets. On this map we compute all connected components. Given these components, we generate candidates at threshold by finding all points which have probability values above . To reduce the number of candidates, we cluster all candidates within a radius of . The ground truth segmentation are converted into coordinates by computing the center of mass for each lesion.
Given the candidates and the ground truth, we can compute two types of FROC curves: the image-based and the exam-based FROC curve. In the FROC analysis, lesion is said to be correctly predicted if there is a candidate within of the center-of-mass of the lesion.
In both FROCs we plot the average number of false positives per image (FP/image) against the true-positive rate (TPR). A point on the FROC is computed as follows: for each threshold we count the number of false positives on the normals as we can guarantee there are no lesions there. In the image-based case we compute the average TPR per image, where the TPR per image is the ratio of the number of lesions correctly predicted in this image. The exam-based approach gives a TPR of if at least one of the lesions is correctly predicted in the study, and else .
3 Results
The resulting FROC curves are given in Figure 3. For the image-based FROC we obtain a maximum sensitivity of with a false positive rate per image of at a threshold of (which is the lowest threshold where the sensitivity did not further improve). In the exam-based FROC, the maximum sensitivity is with a false positive rate per image of .
4 Conclusions
In this abstract we presented a method which detects and segments soft tissue lesions in digital mammography, and could be used as a candidate detection model for automated detection and diagnosis computer systems. Therefore, it is important that such candidate model can detect all exams with cancer lesions. Our model achieved an acceptable performance of sensitivity with a false positive rate per image of in the exam-based FROC.
Compared to the classical candidate detection techniques, we also provide a segmentation of the lesion. This allows to study the temporal changes, such as growth or morphological modifications over time. Furthermore, if we have information available of the shape of the projection of the lesion, this might improve the correlation of candidates between the MLO and CC views more precisely.
One of the main limitations of our study is that we only studied soft tissue lesions. A model that can also detect and segment calcifications would be of great added value and the feasibility of using a u-net deep learning architecture for this task should be explored. Also, including data from more manufacturers or some other normalization techniques could allow to reduce the performance variability across vendors. Finally, introducing benign lesions to provide the model with more information should also be explored, in order to reduce the number of false positive assessments.
Another topic of future work is to study whether this two-dimensional detection and segmentation model can be applied in digital breast tomosynthesis (slice by slice basis) or synthetic mammography images, both of which are often combined with DM as a breast cancer screening protocol. Having a robust candidate detection for all of these three types of images would be beneficial to also have a robust computer system that can correlate information across modalities.
References
- [1] “Breast Cancer Detected with Screening US: Reasons for Nondetection at Mammography,” Radiology 270, 369–377 (2014).
- [2] “Breast Cancer: Missed Interval and Screening-detected Cancer at Full-Field Digital Mammography and Screen-Film Mammography— Results from a Retrospective Review,” Radiology 264, 378–386 (2012).
- [3] R. Smith-Bindman, P. Chu, D. L. Miglioretti, et al., “Physician Predictors of Mammographic Accuracy,” JNCI Journal of the National Cancer Institute 97, 358–367 (2005).
- [4] N. Karssemeijer, J. D. Otten, A. A. J. Roelofs, et al., “Effect of independent multiple reading of mammograms on detection performance,” in Medical Imaging 2004, D. P. Chakraborty and M. P. Eckstein, Eds., 82–89 (2004).
- [5] C. D. Lehman, R. D. Wellman, D. S. M. Buist, et al., “Diagnostic Accuracy of Digital Screening Mammography With and Without Computer-Aided Detection,” JAMA Internal Medicine 175, 1828 (2015).
- [6] R. H. H. M. Philipsen, P. Maduskar, L. Hogeweg, et al., “Localized Energy-Based Normalization of Medical Images: Application to Chest Radiography,” IEEE Transactions on Medical Imaging 34, 1965–1975 (2015).
- [7] O. Ronneberger, P. Fischer, and T. Brox, “U-Net: Convolutional Networks for Biomedical Image Segmentation,” (2015).