Probing feedback in high- galaxies using extended UV luminosity functions
Abstract
We fit the recently updated UV luminosity functions (LF) of high- () galaxies using our semi-analytical models of galaxy formation that take into account various feedback processes. In order to reproduce the overall redshift evolution we require the efficiency of converting gas into stars to decrease with decreasing redshift. Even for , our models require supernovae (SNe) feedback to reproduce the observed LF suggesting the prevalence of galactic winds that could have polluted the inter-galactic medium even at very high redshifts. The observed LF in the low luminosity end for shows an upward turn. In our models we reproduce this trend using passively evolving population of galaxies. Measuring stellar mass, age and metallicity of these galaxies using multi-band spectral energy distribution (SED) fitting will place strong constraints on the existence of such galaxies. While Active galactic Nuclei (AGN) feedback is essential to reproduce the LF at high luminosity end for , it may not needed in the case of . We show that the expected turn around in the LF due to cooling criteria occurs at luminosity much lower than what has been probed with present day observations. With future deep observations, that can measure the LF more accurately, we will be able to distinguish between different modes of SNe feedback and get insights into the physical processes that drive the galaxy evolution.
keywords:
galaxies: formation – galaxies: high-redshift – galaxies: luminosity function, mass function1 Introduction
In the most favoured scenario of structure formation today, first structures hosting galaxies were formed around redshift (Barkana & Loeb, 2001). Stars in these structures produced Ultra-Violet (UV) photons that started reionizing the intergalactic medium (IGM). The polarisation of cosmic microwave background radiation (CMBR) and the Gunn-Peterson effect seen in the quasar spectra can be used to constrain physical quantities driving this process (Planck Collaboration et al., 2016b; Fan et al., 2006). Several theoretical models of reionisation have been proposed that are consistent with CMBR and quasar observations (Barkana & Loeb, 2001; Choudhury & Ferrara, 2006; Dijkstra et al., 2007; Gnedin, 2008; Mitra et al., 2015). At present consistent reionization can be achieved with UV photons originating from galaxies (with much higher escape fraction than what is observed in local galaxies) or using faint quasars (Madau & Haardt, 2015; Khaire et al., 2016). A good progress in our understanding of galaxy formation and various feedback processes at play can be made if we are able to quantify the faint and bright end slopes of the galaxy luminosity functions at high redshifts. While the former that gets affected by radiative and supernovae (SNe) feedbacks requires deep observations, the latter mainly influenced by the Active Galactic Nuclei (AGN) feedback needs wide field observations.
Indeed, the recent advancement of observational techniques has enabled us to directly observe the distant faint galaxies that could have played a major role in the hydrogen reionisation process. In particular, with the help of gravitational lensing by the foreground clusters of galaxies, Livermore et al. (2017) have managed to detect very faint galaxies (upto UV magnitude M) as early as at when the universe may still be going through the HI reionization. Taking advantage of the magnification of gravitational lensing they could observe 10 times fainter galaxies compared to direct deep field observations using Lyman break technique (i.e. Bouwens et al., 2015). Their observations show that the faint end slope of UV luminosity function of galaxies is a power-law that extends upto their observational limits of M (However see Bouwens et al., 2017b, a, for discussions on uncertainties in the luminosity function when lensing magnification is large and when galaxy sizes are unknown). Further, Alavi et al. (2016) presented UV luminosity function of faint galaxies (i.e. M) at , using similar idea of detecting galaxies in the gravitationally lensed fields. On the other hand Ono et al. (2018) have measured the bright end UV luminosity functions of galaxies at upto M.
The faint end slope of the luminosity function is sensitive to ionisation feedback (eg. Samui et al., 2007), presence of massive neutrinos (Jose et al., 2011) or warm dark matter (Menci et al., 2016; Corasaniti et al., 2017). The above mentioned observations can play an important role in understanding and/or distinguishing between these possibilities (Yue et al., 2016; Finlator et al., 2017). At low and intermediate mass ranges the nature of supernovae driven wind feedback can also alter the shape of the luminosity functions (i.e. Hopkins et al., 2012; Samui, 2014; Somerville & Davé, 2015). AGN are likely to play an important role on the amount of star formation in bright galaxies and thereby influence the bright end of the luminosity function (Bower et al., 2006; Best et al., 2006). We have been developing semi-analytical models of galaxy formation to study high- luminosity functions, galactic outflows and their effects on the IGM (Samui et al., 2007, 2008; Samui, 2014; Jose et al., 2014; Samui et al., 2018). Our models incorporate various feedback processes to reproduce correct shape of the luminosity function from the dark matter mass function over a large redshift range. In this work we use the above mentioned luminosity function observations to place constraints on different feedback processes in our models and study their redshift evolution.
The latest Planck’s observations of CMBR suggest a very low optical depth to the reionisation ( Planck Collaboration et al., 2016b). They also inferred a rapid reionisation process with at 2 level ()111 and are redshifts when IGM was 10% and 99% ionised respectively. and reionisation redshift . Thus we aim to model the observed galaxy luminosity functions at different redshifts while simultaneously satisfying the reionization constraints from Planck’s measurements.
The paper is organised as follows. In the following section we briefly describe our semi-analytic models. In Sec. 3 we highlight our results and finally in section 4 we conclude with some discussions. Through out this work we consider cosmological parameters that are reported by the Planck’s Team (Planck Collaboration et al., 2016a), i.e. , , , , km s-1Mpc-1 and .
2 Star formation models
We follow our previous star formation model of Samui (2014) that uses Sheth-Tormen halo mass function (Sheth & Tormen, 1999), a simple prescription for star formation and includes supernova and radiative feedbacks on the star formation in galaxies. In this model, the star formation rate in a collapsed dark matter halo evolves with time () as
| (1) |
Here, is the mass of stars and is the total baryonic mass that collapsed with the dark matter and is equal to , with being the total halo mass. The star formation efficiency of the halo/galaxy is governed by the parameter and the duration of the star formation activity is govern by the value of ; is the dynamical time scale. Note that is not exactly the star formation efficiency as traditionally used in the literature. Total mass that would be finally converted into stars is (see Samui, 2014, for detailed calculation). Further, supernova feedback is regulated by the mass loading factor which is defined to be the ratio of mass outflowing rate produced by the supernova explosions to star formation rate. Depending on outflow models, if outflows are energy driven and/or cosmic ray driven, or if outflows are momentum driven ( circular velocity of the halo, see Samui et al., 2008, for details). Further, setting would produce a star formation scenario in absence of the supernova feedback (i.e. a close box model of star formation). In what follows, we adopt , and 1 for energy/cosmic ray and momentum driven outflows respectively, is the circular velocity scale at which . As the shape of the luminosity function is also regulated by the wind feedback, one of the motivation of this work is to probe the nature and extent of the SNe feedback using the observed luminosity functions that spread over wide luminosity intervals.
Note that the star formation prescription given in Eq. 1 considers only the onset of a burst of star formation that resulted due to the formation of the halo. It does not take into account the passive star formation that originates due to slow accretion of matter at the later stages of the galaxy evolution as seen in the red sequence galaxies (van den Bosch et al., 2008). In order to model this, we freeze the star formation rate of a galaxy of mass after the burst of star formation when it reaches to a value of M⊙/yr. Thus a M⊙ halo would form stars at a constant rate of 0.01 M⊙/yr at later stage of its evolution. Such a normalisation is motivated by the fact that our Galaxy with a halo mass M⊙ has a constant slow star formation rate of about 1 M⊙/yr (Robitaille & Whitney, 2010). Thus over a 10 billion years of time scale, only of total baryons is converted to stars due to the adopted model of passive star formation. Note that Dekel & Mandelker (2014) obtained such star formation rate in a quasi-steady state “bathtub” model for timescales quite longer than the dynamical time (also see Dekel et al., 2013). In our model the passive mode of star formation starts only after few dynamical times.
The formation rate of dark matter halos at a given redshift, , is obtained from the time derivative of Sheth-Tormen mass function (Sheth & Tormen, 1999) that provides reasonably good fit to the cosmological simulation results. Note that in principle one could consider the contribution of satellites in dark matter halos; however, it was shown in Jose et al. (2013) that the contribution of satellite galaxies to the luminosity function is negligibly small in the redshift range of interest here. The star formation rate in a given galaxy of mass that has collapsed at redshift and being observed at , , is converted to the UV luminosity, , by convolving the luminosity evolution for a single burst of star formation with a Salpeter initial mass function in the mass range M⊙ (see Samui et al., 2007, for details). Further, we assume that the observed luminosity is the intrinsic luminosity reduced by a factor due to dust reddening. Finally the UV luminosity function, , at a given redshift is obtained by taking the derivative of cumulative luminosity function obtained from
| (2) |
Here, is the Heaviside theta function. The lower limit in the mass integral, is decided by the cooling criteria of the gas. In absence of molecular hydrogen and metals, only gas in halos with virial temperature above K can cool and host star formation. Thus we consider corresponds to the halo mass having virial temperature of K (Barkana & Loeb, 2001; Samui et al., 2007). Such halos are usually referred to as ‘atomic cooled halos’.
In our models, in addition to the supernova feedback, we take into account the radiative feedback due to meta-galactic UV background after reionisation and AGN feedback. The former is effective at the low mass end and the later is effective mainly at the high mass end. We assume that in the ionised regions of the universe the star formation is completely suppressed in halos with virial velocity below 35 km/s due to radiative feedback. For halos having virial velocity between 35 km/s to 110 km/s we assume partial suppression in star formation efficiency with a linear fit from 0 to 1 (Bromm & Loeb, 2002; Benson et al., 2002; Dijkstra et al., 2004). In the era prior to the epoch of reionisation the radiative feedback is applied to only galaxies forming in the ionised bubbles. The fraction of such galaxies at any epoch is quantified by the volume filling factor of the ionised bubbles. Here we wish to explore whether the currently available observational data are good enough to constrain the extent to which the radiative feedback is effective. Further, we consider a suppression of star formation in high mass halos due to possible AGN feedback by a factor of (Bower et al., 2006; Best et al., 2006). We also model the reionisation of inter-galactic medium in a self consistent way in order to implement the radiative feedback. See Samui et al. (2007) for details of such models. All our models predict reionisation histories consistent with the Planck’s measured .
3 High redshift luminosity functions
We first present the UV luminosity functions of high redshift galaxies as predicted by our models described in previous section and compare them with the available observations. This will enable us to constrain the parameters of our model and hence the nature of star formation and associated feedback processes at different redshifts. We vary the star formation efficiency, and the dust reddening factor together (i.e. combination) in each redshift to match our model predictions with observed luminosity functions. Note that galaxies with the luminosity range M, are less prone to any of the feedback processes that we consider here. Hence we choose the value of such that the model prediction matches with observation in this luminosity range.
The best fit values of at different redshifts are given in Table 1 for the model with and . It shows a decreasing trend of with decreasing redshifts (Jose et al., 2014, also got similar results albeit using the models without SNe feedback). This could arise either from the decreasing star formation efficiency with time (i.e remains constant) or time evolution in both and . Note that it has been found that dust attenuation can decrease (i.e. decreasing ) with increasing redshifts (Bouwens et al., 2012; Burgarella et al., 2013; Khaire & Srianand, 2015). In order to explore it in more details, we use the fitting formula as obtained by Khaire & Srianand (2018, Eqn. 15) to calculate the dust opacity () at different redshifts. Using that we calculate the from the fitted values of . However, it should be noted that this is not the total star formation efficiency as used in literature. Rather, it determines . In Table 1 we provide the value of at halo masses (also mentioned in 2nd row of the table) for which . This indicates that the total mass converted into stars also decreases with decreasing redshift. Below we provide a detailed comparison of our predicted luminosity functions with observations at different redshifts.
| 8 | 7 | 6 | 5 | 4 | 3 | 2.5 | 1.9 | 1.5 | |
| 0.756 | 0.574 | 0.397 | 0.330 | 0.250 | 0.144 | 0.140 | 0.075 | 0.057 | |
| 1.54 | 1.67 | 1.86 | 2.16 | 2.68 | 3.67 | 4.48 | 5.76 | 6.64 | |
| 2.4 | 2.9 | 3.6 | 4.5 | 5.9 | 8.2 | 10.0 | 13.1 | 16.2 | |
| 0.58 | 0.48 | 0.37 | 0.35 | 0.33 | 0.26 | 0.31 | 0.22 | 0.19 | |
| † Calculated using Eqn. 15 of Khaire & Srianand (2018). | |||||||||
| ‡ Mass in unit of M⊙ for which km/s. | |||||||||
| § Ratio of stellar to baryon mass for halos with . | |||||||||
3.1 UV Luminosity functions at


We begin by comparing our model predictions with observations at , 7 and 6 (see Fig. 1) when HI in the universe is expected to transit from neutral to ionised state (i.e. going through the final stages of HI reionisation). For each redshift we show predicted luminosity functions from five different models. The dotted curves represent the luminosity functions obtained for the model without the supernova feedback in star formation (i.e. ). However, this model includes radiative feedback. It is clear from the figure that in all three redshifts, such a model over predicts the observed number count of galaxies in low luminosity end, M. Thus the radiative feedback alone is not enough to reproduce the observed shape of the luminosity function at low luminosity end. Further note that given the small value of from CMBR data one would expect to have less than 10% of the universe to be ionised at and indeed we verify that in our self consistent reionisation models as well. Hence, at the radiative feedback would be expected to affect the luminosity function by at most 10%. Thus the small suppression due to reionisation feedback is not enough to explain the shape of observed luminosity functions at low luminosity end in these redshifts and this is almost insensitive to the model of ionisation feedback that one assumes. Further, note that there is a turn over seen in the predicted luminosity functions at M for this model. This turn over arises due to the atomic cooling cut off in star formation of halos with virial temperature less than K and comes within the observed luminosity range at . It is also independent of reionisation model. In absence of such turn over in the observational data, we conclude that only radiative feedback alone can not explain both the shape and extent of UV luminosity functions. Therefore, we need additional feedback other than the radiative feedback to explain the observation.
Indeed, we show that the SNe feedback model leads to correct shape of the UV luminosity functions. In Fig. 1, we show luminosity functions predicted by energy driven supernova feedback models (i.e. ) with (solid curves) and (dot-dot-dashed curves). We also show model predictions for momentum driven supernova feedback models (i.e. ) with (dotted dashed curves) and (dashed curves). With such feedbacks, the atomic cooling turn over got shifted to even lower luminosity as the same galaxy would have become fainter due to the feedback. This has also reduced the number counts of galaxies with M, required by the observations. Thus we can say that the new faint end luminosity data clearly shows the SNe feedback in action in the redshift range .
Further, the faint end luminosity functions can in principle be used to constrain the nature of supernova feedback and duration of star formation activity. We see from Fig. 1 that each models predict distinct luminosity functions for M. Both the atomic cooling turn over and amplitude of luminosity functions are different for different models. Although, the observations at and 8 are not yet accurate enough to distinguish between models, the redshift observation can. The atomic cooling turnover for and model arises at brighter luminosity compare to model. At , such turn over is expected to appear at M for model.
Note that there are discrepancies of observed luminosity functions as analysed by different groups, especially in the uncertainty of the very faint end of the luminosity function (see Bouwens et al., 2017b, for a detailed discussion). In Fig. 1, we show results from Bouwens et al. (2017b) (open pentagons) as well as from Livermore et al. (2017)(open diamonds). The discrepancy is clear in the figure. While the data from Livermore et al. (2017) prefers model, the Bouwens et al. (2017b) data favours model (along with ). Thus once the observational debate is settled we will be able to constrain the duration of star formation activities in those high redshift galaxies. In passing we mention that lower redshift observation favours a model (see below). Note that with such values of , a galaxy is expected to have active star formation for a longer period and thus one would not expect to see the passively star forming galaxies at higher redshifts. We will discuss this in detail later.
Further, it is clear from the Fig. 1 that our models provide good fit to the observational data of Ono et al. (2018) in the high luminosity range (i.e. ) where AGN feedback is important in deciding the shape of the luminosity functions. Thus, the AGN feedback model that we adopted here is adequate to explain the observational data. We return to discussions on the importance of AGN feedback at different redshifts in Section 3.2.
Therefore, we see that our star formation model including energy driven outflow feedback by SNe in star formation (i.e. ) with explains shape and the redshift evolution of observed UV luminosity function of galaxies over a wide luminosity range from to . We call this model as our fiducial model and will show next that this model can also reproduce the observed luminosity functions at lower redshifts.
3.2 Post reionisation period:
We now turn into the post reionisation era as the quasar spectrum confirms the end of reionisation by . Note that for these redshifts we do not have very faint end luminosity functions from the gravitational lensing measurements to put tight constraints on the nature of the star formation. Here we just show that our fiducial model provides good fit to the available data. Future observations of the faint galaxies would confirm our predictions.
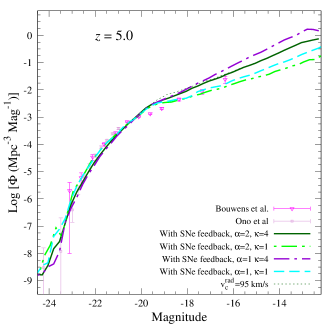
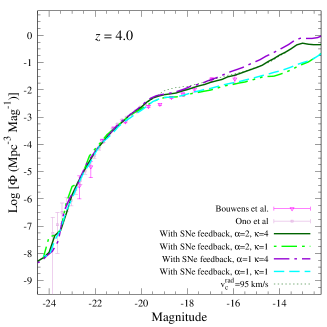

Fig 2 shows our model predictions and compare them with the observed data. It is evident from these figures that difference between the model predictions are larger at M where the observations are sparse at present. Interestingly none of our models predict turn over of the faint end slope of the luminosity functions down to M in these redshifts as well. The predictions of SNe feedback models with and (solid curves) match very well with the observed data points. Moreover, at they predict even an increase in the faint end slope at M. We will show later that this enhancement is coming from the galaxies that are currently evolving with the passive mode of star formation (i.e. Fig. 5) and indeed been observed at even lower redshifts (see Fig. 4). Thus we predict that the next generation telescopes which can observe very faint galaxies will see this extended faint end luminosity functions upto M at and an enhancement in the number counts of faint galaxies with M at if passive galaxy population contributes to the observed luminosity functions at these redshifts as they do at low-.
Further, we can infer from Fig. 2 that observations at these redshifts can also constrain the halo mass upto which the radiative feedback is effective. The break seen in the observed luminosity functions at M is created by the radiative feedback as predicted by our models that assume such feedback is operating upto haloes of circular velocity 110 km/s. Models that assume a radiative feedback in halos with virial velocity less than 95 km/s (dotted curves in Fig. 2) clearly over predict the observed luminosity functions. Thus even more massive systems are prone to the ionisation feedback compared to what has been found in numerical simulations (Thoul & Weinberg, 1996). Similar results were obtained by Jose et al. (2014) as well.
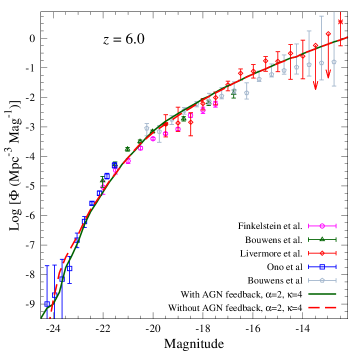

Finally we show that the observed data points at high luminosity end (i.e. M) can indeed show the signature of AGN feedback. In the lower panel of Fig. 3 we have plotted the observed luminosity function at along with predictions from two models: (i) with AGN feedback (solid line) (ii) without AGN feedback (dashed line). It is clear that the model which does not consider the AGN feedback over predicts the number counts of galaxies in the luminosity range M. Only the model considering AGN feedback explains the observed number counts of galaxies. In passing we note that the difference between the predictions of the models with and without AGN feedback increases with decreasing redshifts. In Fig. 3 the requirement of AGN feedback is more clearly demonstrated for compared to that for . At the effect of AGN feedback is small and lies within the uncertainty of presently available observations (top panel of Fig. 3).

3.3 Late universe:
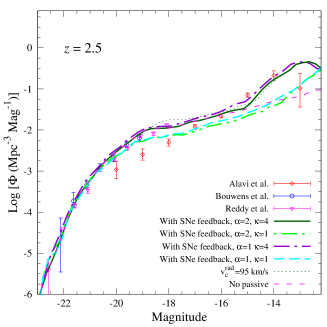
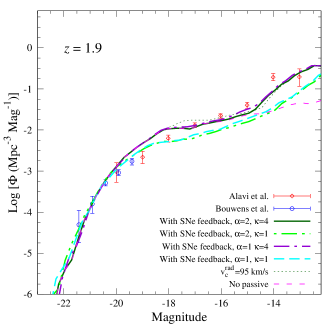
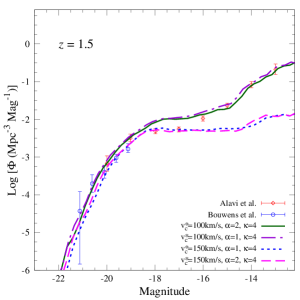
Now we discuss luminosity functions at even lower redshifts (, 1.9 and 1.5) where Alavi et al. (2016) provide measurements upto very faint end of M. In these redshifts also the observed UV luminosity functions of galaxies do not show any turn over upto a magnitude limits of M. Moreover, they show an increase in the slope of the luminosity functions at M. Thus it is interesting to see if the star formation models that are successful in describing the high redshift universe also able to explain the low redshifts counterparts.
Indeed we see in Fig. 4 that the same fiducial model of star formation provides good fit to the observational data for all three redshift bins and in the entire luminosity range (the solid lines in Fig. 4). Like the other higher redshift bins, prolonged star formation mode (i.e. ) is favoured compared to a burst mode (i.e. ) at these epochs as well. However, we can not constrain the nature of supernova feedback (i.e the choice of ) in these redshifts as luminosity functions predicted by models with different for a given differ very little.
The most striking feature at these redshifts is the very faint end luminosity function (i.e. magnitude ) where there is an enhancement in the observed number density of faint galaxies. Some of our models indeed reproduce such enhancement. A detailed investigation reveals that such an enhancement in our models is mainly due to the older generations of galaxies that are exhibiting the slow passive mode of star formations. This can be understood as follows. In Fig. 4 we also show the model predictions that do not consider this passive star formation by the magenta dashed lines. Clearly in such models the luminosity functions are much flatter than the observed ones and under predict the number counts of galaxies of faint magnitude M in all three redshift bins. Only models that consider the passive slow mode of star formation would be able to explain the number counts of faint galaxies at these redshifts. Note that the faint end turn over as predicted by our models now occurs at M in these redshifts and future observations extending to such low luminosities are likely to detect it.
To show the effect of this passive mode of star formation in different redshifts we have plotted the break up of luminosity functions contributed by the galaxies with ongoing active star formation and passively star forming galaxies in Fig. 5.

In all redshift bins we also show contributions arising from galaxies with different mass ranges. The contributions by the active star forming galaxies are shown by different color dotted lines whereas the same for the passively star forming galaxies are shown by the solid curves. From the figure is it clear that in high redshifts i.e. the faint end luminosity functions are still contributed by the active star forming galaxies with masses in the range . The universe is not old enough at these redshifts to have evolved galaxies that are going through the passive slow mode of star formation. Further, the new observations by Livermore et al. (2017) using the gravitational lensing magnifications are detecting dwarf galaxies with masses at . These galaxies contribute most to the UV photon budget for the reionisation. In redshift range the observations are upto M and only the active star forming galaxies of masses contribute to the observed galaxies. Future observations extending to fainter magnitude are likely to detect these passive star forming galaxies at those redshifts.
Only in redshift range where the observed luminosity functions extend to as faint as M we see the contribution from the passively star forming galaxies of masses with magnitude M. The higher luminosity range is contributed by the actively star forming galaxies with mass range at . Thus we can say that the gravitational lensing measurements enable us to probe small mass galaxies that are evolving passively at these redshifts. These are the counterparts of local red sequence galaxies.
3.4 Dependence on model parameter
In previous sub-sections we have demonstrated the importance of SNe feedback in understanding the shape, extent and the redshift evolution of the UV luminosity function of galaxies. Here we discuss the effect of the parameter that governs the level of SNe feedback on the luminosity function. In Fig. 6 we have shown predicted luminosity functions with models having km/s (dotted black lines for and magenta small dashed lines for ) along with two other models that were discussed in previous sections (with km/s). We show luminosity functions only for three representative redshifts, , 4 and 1.5. It is clear from the figure that even though models with km/s are degenerate at the level of observational uncertainty with our fiducial model at , the difference becomes more and more as we come to lower and lower redshifts. At redshift the observations clearly rule out possibility of having a higher . Note that Samui et al. (2010) obtained km/s for outflows driven by both hot gas and cosmic rays.


4 Discussions and Conclusions
Over the past decade we have been developing semi-analytical models of galaxy formation which start from the abundance of dark matter halos, include a simple prescription for star formation and different feedback processes to predict various observed properties of high- galaxies. In particular our models predict some specific observational signatures: (i) turn over in the low luminosity end of the LF due to cooling criteria adopted, (ii) faint end slope of the LF that depends on the SNe feedback and radiative feedback from the meta-galactic UV background, and (iii) bright end slope of the LF dominated by the AGN feedback. All our models are tuned to satisfy the reionization constraints obtained from CMB and Lyman- forest observations.
Latest advancements in observations now provide UV luminosity functions of high- galaxies over a large luminosity range and allow us to check the above mentioned predictions. In this paper we have compared the latest measurements of the UV luminosity functions at different epochs (i.e ) with the predictions of our semi-analytical galaxy formation models and draw the following conclusions.
-
•
In order to reproduce the observed redshift evolution of the LF, our models require the parameter, , to decrease with decreasing redshifts. By using the observed redshift evolution of UV extinction parameter, AFUV, to constrain we conclude that the conversion efficiency of gas into stars is decreasing with decreasing redshift.
-
•
We show that SNe feedback is important even at to reproduce the observed low end of the LF. Radiative feedback alone will not be sufficient to reproduce the observations. We show precise measurements of LF in future will enable us to distinguish between different modes of SNe feedback (i.e momentum or energy driven wind feedback), duration of the star formation () and circular velocity scale () where we normalise the mass outflow rate. Our best fit models that consider star formation only in the “atomic cooled halos” predict a turn over in the low end of the LF of high- galaxies (i.e ) at M. This is much below the limit reached by present day observations. At these redshifts, our models also produce the LF in the high luminosity end very well even when AGN feedback is not included.
-
•
Our models with the above noted redshift evolution in reproduce the observed LF at the intermediate redshifts () very well. We also present our model predictions at the low luminosity end that is not yet probed by the present observations. In particular, the presence of a passive mode of star formation in our models predicts excess of galaxies at low luminosity end. Detecting such an excess will allow us to place constraints on such a slowly evolving populations at high-. In this redshift range in order to reproduce the LF at high luminosity end we do need AGN feedback.
-
•
The observed luminosity functions at low- (i.e ) show an upward turn at . This part of the LF in our models is produced by galaxies exhibiting slow passive mode of star formation. It will be possible to confirm this by a detailed SED fitting of the multiband photometric data of these galaxies. In our models, these galaxies typically have halo masses in the range . Further we find the characteristic velocity () at which the mass loading factor can be constrained using the LF.
In summary, we show that the observed luminosity functions in the entire redshift range consider here i.e. show signature of galaxies going through the prolonged slow mode of star formation in addition to star bursting galaxies. We also demonstrate that deep observations of faint galaxies at high redshift will enable us to probe the nature of feedback such as momentum/energy driven flow, mass range over which the radiative feedback is effective, normalization of mass outflow rates and nature of galaxies going through passive mode of star formation. At present one is able to detect faint galaxies thanks to the gravitational lensing by the foreground clusters. However, the luminosity function derived using this technique suffers from systematic uncertainties associated with the lens modelling of the system. This will be removed once we get direct observations of faint galaxies using future large observing facilities like JWST, TMT and ELT.
Acknowledgements
SS thanks IUCAA for its support through associateship programme.
References
- Alavi et al. (2016) Alavi A., et al., 2016, ApJ, 832, 56
- Barkana & Loeb (2001) Barkana R., Loeb A., 2001, Phys. Rep., 349, 125
- Benson et al. (2002) Benson A. J., Lacey C. G., Baugh C. M., Cole S., Frenk C. S., 2002, MNRAS, 333, 156
- Best et al. (2006) Best P. N., Kaiser C. R., Heckman T. M., Kauffmann G., 2006, MNRAS, 368, L67
- Bouwens et al. (2012) Bouwens R. J., et al., 2012, ApJ, 754, 83
- Bouwens et al. (2015) Bouwens R. J., et al., 2015, ApJ, 803, 34
- Bouwens et al. (2017a) Bouwens R. J., Illingworth G. D., Oesch P. A., Atek H., Lam D., Stefanon M., 2017a, ApJ, 843, 41
- Bouwens et al. (2017b) Bouwens R. J., Oesch P. A., Illingworth G. D., Ellis R. S., Stefanon M., 2017b, ApJ, 843, 129
- Bower et al. (2006) Bower R. G., Benson A. J., Malbon R., Helly J. C., Frenk C. S., Baugh C. M., Cole S., Lacey C. G., 2006, MNRAS, 370, 645
- Bromm & Loeb (2002) Bromm V., Loeb A., 2002, ApJ, 575, 111
- Burgarella et al. (2013) Burgarella D., et al., 2013, A&A, 554, A70
- Choudhury & Ferrara (2006) Choudhury T. R., Ferrara A., 2006, MNRAS, 371, L55
- Corasaniti et al. (2017) Corasaniti P. S., Agarwal S., Marsh D. J. E., Das S., 2017, Phys. Rev. D, 95, 083512
- Dekel & Mandelker (2014) Dekel A., Mandelker N., 2014, MNRAS, 444, 2071
- Dekel et al. (2013) Dekel A., Zolotov A., Tweed D., Cacciato M., Ceverino D., Primack J. R., 2013, MNRAS, 435, 999
- Dijkstra et al. (2004) Dijkstra M., Haiman Z., Rees M. J., Weinberg D. H., 2004, ApJ, 601, 666
- Dijkstra et al. (2007) Dijkstra M., Wyithe J. S. B., Haiman Z., 2007, MNRAS, 379, 253
- Fan et al. (2006) Fan X., et al., 2006, AJ, 131, 1203
- Finkelstein et al. (2015) Finkelstein S. L., et al., 2015, ApJ, 810, 71
- Finlator et al. (2017) Finlator K., et al., 2017, MNRAS, 464, 1633
- Gnedin (2008) Gnedin N. Y., 2008, ApJ, 673, L1
- Hopkins et al. (2012) Hopkins P. F., Quataert E., Murray N., 2012, MNRAS, 421, 3522
- Jose et al. (2011) Jose C., Samui S., Subramanian K., Srianand R., 2011, Phys. Rev. D, 83, 123518
- Jose et al. (2013) Jose C., Subramanian K., Srianand R., Samui S., 2013, MNRAS, 429, 2333
- Jose et al. (2014) Jose C., Srianand R., Subramanian K., 2014, MNRAS, 443, 3341
- Khaire & Srianand (2015) Khaire V., Srianand R., 2015, ApJ, 805, 33
- Khaire & Srianand (2018) Khaire V., Srianand R., 2018, preprint, (arXiv:1801.09693)
- Khaire et al. (2016) Khaire V., Srianand R., Choudhury T. R., Gaikwad P., 2016, MNRAS, 457, 4051
- Livermore et al. (2017) Livermore R. C., Finkelstein S. L., Lotz J. M., 2017, ApJ, 835, 113
- Madau & Haardt (2015) Madau P., Haardt F., 2015, ApJ, 813, L8
- Menci et al. (2016) Menci N., Grazian A., Castellano M., Sanchez N. G., 2016, ApJ, 825, L1
- Mitra et al. (2015) Mitra S., Choudhury T. R., Ferrara A., 2015, MNRAS, 454, L76
- Ono et al. (2018) Ono Y., et al., 2018, PASJ, 70, S10
- Planck Collaboration et al. (2016a) Planck Collaboration et al., 2016a, A&A, 594, A13
- Planck Collaboration et al. (2016b) Planck Collaboration et al., 2016b, A&A, 596, A108
- Reddy & Steidel (2009) Reddy N. A., Steidel C. C., 2009, ApJ, 692, 778
- Robitaille & Whitney (2010) Robitaille T. P., Whitney B. A., 2010, ApJ, 710, L11
- Samui (2014) Samui S., 2014, New A, 30, 89
- Samui et al. (2007) Samui S., Srianand R., Subramanian K., 2007, MNRAS, 377, 285
- Samui et al. (2008) Samui S., Subramanian K., Srianand R., 2008, MNRAS, 385, 783
- Samui et al. (2010) Samui S., Subramanian K., Srianand R., 2010, MNRAS, 402, 2778
- Samui et al. (2018) Samui S., Subramanian K., Srianand R., 2018, MNRAS, 476, 1680
- Sheth & Tormen (1999) Sheth R. K., Tormen G., 1999, MNRAS, 308, 119
- Somerville & Davé (2015) Somerville R. S., Davé R., 2015, ARA&A, 53, 51
- Thoul & Weinberg (1996) Thoul A. A., Weinberg D. H., 1996, ApJ, 465, 608
- Yue et al. (2016) Yue B., Ferrara A., Xu Y., 2016, MNRAS, 463, 1968
- van den Bosch et al. (2008) van den Bosch F. C., Aquino D., Yang X., Mo H. J., Pasquali A., McIntosh D. H., Weinmann S. M., Kang X., 2008, MNRAS, 387, 79