Vortical amplification of magnetic field at inward shock of supernova remnant Cassiopeia A
Abstract
We present an interpretation of the time variability of the -ray flux recently reported from a multi-epoch campaign of years observations of the supernova remnant Cassiopeia A by Chandra. We show for the first time quantitatively that the keV non-thermal flux increase up to traces the growth of the magnetic field due to vortical amplification mechanism at a reflection inward shock colliding with inner overdensities. The fast synchrotron cooling as compared with shock-acceleration time scale qualitatively supports the flux decrease.
pacs:
Valid PACS appear hereTime variability of -ray flux of supernova remnants enables to probe magnetohydrodynamic dynamo processes and particle acceleration at collisionless shocks (Reynolds, 2008). Laboratory astrophysics experiments have identified a dynamo mechanism amplifying magnetic fields at shock waves (Meinecke et al., 2014); however, direct astrophysical observations have been lacking.
A year-scale time variability in the -ray filaments, or knots, of the supernova remnant Cassiopeia A was associated (Uchiyama and Aharonian, 2008) with a fast synchrotron cooling in strong magnetic field; a decline of the -ray flux between and was observed with Chandra in the entire remnant’s western limb Patnaude et al. (2011). Recent high spatial resolution multi-epoch observations of Cassiopeia A have shown unprecedented evidence of an increase followed by a decrease of -ray flux ( keV band) up to in six distinct regions approximately or in size located on the west side and toward the center of the remnant (Sato et al., 2018); such observations cover a time period of years (from to ). The location of those regions is consistent with a high speed shock observed to move inward. Due to the young age of the remnant, such a shock is unlikely to correspond to the reverse shock, that would move outward at such evolution stage, and plausibly originated as a reflection from the collision of the forward shock with an interstellar medium molecular cloud; such a scenario was modelled in an earlier work Sgro (1975). As a result of such reflection, the inward shock surface is likely to be corrugated to the scale of the molecular cloud.
In this paper we show for the first time that the overdensity clumps within the expanding plasma of Cassiopeia A, once crossed by the reflection inward shock, lead to the keV flux increase via magnetic field amplification through vorticity generation, as calculated in Fraschetti (2013). Such a process was first identified via two-dimensional magnetohydrodynamic (MHD) numerical simulations in Giacalone and Jokipii (2007) and also investigated by several teams, including Inoue et al. (2012).
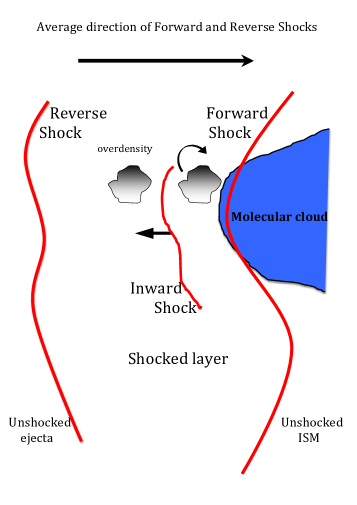
Figure 1 depicts a cartoon illustration of the scenario envisaged: the corrugated inward shock travels through the shocked layer, i.e. the hot plasma region between the forward and reverse shock, and therein collides with density clumps thereby generating vorticity and amplifying the magnetic field in the downstream fluid. The non-linear field amplification is accounted for analytically within the MHD approximation (Fraschetti, 2013). The clumps might have originated in the supernova explosion itself (see, e.g., 3D simulation in Müller et al. (2017)) or from Rayleigh-Taylor instabilities triggered within the shocked layer as numerically determined in Refs. Chevalier, Blondin, and Emmering (1992); Blondin and Ellison (2001); Fraschetti et al. (2010). For the six regions within Cassiopeia A the speeds of the inward shocks, if propagating into the shocked layer rest frame (Fig. 1), are inferred (Sato et al., 2018) to be in the range kms.
The time evolution of the turbulent amplified magnetic strength is determined analytically. The induction equation for is coupled with fluid equations to determine the MHD jump conditions at two-dimensional, i.e., corrugated, shock fronts; the vorticity generated behind the shock is related to via the small-scale dynamo process Kulsrud and Anderson (1992) leading to (from Fraschetti (2013), Eq. therein)
| (1) |
where is the upstream seed magnetic strength and
| (2) |
is the growth time-scale determined by the shock compression , the curvature radius of the ripples on the forward shock surface that is expected to be comparable with the size of the overdensity clumps, the thickness of the outer clump layer where the density gradient is non-vanishing (corresponding to the Field length in the ISM) and the shock speed in the upstream frame ; describes the field back-reaction to the whirling of the fluid and is the seed field Alfvén speed. As calculated in detail in Fraschetti (2013), the -amplification occurs within the outer layer of thickness .
In this letter, we consider the region W3 only, according to the labelling in Sato et al. (2018), that, along with the region W1, is least affected by thermal contamination, thereby allowing a better determination of the non-thermal flux. The flux increase in the other regions (C1, C2, W1, W2, W4) moving at speeds Sato et al. (2018) different from W3 is arguably produced by the vortical amplification as well, with possibly different local best-fit values of and to be determined in a forthcoming work.
It is reasonable to assume that the non-thermal emission arises from synchrotron radiation of a population of energetic electrons in a strong and time-varying magnetic field . For simplicity, we assume that over a sufficiently small interval of electron Lorentz factor (where is the electron rest energy), the differential energy distribution of the energetic electrons can be approximated with a simple power-law: , where is the injection electron Lorentz factor and the index is determined by the shock compression only, as predicted by the linear test-particle version of the diffusive shock acceleration model. It has been shown recently (Fraschetti and Pohl, 2017) that the baseline spectrum of the Crab nebula between radio and multi-TeV can result from a single log-parabola electron distribution, instead of commonly used multiple power-laws. However, within the narrow photon energy range considered here ( keV), the emission spectrum from a log-parabola does not significantly depart from a power-law; thus, we choose the latter as an acceptable approximation.
Flux increase - The synchrotron power emitted by a single electron, averaged over an isotropic electron distribution, is given in the local plasma frame by , where is the Thomson cross-section and speed of light in vacuum. The total synchrotron flux at Earth from a source at distance , namely , is found by folding with the differential energy distribution of the electrons: . We use the monochromatic approximation, i.e., the electron power is concentrated around the characteristic synchrotron energy , where is the electron charge and is the Planck constant. Thus, the total flux observed at Earth, i.e., , can be recast as
| (3) |
where is a constant.
We reproduce in Fig. 2, upper panel, the observed flux change in the range keV compared with the theoretical prediction (from Eq. 3) for keV, kpc and for distinct values of . We emphasize that , , and (hence ) are inferred from observations(Sato et al., 2018), and are not tuned here for data-fitting purpose. The model of the flux increase depends only on two fitting parameters, and . The best-fit values for the time-interval are
| (4) |
The error bars on and are likely dominated by the uncertainty on the exponential rise. In addition, the data-point belongs to the incipient decrease phase of the flux, hence is not accounted for by our analytic model.

Figure 2, lower panel, depicts the amplification of the magnetic strength during the same time interval and for the same parameters as the upper panel. We show that the growth of extends beyond the flux maximum. However, this does not need to be the case and the growth of might be hampered in the deep downstream medium. We do not consider in this short letter such a possibility.
The Chandra observations of the -ray flux increase (Sato et al., 2018) are consistent with a scenario of an inward shock travelling into a hot plasma with electron temperature keV(see also Hwang and Laming (2012)), in equilibrium with ions: low ion temperature is favoured by the narrow lines in some bright knots within the remnant Lazendic et al. (2006), despite not having been measured directly at the inward shock yet. For the W3 inward shock kms in the shocked layer frame, as derived Sato et al. (2018) (table 3) from the proper motion speed kms added to an expansion velocity kms. Thus, for a mono-atomic gas, leading to .
The best-fit values in Eq. 4 are compatible with previously reported observations. The linear size of the W3 box (), capturing only the -ray bright fraction of the extent of the inward shock where -field is amplified (), corresponds to cm at distance . Such size is in good agreement with the best-fit and is consistently smaller than the best-fit (Eq. 4). For the ISM, is not strongly constrained by thermal equilibrium models Field (1965). However, our best-fit is consistent with expectations from thermal conduction models in multi-phase media, (see Ref Begelman and McKee (1990), Eq. 5.1 and section V, b) therein).
We note that Chandra observations set an upper limit of the seed field since the year : in other words the amplification, and the consequent flux increase, is likely to be have begun prior to by the same mechanism from a smaller , although high-resolution observations of previous epochs are not available. Our best-fit yields a growth time-scale (Eq. 2) yr, whereas the Chandra observations captured only years of the flux increase (from to ). We note that is appreciably longer than the time scale variation of -ray brightness in extreme cases previously reported, e.g., RX J from Uchiyama et al. (2007) or in cases of very high Mach number shocks (Fraschetti, 2013).
Flux decrease - As an approximate marker of the peak, occurring in for W3, we can use the ratio of the synchrotron cooling time scale, , to the acceleration time-scale, . By using a reference value for Cassiopeia A, , where ., Sato et al. (2018) find years for the region W3. For an electron of Lorentz factor emitting synchrotron power at a typical photon energy in an ambient downstream magnetic field we have
| (5) |
where and . Equation 5 is equivalent to Eq. 5 in Ref [Sato et al. (2018)], where is taken as constant, with ( being the electron energy in TeV and the typical value of is consistent with the value of chosen here).
At , the value yrs yields at a time the field , in the expected range for Cassiopeia A, as discussed in Ref. (Uchiyama and Aharonian, 2008). The best-fit -field (solid line in the lower panel in Fig. 2) shows a ratio that leads to , with . Such a relatively high confirms that an amplification in W3 likely took place at the inward shock prior to year , possibly via vorticity generation within the shocked layer due to the corrugation of the inward shock or an alternative mechanism.
The acceleration time-scale can be approximated by(Parizot et al., 2006)
| (6) |
where, for an isotropic upstream turbulence, is the diffusion coefficient at the electron cut-off energy and is along the average direction of shock motion and , assumed Parizot et al. (2006) to be equal upstream and downstream, is given by , where is the Bohm diffusion coefficient at that energy. The departure from unity of , both () for shocks close to quasi-parallel (or quasi-perpendicular) topology within the acceleration region, indicates that the turbulence is not dominant over the seed field (Fraschetti and Giacalone, 2012). Finally, the upstream field, constant in time as the amplification occurs downstream in the model presented here for the flux increase (plasma kinetic instabilities are neglected), is given by and km/s). We note that Eq. 6 is equivalent to Eq. 6 in Ref [Sato et al. (2018)] with const. For the current speed , in region W3 we estimate from Eq. 3 in Ref [Sato et al. (2018)]; for , Eq. 6 provides at present years, significantly greater than years. A cooling faster than the acceleration is consistent with the observed flux decrease. More sophisticated models for the diffusion coefficient (e.g., Giacalone (2013), Fraschetti and Jokipii (2011) will not substantially change this qualitative argument (see next Section).
We emphasize that is time-variable unlike what is customarily assumed: it shortens as increases (see Eq. 5). Here is the downstream field, amplified after the shock crossing, as described in Eq. 1. Thus, in the early phase of the Chandra observations () or earlier, was much greater: from Eq. 5, at yields yr, comparable to . On the other hand, electrons need time to be accelerated up to the TeV before cooling on the scale. As a result, an early-on cooling will not affect the electrons spectrum.
Discussion - We have presented the first quantitative theoretical model based on ideal MHD and small-scale dynamo downstream of shocks to explain the -ray flux increase at a Cassiopeia A inward shock. We have provided an argument based on the ratio of cooling and acceleration times in support of the observed flux decrease. It is natural to inquire whether exceeds during the flux increase, as one could expect. By using the values observed/inferred (, , and ) and determined from our best-fit of the flux increase (), the ratio of Eq. 6 to Eq.5 leads to also prior to , at odds with expectations. This should not be surprising as current values of observables are used that can lead to a significant over-estimate of in the flux increase phase, as discussed below.
The use of as criterion to determine the flux variability requires further discussion. The determination of is very sensitive to , where is the electron cut-off energy (see Eq. 3 in Ref. [Sato et al. (2018)] or Eq. 5 in Ref.[Patnaude et al. (2011)]). However, the uncertainty on alone, dominated by the coarse spatial resolution of NuSTAR, seems insufficient to justify the large ratio . Grefenstette et al. (2015) reports keV (or keV) for the reverse (or forward) shock region whereas an unlikely larger value ( keV), with other parameters unchanged, would be required to satisfy the condition .
Speculative arguments to justify during the flux increase involve also a temporal variation of the fitting parameters that have been assumed constant throughout this work and in Ref. [Sato et al. (2018)]. For instance, the shock speed in the acceleration region likely decreased during the collision with the overdensity. At constant , the relation implies that a greater would reduce (Eq. 6), with unchanged, only by requiring a greater . On the other hand, might vary in time due to the growth of the magnetic turbulence and approach unity from above (below) for a quasi-parallel (quasi-perpendicular) magnetic topology(Fraschetti and Giacalone, 2012). So far we have considered values of . However, an intrinsic value or in a region magnetically connected with the Chandra non-thermal bright inward shock could also lead to a production of TeV electrons that would migrate a short distance before cooling by synchrotron radiation; such a would also enable a . At present we cannot disprove either magnetic topology. Thus, the observational uncertainties cannot rule out during the flux increase.
The flux decrease could have a different origin: the damping of the turbulent -field downstream of the inward shock, e.g., due to non-linear wave interactions(Pohl, Yan, and Lazarian, 2005), instead of energy losses of radiating electrons. The resulting flux decrease is expected to be achromatic from the radio to the hard -ray spectrum. We will investigate such effect in a forthcoming work. Another possible origin of the flux decrease is that the overdensity begins to disrupt at the peak, as is not negligible as compared to the shock crossing time . This effect will be accounted for in future numerical simulations.
We note that two alternative scenarios for the inward shock location are suggested by Sato et al. (2018) to explain the non-thermal emission, i.e., propagation through the unshocked ejecta or through the shocked layer with ion temperature keV, out of equilibrium with electrons. In both scenarios Eq. 1 would result in throughout, at odds with the flux decrease. Moreover, in the latter scenario, the best-fit parameters are consistent with those in the case of ion/electron equilibrium at keV: . However, the smaller compression () would steepen the electron spectrum () making it unlikely to accelerate up to TeV to produce the observed -rays. The former scenario would require the presence of a second molecular cloud in the unshocked ejecta, beside the outer cloud that generates the inward shock. The maps from the Heinrich Hertz Submillimeter Telescope (Sato et al., 2018) with velocity kms, reveal molecular clouds overlapping, in projection, to the innermost parts of the remnant, within the putative position of the reverse shock. In this case the relative speed of the inward shock colliding with the second cloud in region W3 would be km/s (see Ref [Sato et al. (2018)], table 3). A value cm, with unchanged , would still lead to yrs. However, observations do not allow to clearly single out such a molecular cloud; thus, we do not consider such a scenario.
Conclusion - We have shown that the -ray flux increase between years and in a small region in the west limb of Cassiopeia A can trace the enhancement of the magnetic field due to vortical amplification as formerly proposed. The scaling of the saturation value with the Alfvén Mach number in the upstream fluid is simply given(Fraschetti, 2013) by . The low speed of the inward shock in the hot ejecta and the high value of jointly lead to a relatively low , i.e., for a reasonable value of thermal proton density ( cm-3 leads to km/s); thus, only a modest field amplification can be observed. Values of the diffusion coefficient departing from the Bohm limit, that indicate relatively weak turbulence around the shock, are also consistent with the inferred modest field amplification. We have provided a qualitative argument but not a firm theoretical model for the flux decrease between years and . Further analysis is warranted and high-resolution follow-up monitoring of the region W3 is encouraged. This work demonstrates for the first time that the unfolding of a dynamo process formerly theoretically identified can be not only investigated in laboratory plasma astrophysics but also observed in astrophysical systems.
Acknowledgements.
We thank the referees for useful feedback. FF acknowledges very helpful discussions with J. Raymond. The work of FF was supported, in part, by NASA under Grant NNX15AJ71G. This work was partly supported by the Japan Society for the Promotion of Science KAKENHI grant numbers 16K17673 (SK), and partly by Leading Initiative for Excellent Young Researchers, MEXT, Japan.References
- Reynolds (2008) S. P. Reynolds, “Supernova Remnants at High Energy,” Annual Review Astronomy & Astrophysics 46, 89–126 (2008).
- Meinecke et al. (2014) J. Meinecke, H. W. Doyle, F. Miniati, A. R. Bell, R. Bingham, R. Crowston, R. P. Drake, M. Fatenejad, M. Koenig, Y. Kuramitsu, C. C. Kuranz, D. Q. Lamb, D. Lee, M. J. MacDonald, C. D. Murphy, H.-S. Park, A. Pelka, A. Ravasio, Y. Sakawa, A. A. Schekochihin, A. Scopatz, P. Tzeferacos, W. C. Wan, N. C. Woolsey, R. Yurchak, B. Reville, and G. Gregori, “Turbulent amplification of magnetic fields in laboratory laser-produced shock waves,” Nature Physics 10, 520–524 (2014).
- Uchiyama and Aharonian (2008) Y. Uchiyama and F. A. Aharonian, “Fast Variability of Nonthermal X-Ray Emission in Cassiopeia A: Probing Electron Acceleration in Reverse-Shocked Ejecta,” The Astrophysical Journal Letters 677, L105 (2008), arXiv:0803.3410 .
- Patnaude et al. (2011) D. J. Patnaude, J. Vink, J. M. Laming, and R. A. Fesen, “A Decline in the Nonthermal X-ray Emission from Cassiopeia A,” The Astrophysical Journal Letters 729, L28 (2011), arXiv:1012.0243 [astro-ph.HE] .
- Sato et al. (2018) T. Sato, S. Katsuda, M. Morii, A. Bamba, J. P. Hughes, Y. Maeda, M. Ishida, and F. Fraschetti, “X-Ray Measurements of the Particle Acceleration Properties at Inward Shocks in Cassiopeia A,” The Astrophysical Journal 853, 46 (2018), arXiv:1710.06992 [astro-ph.HE] .
- Sgro (1975) A. G. Sgro, “The collision of a strong shock with a gas cloud - A model for Cassiopeia A,” The Astrophysical Journal 197, 621–634 (1975).
- Fraschetti (2013) F. Fraschetti, “Turbulent Amplification of a Magnetic Field Driven by the Dynamo Effect at Rippled Shocks,” The Astrophysical Journal 770, 84 (2013), arXiv:1304.4956 [astro-ph.HE] .
- Giacalone and Jokipii (2007) J. Giacalone and J. R. Jokipii, “Magnetic Field Amplification by Shocks in Turbulent Fluids,” The Astrophysical Journal Letters 663, L41–L44 (2007).
- Inoue et al. (2012) T. Inoue, R. Yamazaki, S.-i. Inutsuka, and Y. Fukui, “Toward Understanding the Cosmic-Ray Acceleration at Young Supernova Remnants Interacting with Interstellar Clouds: Possible Applications to RX J1713.7-3946,” The Astrophysical Journal 744, 71 (2012), arXiv:1106.3080 [astro-ph.HE] .
- Müller et al. (2017) B. Müller, T. Melson, A. Heger, and H.-T. Janka, “Supernova simulations from a 3D progenitor model - Impact of perturbations and evolution of explosion properties,” Monthly Notices of the Royal Astronomical Society 472, 491–513 (2017), arXiv:1705.00620 [astro-ph.SR] .
- Chevalier, Blondin, and Emmering (1992) R. A. Chevalier, J. M. Blondin, and R. T. Emmering, “Hydrodynamic instabilities in supernova remnants - Self-similar driven waves,” The Astrophysical Journal 392, 118–130 (1992).
- Blondin and Ellison (2001) J. M. Blondin and D. C. Ellison, “Rayleigh-Taylor Instabilities in Young Supernova Remnants Undergoing Efficient Particle Acceleration,” The Astrophysical Journal 560, 244–253 (2001), astro-ph/0104024 .
- Fraschetti et al. (2010) F. Fraschetti, R. Teyssier, J. Ballet, and A. Decourchelle, “Simulation of the growth of the 3D Rayleigh-Taylor instability in supernova remnants using an expanding reference frame,” Astronomy & Astrophysics 515, A104 (2010), arXiv:1002.5048 [astro-ph.HE] .
- Kulsrud and Anderson (1992) R. M. Kulsrud and S. W. Anderson, “The spectrum of random magnetic fields in the mean field dynamo theory of the Galactic magnetic field,” The Astrophysical Journal 396, 606–630 (1992).
- Fraschetti and Pohl (2017) F. Fraschetti and M. Pohl, “Particle acceleration model for the broad-band baseline spectrum of the Crab nebula,” Monthly Notices of the Royal Astronomical Society 471, 4856–4864 (2017), arXiv:1702.00816 [astro-ph.HE] .
- Hwang and Laming (2012) U. Hwang and J. M. Laming, “A Chandra X-Ray Survey of Ejecta in the Cassiopeia A Supernova Remnant,” The Astrophysical Journal 746, 130 (2012), arXiv:1111.7316 [astro-ph.HE] .
- Lazendic et al. (2006) J. S. Lazendic, D. Dewey, N. S. Schulz, and C. R. Canizares, “The Kinematic and Plasma Properties of X-Ray Knots in Cassiopeia A from the Chandra HETGS,” The Astrophysical Journal 651, 250–267 (2006), astro-ph/0605078 .
- Field (1965) G. B. Field, “Thermal Instability.” The Astrophysical Journal 142, 531 (1965).
- Begelman and McKee (1990) M. C. Begelman and C. F. McKee, “Global effects of thermal conduction on two-phase media,” The Astrophysical Journal 358, 375–391 (1990).
- Uchiyama et al. (2007) Y. Uchiyama, F. A. Aharonian, T. Tanaka, T. Takahashi, and Y. Maeda, “Extremely fast acceleration of cosmic rays in a supernova remnant,” Nature 449, 576–578 (2007).
- Parizot et al. (2006) E. Parizot, A. Marcowith, J. Ballet, and Y. A. Gallant, “Observational constraints on energetic particle diffusion in young supernovae remnants: amplified magnetic field and maximum energy,” Astronomy & Astrophysics 453, 387–395 (2006), astro-ph/0603723 .
- Fraschetti and Giacalone (2012) F. Fraschetti and J. Giacalone, “Early-time Velocity Autocorrelation for Charged Particles Diffusion and Drift in Static Magnetic Turbulence,” The Astrophysical Journal 755, 114 (2012), arXiv:1206.6494 [astro-ph.HE] .
- Note (1) Likewise, in Sato et al. (2018) typical values are yr and yr, with a constant B-field, and again .
- Giacalone (2013) J. Giacalone, “Cosmic-Ray Transport and Interaction with Shocks,” Space Science Reviews 176, 73–88 (2013).
- Fraschetti and Jokipii (2011) F. Fraschetti and J. R. Jokipii, “Time-dependent Perpendicular Transport of Fast Charged Particles in a Turbulent Magnetic Field,” The Astrophysical Journal 734, 83 (2011), arXiv:1104.0955 [astro-ph.HE] .
- Grefenstette et al. (2015) B. W. Grefenstette, S. P. Reynolds, F. A. Harrison, T. B. Humensky, S. E. Boggs, C. L. Fryer, T. DeLaney, K. K. Madsen, H. Miyasaka, D. R. Wik, A. Zoglauer, K. Forster, T. Kitaguchi, L. Lopez, M. Nynka, F. E. Christensen, W. W. Craig, C. J. Hailey, D. Stern, and W. W. Zhang, “Locating the Most Energetic Electrons in Cassiopeia A,” The Astrophysical Journal 802, 15 (2015), arXiv:1502.03024 [astro-ph.HE] .
- Pohl, Yan, and Lazarian (2005) M. Pohl, H. Yan, and A. Lazarian, “Magnetically Limited X-Ray Filaments in Young Supernova Remnants,” The Astrophysical Journal Letters 626, L101–L104 (2005).