Final results on Se double beta decay to the ground state of Kr from the NEMO-3 experiment
Abstract
Using data from the NEMO-3 experiment, we have measured the two-neutrino double beta decay () half-life of 82Se as y under the single-state dominance hypothesis for this nuclear transition. The corresponding nuclear matrix element is . In addition, a search for neutrinoless double beta decay () using 0.93 kg of 82Se observed for a total of 5.25 y has been conducted and no evidence for a signal has been found. The resulting half-life limit of for the light neutrino exchange mechanism leads to a constraint on the effective Majorana neutrino mass of , where the range reflects nuclear matrix element values from different calculations. Furthermore, constraints on lepton number violating parameters for other mechanisms, such as right-handed currents, majoron emission and R-parity violating supersymmetry modes have been set.
1 Introduction
The observation of neutrino oscillations has provided proof that the neutrino has non-zero mass Fukuda:1998mi ; Ahmad:2002jz ; Agashe:2014kda . However the absolute mass of the neutrino and its fundamental Dirac or Majorana nature remain undetermined. Neutrinoless double beta decay () is the only practical way to establish the full lepton number violation required by many grand unification models and if the decay proceeds via a light neutrino exchange mechanism, would be one of the most sensitive probes of absolute neutrino mass Dell'Oro:2016dbc .
The half-life of is given by:
| (1) |
where is the axial-vector coupling constant, is a phase-space factor, is a nuclear matrix element (NME) and is a lepton number violating parameter. In the most commonly discussed mechanism of , the decay proceeds via the exchange of a light Majorana neutrino (, where is the mass of the electron). However, other mechanisms are possible, such as the admixture of right-handed currents in the electroweak interaction, majoron emission and R-parity violating supersymmetry (SUSY). In all mechanisms, violates lepton number conservation and is a direct probe of physics beyond the Standard Model. To date, no evidence for has been found, with the best half-life limits in the y range Gando:2016pfg ; Agostini:2018tnm ; Alduino:2017ehq ; Arnold:2015wpy ; Azzolini:2018dyb ; Albert:2017owj ; Aalseth:2017btx .
Two-neutrino double beta decay () is a rare second order process that is allowed in the Standard Model. It has been observed in 12 isotopes with half-lives ranging from 1019 to 1024 y Saakyan:2013rvw ; Barabash:2015eza . Measurement of the half-life provides experimental determination of the NME for this process, , which can be used to improve NME calculations for the mode. The precision with which can be measured depends crucially on knowledge of . In addition, is an irreducible background component to and therefore precise measurements of rates and spectral shapes are important.
One of the most promising double beta decay () candidates is 82Se due to its high -value (2997.9(3) keV Lincoln:2012fq ), above most common backgrounds from natural radioactivity, relatively high isotopic abundance (8.83% Meija:2016xx ) and existing robust technologies of isotopic enrichment through centrifugation. It has been selected as the isotope of choice for a number of planned decay experiments Arnold:2010tu ; Beeman:2013ahp .
The first measurement of in 82Se was made in 1967 with a geochemical experiment, extracting a half-life of y Kirsten:1967 . This result was later confirmed by many other geochemical measurements (see reviews Kirsten:1986uh ; Manuel:1986ug ; Manuel:1991zz ). Such geochemical experiments are not able to distinguish between and modes and the conclusion that had been observed was drawn using complementary theoretical and experimental arguments. Whilst the precision of any individual measurement was reasonably good, the spread of the results was quite high. Nevertheless, the combination of many experiments led to a half-life value of y Manuel:1986ug ; Kirsten:1986uh ; Manuel:1991zz .
The isotope of 82Se was in fact the first nucleus in which was directly observed in a counter experiment in 1987 Moe:1987prl . A total of 36 candidate events were observed yielding a half-life of y. A more precise direct measurement was later carried out by NEMO-2, y Arnold:1998npa . The most precise result to date was obtained by NEMO-3 after analysing a subset of its data, y Arnold:2005rz . The same data set was also used to obtain a stringent lower limit on the half-life for the decay of 82Se, y at 90% C.L.
We present the results of the 82Se measurement and searches with the full data set collected by the NEMO-3 detector, representing a five-fold increase in exposure compared to the previously published result Arnold:2005rz .
2 NEMO-3 Detector and 82Se Source
NEMO-3 was a detector composed of a tracker and a calorimeter capable of reconstructing the full topology of events. It was installed in the Modane Underground Laboratory (LSM) with an overburden of 4800 m.w.e. to shield against cosmic rays. The detector housed seven enriched isotopes in the form of thin (about ) source foils. These were arranged in a cylindrical geometry subdivided into 20 identical sectors. The two isotopes with the largest mass were 100Mo (6.91 kg) and 82Se (0.93 kg) with smaller quantities of 48Ca, 96Zr, 116Cd, 130Te and 150Nd Arnold:2015wpy ; Arnold:2005rz ; Arnold:2016ezh ; Argyriades:2009ph ; Arnold:2011gq ; Arnold:2016dpe . Charged particle ionisation tracks are reconstructed from hits in 50 cm deep and 270 cm long wire chambers on each side of the source foils composed of 6180 Geiger cells operating in helium with the addition of ethanol as a quencher (4%), argon (1%) and water vapour (0.15%). The transverse and longitudinal resolution of individual tracker cells was 0.5 mm and 8.0 mm () respectively. The tracker was enclosed by calorimeter walls assembled from plastic scintillator blocks coupled to low background photomultipliers (PMT). The detector was calibrated by deploying 207Bi, 90Sr and 232U sources during the course of data collection. The energy resolution of the calorimeter blocks was and the time resolution was 250 ps, both at 1 MeV. The detector was surrounded by a solenoid which generated a 25 G magnetic field parallel to the cell wires. The magnetic field allows the rejection of approximately 95% of positrons at 1 MeV. The detector was placed in passive shielding consisting of a 19 cm thick layer of iron to suppress the external gamma ray background, as well as borated water, paraffin and wood to moderate and absorb the environmental neutron background. A detailed description of the detector and its calibration and performance can be found in Arnold:2004xq ; Arnold:2015wpy .
The 82Se source foils had a composite structure. Enriched 82Se powder was mixed with polyvinyl alcohol (PVA) glue and deposited between 23 µm (2.2 mg/cm2) thick Mylar foils. Enriched selenium from two production runs was used, attaining enrichment factors of for run 1 and for run 2. Selenium from run 1, which was also used in the NEMO-2 experiment Arnold:1998npa , was placed in a single detector sector, while the isotope from run 2 was in an adjacent sector. The total mass of the 82Se isotope in NEMO-3 was , with from run 1 and from run 2.
NEMO-3 took data from February 2003 to January 2011. A standard set of criteria define high quality runs, where the detector was operating stably and the calorimeter was calibrated Arnold:2015wpy . The accepted live-time of the detector is 5.252 y, resulting in an exposure of 4.90 kgy for 82Se.
During the first 18 months of data-taking, the radon (222Rn) level inside the detector was higher than anticipated. This was caused by the diffusion of radon from the air of the laboratory into the tracking gas. To lower the radon level inside the detector, an anti-radon tent containing filtered air was built around the detector reducing the radon level in the tracker volume by a factor of about 6 Argyriades:2009vq . The higher radon activity data-taking period, lasting 1.06 y, is referred to as phase 1 and the lower activity period, with a duration of 4.19 y, as phase 2.
3 Particle Identification and Event Selection
One of the major strengths of the NEMO-3 approach amongst experiments is its ability to use multiple observables and a combination of tracking and calorimetry information for particle identification and reconstruction of different event topologies. By separating data events into different channels based on the number of electrons, -rays and -particles that they contain, a pure signal channel can be defined along with a series of background channels that may be used to normalise the different background contributions to this signal channel.
Electrons and positrons are identified by ionisation traces that can be extrapolated to an energy deposit in the calorimeter, and are distinguished by their curvature in the magnetic field. By contrast, -rays are identified as an energy deposit in the calorimeter without an associated track. A 1 MeV photon has a 50% probability of interaction with a scintillator block. Therefore neighbouring calorimeter hits are clustered together and attributed to a single -ray interaction event with an energy equal to the energy sum of the individual hits. Due to their heavy ionisation energy losses, -particles from radioactive decays can not travel more than about 35 cm in the NEMO-3 tracker and are identified by their short, straight tracks.
Both data and Monte Carlo simulations (MC) of signal and background are processed by the same reconstruction algorithm. The DECAY0 event generator Ponkratenko:2000um is used for generation of initial kinematics and particles are tracked through a detailed GEANT3 based detector simulation Brun:1987ma .
Candidate signal events are selected to contain two electron tracks, each with an energy deposit . The tracks must originate from the 82Se source foil and have a common vertex (i.e. the distance between the track intersections with the foil should be cm (transversely) and cm (vertically), set by the resolution of the tracking detector). There should be no -particle tracks in the event. The timing of the calorimeter hits must be consistent with an internal event defined as two electrons simultaneously emitted from a common vertex in the foil Arnold:2015wpy .
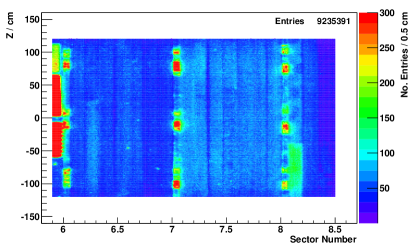
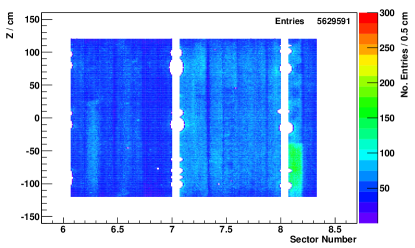
Backgrounds are constrained using specific event topologies and timing characteristics. Single electron candidate events (1e) must have one electron track originating from a 82Se source foil. The position of these intersections are used to identify areas in the source foils with higher than average contaminations as shown in Figure 1. Areas with an event rate more than 5 higher than the mean rate for the foil strip in which it is housed are excluded from the data analysis.
The 1e1 channel events contain a single electron track and a delayed -particle track emitted from a common vertex, with no constraints on the number of -rays present. The -particle track must be registered in the range of µs after the electron track, such that it is consistent with 214Bi 214Po 210Pb sequential decays from the 238U radioactive series. These decays predominantly originate from radon in the tracker as outlined in Section 4.
Events with a single electron track and a number of -ray hits (1e) are used to constrain different backgrounds depending on the number of -rays and their timing characteristics. As with electron candidates, -ray hits must have an energy deposit keV to be accepted. Events containing electron and -ray hits consistent with simultaneous emission from the same location in a 82Se foil are used to measure internal contamination by radioactive isotopes. Conversely, those containing hit times consistent with a -ray first interacting with a calorimeter block before producing an electron in the foil are used to measure the external -ray flux. Finally, crossing-electron events, where a single electron crosses from one side of the detector to the other, are selected using the same cuts as for the channel but with a requirement that the timing of the calorimeter hits be consistent with an external origin of the event. Further details on using topological, timing and energy cuts for background identification can be found in Argyriades:2009vq .
4 Background and Control Measurements
Any event containing two reconstructed electrons from an origin other than the decay of 82Se can be misidentified as a event. The main source of background events are trace amounts of naturally-occurring radioactive isotopes that come from the 238U and 232Th radioactive series. Only -emitting radioactive isotopes with high -values are potential backgrounds to a search. The two main isotopes of concern are 214Bi and 208Tl with -values of and MeV respectively.
The largest background contribution comes from internal contamination of the source foils. Isotopes that undergo -decay can mimic two electron events via the processes of -decay with Møller scattering, -decay to an excited state followed by internal conversion, or by subsequent Compton scattering of the de-excitation photon.
Other background events may be classified as coming from an origin external to the source foils. These usually involve a -ray that interacts with the source foil causing pair production, Compton interaction followed by Møller scattering or double Compton scattering. The sources of external -rays are predominantly radioactive decays within the rock surrounding the laboratory, neutron capture and decays within the detector components or shielding.
A subset of the external backgrounds is identified as radon backgrounds, coming from 222Rn, which is a gaseous isotope in the 238U chain. Due to its long half-life of 3.82 days 222Rn can be introduced via a number of mechanisms, notably emanation from detector materials, contamination of the tracker gas or of other detector surfaces, or via diffusion through detector seals. Once inside the detector, the radon decays to predominantly positive ions. These charged progenies drift towards the source foils or tracker wires where they settle, leaving deposits of 214Bi near the source material Argyriades:2009vq . Once on or near the source foils, this 214Bi is then capable of producing background events in the same way as internal contaminants.
The background model is defined by the activity of each isotope in specific locations. In all background sources, 214Pb is assumed to be in secular equilibrium with 214Bi and likewise for 228Ac, 212Bi and 208Tl. The fitting procedure extracts the different isotope activities using a binned log-likelihood maximisation. The distributions from the six background channels (1e, 1e1, 1e1, 1e2, external 11e and crossing-electron) and a signal channel are fitted simultaneously to extract the most likely activity parameters.
4.1 External backgrounds
The external -ray flux incident on the detector is quantified using the external 11e and crossing-electron channels. In the former, a -ray deposits energy in the calorimeter before interacting with the source foil to produce an outgoing electron. In the latter, the -ray interacts close to the surface of a calorimeter, producing an electron that crosses the whole tracking chamber including the source foil. Data from these channels constrain the number of events in the channel from the external -ray flux.
The external background model is an effective model of the -ray flux incident on the detector, with components similar to the model in Argyriades:2009vq . It is dominated by 40K, 208Tl and 214Bi contamination in the calorimeter PMT glass and by 208Tl, 214Bi and 60Co in the iron shielding surrounding the detector.
The model reproduces the data accurately as can be seen from the distributions of energy deposited in the calorimeter for the external 11e and crossing-electron channels shown in Figure 2.
The external background model presented here is constructed using data from the 82Se sectors only. It is consistent with the average external background model in Argyriades:2009vq , where all sectors are used, within . This is the expected level of sector-to-sector variation in the external background model.
4.2 Radon backgrounds
The radon level inside the detector can be measured by studying 214Bi 214Po 210Pb sequential decay events in the 1e1 channel. The distribution of the length of the -particle tracks is used to reconstruct the location of 214Bi. For example, the track length is sensitive to whether the -particle originated from the surface of a tracker wire or inside the bulk of the source foil.
Using the reconstructed position of the events, an extensive radon model has been developed with 214Bi on the surface of the tracker wires, source foils and scintillators varying from sector-to-sector and, in the case of the surface of the wires, with tracker layer Argyriades:2009vq .
Distributions of -particle track length from the 1e1 channel, which are used to extract the 214Bi activities, can be seen in Figure 3. The contribution from internal foil contamination has the shortest track lengths as these -particles must traverse the most material before entering the tracking gas while the surface of tracker wires sample has the longest tracks. The shape of the distributions is an artefact of the tracker geometry. The lower number of events between 20 and 30 cm is a result of a gap in the layers of tracker cells at this distance due to the presence of calorimeter blocks in the detector end caps Arnold:2004xq .
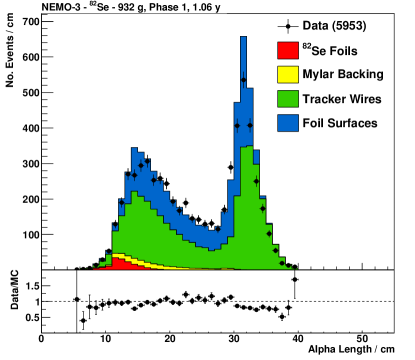
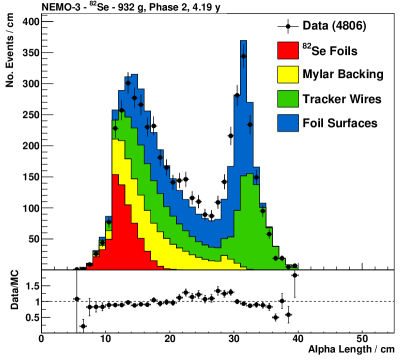
The difference between phases 1 and 2 is apparent, with a higher proportion of events from surfaces of the tracker wires and source foils during phase 1. In these cases, 214Bi has been deposited on exposed surfaces as a result of radon decay in the tracker gas. In phase 2 there is a larger contribution from the internal and Mylar components. This originates from 214Bi decays from contamination with 226Ra and has therefore remained constant whilst the radon level inside the tracker gas has decreased.
The small discrepancies observed between MC and data distributions are due to a strong sensitivity of the -particle range to the location of the 214Bi. For example, the distributions can be altered significantly by transferring 214Bi between the surface of the foils and the surface of the wires or between different wires within the tracker. The detection efficiency for electrons from 214Bi is much less sensitive to these small changes in decay location and so the systematic uncertainty from this discrepancy that propagates through to the channel is negligible.
In addition to the 214Bi components that are measured with 214Bi 214Po 210Pb delayed events, there are other background events from 208Tl and 210Bi. The former is a product of 220Rn decay and was measured using 1e2 and 1e3 channels where the electron track starts away from the foil Argyriades:2009vq . The latter is caused by 210Pb from 222Rn deposited on the surfaces of detector components during construction. This isotope has a half-life of and supplies 210Bi over the lifetime of the experiment. It is therefore not in equilibrium with 222Rn observed in the detector. In a similar manner to the 214Bi activities, a map of relative 210Bi activities divided by sector and tracker layer has been developed Argyriades:2009vq .
4.3 Internal backgrounds
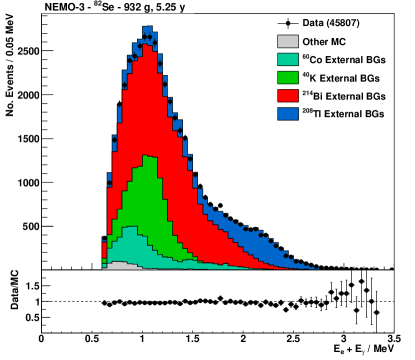
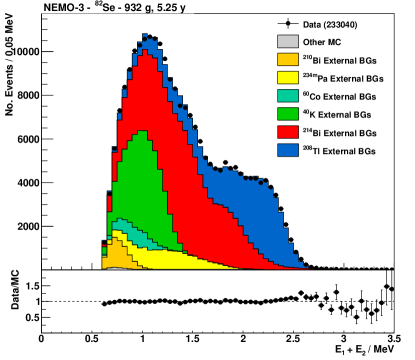
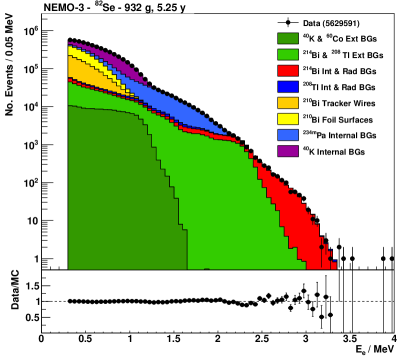
The main backgrounds in the low energy region come from -decaying isotopes. The 1e channel electron energy distributions, shown in Figure 4a, are dominated by 210Bi, 40K and Pa. In the higher energy region, the contributions from the external 208Tl and 214Bi backgrounds become significant and at energies above , 214Bi from the internal and surface of tracker wire contaminations are the only remaining contributions.
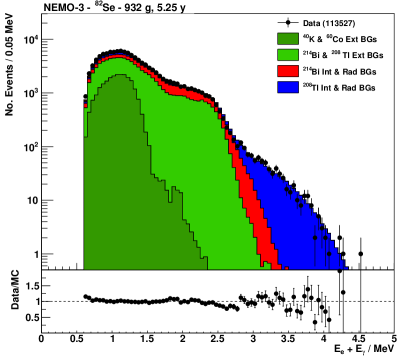
The 1e1 channel constrains isotopes decaying to excited states, most notably 214Bi and 208Tl as shown in Figure 4b. At energies below the channel serves as a cross-check on the number of external -ray flux events that have calorimeter timings consistent with an event of internal origin. At high energies, the distribution contains events from internal contamination with 208Tl.
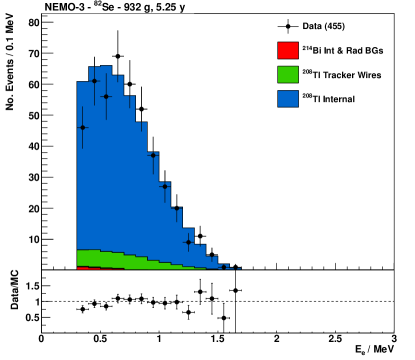
A more sensitive probe for the 208Tl internal contamination is the 1e2 channel with one -ray above 1.7 MeV, shown in Figure 5. Any contributions from 214Bi are heavily suppressed by this cut on the energy such that the channel is dominated by the internal contributions of 208Tl, with a 10% contribution from the 208Tl in the tracker wires.
The measured activities for the internal contaminations are summarised in Table 1. The levels of contamination are similar for both enrichment runs with the exception of Pa where there is a four-fold increase in the activity in run 2. The results are compared with measurements made with a high purity germanium (HPGe) detector carried out prior to the installation of the 82Se foils in the detector. The results are consistent across all isotopes in Table 1.
| Isotope | NEMO-3 (mBq/kg) | HPGe | ||
|---|---|---|---|---|
| Run 1 | Run 2 | Combined | (mBq/kg) | |
| 214Bi | ||||
| 208Tl | ||||
| Pa | ||||
| 40K | ||||
5 Two-neutrino double beta decay
Candidate signal events are selected using the criteria outlined in Section 3. A total of candidate events were selected, with and from source foils from enrichment runs 1 and 2 respectively. Table 2 shows the contribution expected from simulations of individual background sources to the signal channel, with the lower energy threshold column relevant to a measurement.
| Event Source | ||||||
| Expected Events | % of Total | Expected Events | % of Total | |||
| Run 1 | Run 2 | Run 1 | Run 2 | Run 1 & Run 2 | Run 1 & Run 2 | |
| 214Bi, 214Pb | 2.4 | 1.9 | 34 | |||
| 208Tl, 212Bi, 228Ac | 1.3 | 1.4 | 25 | |||
| Pa | 7.9 | 23.0 | ||||
| 40K | 3.5 | 2.8 | ||||
| Radon | 2.0 | 1.6 | 25 | |||
| External | 3.1 | 2.7 | 1 | |||
| All Backgrounds | 20.1 | 33.4 | 84 | |||
| 82Se 2 Signal | 79.9 | 66.6 | 16 | |||
| Signal + Background | 100.0 | 100.0 | 100 | |||
| Data | 4350 | 4586 | N/A | N/A | 15 | N/A |
The largest background contribution comes from internal contamination of the source foils with 15.1% of the total number of events for run 1 foils and 29.1% of those from run 2 foils. Among the internal contaminants, Pa is the most prominent, accounting for 7.9% of events originating in run 1 foils and 23.0% of events from run 2 foils. The external backgrounds account for 3% of the total with the majority of events from -ray transitions of 208Tl and 214Bi. The radon backgrounds make up 2% with a dominant contribution from 214Bi, and a secondary contribution from 210Bi. The majority of these events come from the surface of the tracker wires, but some are also present on the surface of the foil. There are more expected radon background events in phase 1 compared to phase 2 despite its much shorter exposure period.
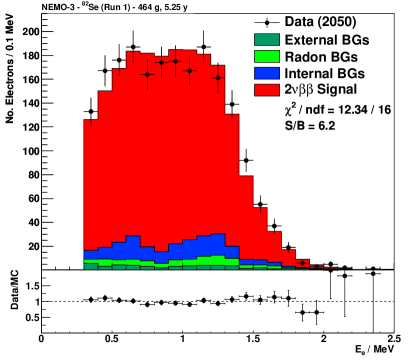
NEMO-3 has the unique capability of reconstructing the full kinematics of the decay final states. The individual energies of each electron can be seen in Figure 6, where the higher degree of contamination from Pa in the run 2 foils leads to a much larger contribution from the internal backgrounds.
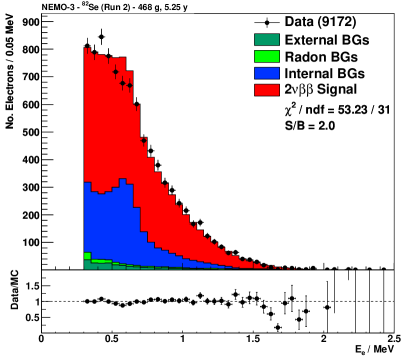
There is a discrepancy between data and MC in the region of MeV caused by a peak from the emission of a 694 keV internal conversion electron from Pa. This discrepancy is significantly stronger in the run 2 foils due to their higher contamination with Pa. The discrepancy is most likely caused by inaccuracies in the internal conversion electron transition probabilities obtained from the existing nuclear data sheets Akovali:1994xx ; Browne:2007yy . Given this large uncertainty associated with the Pa background contribution, the enrichment run 2 foils are excluded from the analysis to enable a more precise measurement of the half-life, as further discussed in 5.2.
5.1 Higher-state vs single-state dominated transistions
For the purpose of the nuclear matrix element calculation, the decay of 82Se to 82Kr is modelled as two virtual transitions: one between the ground state of 82Se and the states of the intermediate nucleus of 82Br, and one between the states of 82Br and the ground state of 82Kr. If one single intermediate state dominates the transition, then the process is said to be single-state dominated (SSD). Alternatively, if the process proceeds through many higher intermediate excited states, it is said to be higher-state dominated (HSD). Previously, it has been assumed that 82Se decay occurs in the HSD scenario. However, a strong transition in the 82Se(3He,3H)82Br reaction via the (75 keV) excited level of 82Br was recently identified Frekers:2016xx , suggesting that the SSD scenario could be realised. The shape of the distribution of the sum of electron energies, which is used for the half-life measurement, is very similar in both scenarios. However, the sub-division of energy between the electrons is different in the two cases and therefore a precise high-statistics study of single-electron energy distributions can be used to distinguish between the two models Simkovic:2005xx . Moreover, the choice of the model affects the measured half-life of the transition. This is because the increased number of lower energy electrons in the SSD model reduces the detection efficiency and therefore the extracted half-life. The selection efficiency for the signal calculated from MC using the event selection criteria described above is under the HSD hypothesis and in the SSD case.
The largest difference between the SSD and HSD single-electron energy spectra is at the low end of the distribution Simkovic:2005xx . However, due to the previously identified issues with the Pa conversion electron branching ratios, the individual electron energy distributions for the HSD and SSD models were compared to data after applying a cut on the sum of the electron energy of . This reduces the contamination from Pa to below 2%. Figure 7 shows a good agreement with data for the SSD hypothesis () while the HSD hypothesis is disfavoured () at a level equivalent to 2.1. The SSD scenario is therefore assumed for the remainder of the analysis, unless explicitly stated otherwise.
5.2 Extraction of half-life
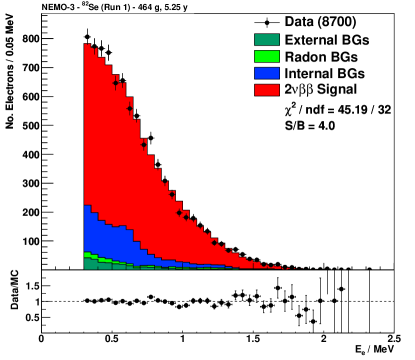
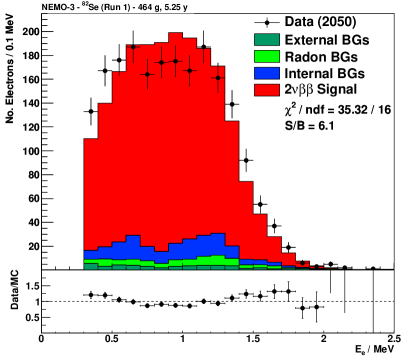
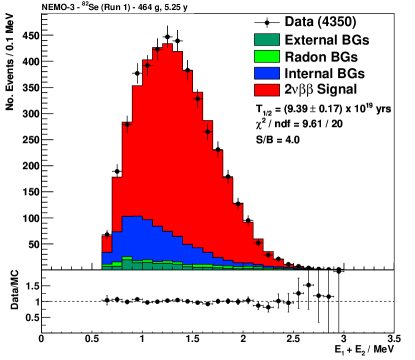
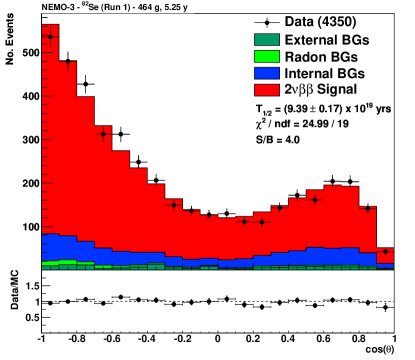
A binned log-likelihood fit to the distribution of the sum of the two electron energies of the 4350 events selected from the data and originating from enrichment run 1 foils is performed together with a fit to the six background channels, as described in Section 4. The fit assuming the SSD hypothesis, shown in Figure 8, yields signal events, with a signal-to-background ratio of . The distribution of the opening angle between the two tracks is shown in Figure 9.
In addition to the statistical uncertainty obtained from the log-likelihood fit, the half-life measurement is affected by a number of systematic uncertainties. The most important source of systematic error is the uncertainty on the detector acceptance and reconstruction and selection efficiency. This uncertainty is quantified using dedicated runs with 207Bi sources introduced into the detector and is compared with activities independently measured by an HPGe detector. Taking into account the systematic error on the HPGe measurement (5%) the uncertainty on the signal efficiency is determined to be 5% Arnold:2015wpy .
Other sources of systematic uncertainty are listed in Table 3. The systematic error due to the background modelling is dominated by the uncertainty on the Pa conversion electron branching ratio discussed above. This uncertainty translates into a 2.3% error on the half-life for the run 1 foils and increases to 4.5% if the analysis is performed on both enrichment samples due to the higher Pa levels in the run 2 foils. The uncertainty on the half-life measurement is systematics dominated and therefore the overall precision of the measurement is improved by excluding the run 2 foils.
The individual systematic errors are assumed to be uncorrelated and are added in quadrature to obtain the total systematic uncertainty of 6.3%. This yields the final measurement of for the number of signal events obtained with of 82Se from enrichment run 1 over 5.25 y of observation.
| Systematic | 2 half-life | |
| Systematic cause | uncertainty | uncertainty |
| 2 efficiency | ||
| Pa modelling | (Run 1) | |
| (Runs 1+2) | ||
| Min. energy | ||
| Energy calibration | ||
| Int. BG activities | ||
| Ext. BG activities | ||
| Radon BG activities | ||
| 82Se mass | ||
| Total syst. error | N/A | (Run 1) |
| (Runs 1+2) |
This can be converted to the 82Se half-life using
| (2) |
where is the selection efficiency (2.623%), is Avogadro’s number, is the number of moles of 82Se and is the total exposure time. The resulting half-life, assuming the SSD hypothesis, is
| (3) |
An identical analysis under the HSD hypothesis gives
| (4) |
The half-life measurement allows the experimental determination of the NME for the decay mode of 82Se using the equation
| (5) |
where is the axial-vector coupling constant and is the phase space for the 82Se ground state transition. Taking as calculated in Kotila:2012zza ; Mirea:2015nsl and assuming Agashe:2014kda we obtain for the matrix element under the SSD hypothesis
| (6) |
and under the HSD hypothesis
| (7) |
where the quoted errors include both statistical and systematic uncertainties, which are assumed to be uncorrelated.
6 Neutrinoless double beta decay
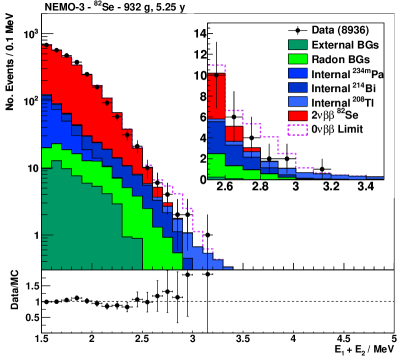
A search for is carried out by selecting events as outlined in Section 3. Due to the higher energies of electrons emitted in the decay the uncertainties due to the Pa background model reported earlier are negligible. Consequently, both enrichment samples are included in the analysis. Alongside backgrounds from natural radioactivity, has an additional background contribution from events. The following results assume the SSD hypothesis, but the same results are also found if the HSD case is taken. We considered four lepton number violating mechanisms for : light Majorana neutrino exchange, the admixture of right-handed currents in electroweak interactions, decay accompanied by a majoron emission and R-parity violating SUSY models. No evidence for a signal is found for any of these mechanisms and therefore corresponding limits on the half-lives are set. The background contributions to in the [] MeV energy region, where most of the signal from the light Majorana neutrino exchange and right-handed current mechanisms is expected, are shown in Table 2.
The electron energy sum distribution is used to set the limits using a modified frequentist method based on a binned log-likelihood ratio test statistic (CLs) Junk:1999kv . The statistic is calculated over the entire energy range above 0.6 MeV and takes into account the shape of the energy distribution.
In order to estimate the effect of systematic uncertainties on the limit, the background and signal distributions are scaled by random factors drawn from Gaussian distributions with widths defined by the systematic errors of the experiment Fisher:2006zz , which are given in Table 4. Similarly to , the most significant contribution comes from the error on the selection efficiency.
| Systematic | ||
| Systematic cause | uncertainty | Source of estimate |
| 0 efficiency | 207Bi vs. HPGe | |
| Ext. BG activities | Variation from | |
| model in Argyriades:2009vq | ||
| Radon BG activities | 1e1 vs. 1e1 | |
| Int. BG activities | 207Bi vs. 2e | |
| (excl. Tl, Bi & Pa) | ||
| Int. 214Bi activity | 1e1 vs. 1e1 | |
| Int. 208Tl activity | 232U vs. HPGe | |
| Int. Pa activity | Old vs. new MC | |
| 2 activity | Statistical error |
6.1 Light Majorana Neutrino Exchange
Light Majorana neutrino exchange is the most commonly discussed mechanism of decay. It has an experimental signature characterised by a peak in the distribution of the electron energy sum at the value.
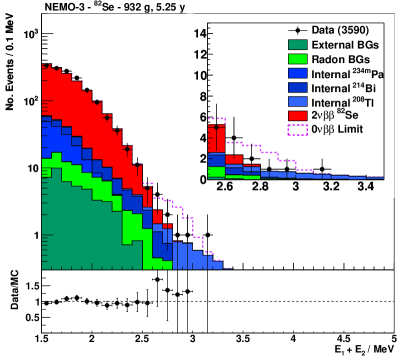
The background, signal and data distributions shown in Figure 10a are used to set the limit. There are 7.20 [] events expected to be excluded at the 90% C.L., where the range is given in brackets. The systematic errors from Table 4 are included in the expected limit and only reduce it by 2%. Taking into account the detector efficiency of 9.80% for this mechanism and the 82Se exposure of 4.90 kgy, the 90% C.L. expected half-life limit is . From the data sample, 9.67 events are excluded at 90% C.L. leading to an upper limit on the half-life of
| (8) |
which is within the range of the expected sensitivity.
Equation 1 is used to convert the half-life limit into an upper bound on the effective Majorana neutrino mass. The phase space is taken as Kotila:2012zza (in agreement with from Mirea:2015nsl ).
Several nuclear models are used to calculate the NME for the 82Se transition to the ground state. The most recent calculations from Menendez:2009jp ; Simkovic:2013qiy ; Suhonen:2015rh ; Iachello:2015hwa ; Rodriguez:2010mn ; Yao:2015new have been used and is taken in the range to correspond with the assumptions of the different calculations. As a result, the constraint on the effective neutrino mass is
| (9) |
6.2 Right-handed Currents
Right-left symmetric models can provide an alternative mechanism for due to the presence of right-handed currents (RHC) in the electroweak Lagrangian Doi:1985dx ; Tomoda:1990rs . The lepton number violation mechanism is characterised by the coupling between right-handed currents of quarks and leptons, , and right-handed quark and left-handed lepton currents, .
The mechanism leads to very different angular and single energy distributions of the final state electrons and can therefore be distinguished from other mechanisms in an experiment capable of reconstructing the full topology of the process, such as NEMO-3 Arnold:2010tu . In addition to the electron energy sum, further discrimination between the RHC mechanism and background can be achieved with the energy asymmetry between the individual electron energies, , defined as .
The expected sensitivity in the RHC mode has been studied by MC and is maximised with a cut of . This selection is therefore applied when searching for this particular decay mode as shown in Figure 10b. Cutting on the energy asymmetry variable provides no improvement in sensitivity for the mode and so the standard selection criteria are used in this case.
For the mode, 7.34 events are excluded from the data sample leading to a lower limit on the half-life of y at 90% C.L. This result is in agreement with the median expected sensitivity of the experiment of y. For the mode, the half-life lower limit is y at 90% C.L. and also agrees with the expected sensitivity.
These half-life limits are translated into upper bound on the coupling between right-handed quark and lepton currents, , and into the coupling between right-handed quark and left-handed lepton currents, . The constraints are obtained using NME calculations from Aunola:1998jc ; Muto:1989cd ; Tomoda:1990rs .
6.3 Majoron Emission
A decay accompanied by a majoron, a light or massless boson that weakly couples to the neutrino, has a continuous spectrum of the energy sum of the two decay electrons, , up to Bamert:1994hb . The phase space of the process depends on the spectral index , as , and determines the shape of the distribution. Decays with higher have broader distributions peaking at lower energy values. Such events are harder to separate from and other backgrounds. Therefore only the result of the search for majoron induced decay with is shown here. The corresponding half-life limit is y at 90% C.L., which translates into an upper limit on the majoron-neutrino coupling of . The range is due to a spread in NME calculations, which are taken from Menendez:2009jp ; Simkovic:2013qiy ; Suhonen:2015rh ; Iachello:2015hwa ; Rodriguez:2010mn ; Yao:2015new , while the phase space is taken from Kotila:2015ata .
6.4 Supersymmetry Models
R-parity violating SUSY models can trigger 0 decay via short range exchange of heavy superpartners, such as gluino or neutralino, or long range exchange of squarks and neutrinos Faessler:1997db ; Faessler:2007nz . The kinematics of the electrons emitted in the decay are the same as in the light neutrino exchange mechanism and therefore the same half-life limit can be used to set limits on SUSY parameters. Taking the phase space from Kotila:2012zza and the NME from Faessler:2011xx ; Faessler:2011yy , the following constraints are obtained for the short range gluino and neutralino exchange mechanisms:
| (10) |
| (11) |
where , , and are the masses of squark, gluino, selectron and neutralino respectively. The corresponding limits for the long range squark exchange mechanism are:
| (12) |
| (13) |
| (14) |
where is a general SUSY breaking scale parameter. The above limits assume . The spread in the limits is due to NME uncertainties associated with differences in the form of the Argonne and Charge Dependent Bonn (CD-Bonn) nucleon-nucleon potentials Faessler:2011xx .
7 Summary and Conclusions
The results of 82Se decay studies obtained with the full set of NEMO-3 data are presented. The 82Se decay half-life for the ground state transition has been measured using foils from the first enrichment run only, due to higher levels of Pa contamination in the foils from the second run and associated uncertainties in the Pa conversion electron branching ratios. With the corresponding exposure of 2.4 kgy, the HSD transition hypothesis is disfavoured at the 2.1 level, whilst the SSD hypothesis is supported. In the SSD scenario, the half-life has been measured to be . This is the most precise measurement for this isotope to date and allows the experimental extraction of the corresponding NME, . This single result is more precise than and consistent with the world average reported in Saakyan:2013rvw ; Barabash:2015eza . The SuperNEMO experiment is based on the same design principles as the NEMO-3 detector and will have lower backgrounds and improved energy resolution. A demonstrator module is currently being commissioned, which will house 7 kg of 82Se. The SuperNEMO demonstrator module will have the sensitivity to distinguish between the SSD and HSD scenarios at a level.
A search for decay has been carried out for a number of different mechanisms, with foils from both enrichment runs, giving an exposure of 4.9 kgy. No evidence for any neutrinoless double beta decay transition is found and therefore upper limits on the corresponding lepton number violating parameters have been set. The results of the search are summarised in Table 5. The most stringent half-life limit for 82Se is obtained for the light neutrino exchange mechanism of , at 90% C.L. corresponding to an effective Majorana neutrino mass of . It should be noted that the CUPID-0 collaboration recently published their first limit for of 82Se with a value Azzolini:2018dyb .
| 0 mechanism | Mode | Efficiency | 90% C.L. | LNV parameter | |
| (%) | Expected | Observed | 90% C.L. | ||
| Light neutrino exchange | 9.80 | eV | |||
| Right-handed currents | 4.79 | ||||
| 8.70 | |||||
| Majoron emission | 7.03 | ||||
| R-parity violating SUSY | 9.80 | ||||
The constraints on the RHC parameters, and , on the majoron-neutrino coupling constant, , and on R-parity violating SUSY parameters, , shown in Table 5 are the best for 82Se and are comparable with the best available limits from other isotopes Arnold:2015wpy despite a much lower exposure.
Acknowledgements.
We thank the staff of the Modane Underground Laboratory for their technical assistance in running the experiment. We acknowledge support by the grants agencies of the Czech Republic, CNRS/IN2P3 in France, RFBR in Russia, STFC in the UK and NSF in the USA.References
- (1) Y. Fukuda et al., Phys. Rev. Lett. 81, 1562 (1998)
- (2) Q.R. Ahmad et al., Phys. Rev. Lett. 89, 011301 (2002)
- (3) K.A. Olive et al., Chin. Phys. C38, 090001 (2014)
- (4) S. Dell’Oro, S. Marcocci, M. Viel, F. Vissani, Adv. High Energy Phys. 2016, 2162659 (2016)
- (5) A. Gando et al., Phys. Rev. Lett. 117, 082503 (2016)
- (6) M. Agostini et al., Phys. Rev. Lett. 120, 132503 (2018)
- (7) C. Alduino et al., Phys. Rev. Lett. 120, 132501 (2018)
- (8) R. Arnold et al., Phys. Rev. D92, 072011 (2015)
- (9) O. Azzolini et al., Phys. Rev. Lett. 120, 232502 (2018)
- (10) J.B. Albert et al., Phys. Rev. Lett. 120, 072701 (2018)
- (11) C.E. Aalseth et al., Phys. Rev. Lett. 120, 132502 (2018)
- (12) R. Saakyan, Annu. Rev. Nucl. Part. Sci. 63, 503 (2013)
- (13) A.S. Barabash, Nucl. Phys. A935, 52 (2015)
- (14) D.L. Lincoln et al., Phys. Rev. Lett. 110, 012501 (2013)
- (15) J. Meija et al., Pure Appl. Chem. 88, 293 (2016)
- (16) R. Arnold et al., Eur. Phys. J. C70, 927 (2010)
- (17) J. Beeman et al., Adv. High Energy Phys. 2013, 23793 (2013)
- (18) T. Kirsten, W. Gentner, O.A. Schaeffer, Z. Phys. 202, 273 (1967)
- (19) T. Kirsten, E. Heusser, D. Kather, J. Ohm, E. Pernicka, H. Richter, in Nuclear Beta Decays and Neutrino. Proc. Int. Symp. Osaka, 1986 (1986), p. 71
- (20) O.K. Manuel, in Nuclear Beta Decays and Neutrino. Proc. Int. Symp. Osaka, 1986 (1986), p. 81
- (21) O.K. Manuel, J. Phys. G17, S221 (1991)
- (22) S. Elliott, A. Hahn, M. Moe, Phys. Rev. Lett. 59, 2020 (1987)
- (23) R. Arnold et al., Nucl. Phys. A636, 209 (1998)
- (24) R. Arnold et al., Phys. Rev. Lett. 95, 182302 (2005)
- (25) R. Arnold et al., Phys. Rev. D93, 112008 (2016)
- (26) J. Argyriades et al., Nucl. Phys. A847, 168 (2010)
- (27) R. Arnold et al., Phys. Rev. Lett. 107, 062504 (2011)
- (28) R. Arnold et al., Phys. Rev. D94, 072003 (2016)
- (29) R. Arnold et al., Nucl. Instrum. Meth. A536, 79 (2005)
- (30) J. Argyriades et al., Nucl. Instrum. Meth. A606, 449 (2009)
- (31) O. Ponkratenko, V. Tretyak, Y. Zdesenko, Phys. Atom. Nucl. 63, 1282 (2000)
- (32) R. Brun, F. Bruyant, M. Maire, A. McPherson, P. Zanarini, CERN-DD-EE-84-1 (1987)
- (33) Y.A. Akovali, Nucl. Data Sheets 71, 181 (1994)
- (34) E. Browne, J.K. Tuli, Nucl. Data Sheets 108, 681 (2007)
- (35) D. Frekers et al., Phys. Rev. C94, 014614 (2016)
- (36) P. Domin, S. Kovalenko, F. Ŝimkovic, S.V. Semenov, Nucl. Phys. A753, 337 (2005)
- (37) J. Kotila, F. Iachello, Phys. Rev. C85, 034316 (2012)
- (38) M. Mirea, T. Pahomi, S. Stoica, Rom. Rep. Phys. 67, 872 (2015)
- (39) T. Junk, Nucl. Instrum. Meth. A434, 435 (1999)
- (40) W. Fisher, FERMILAB-TM-2386-E (2006)
- (41) J. Menendez, A. Poves, E. Caurier, F. Nowacki, Nucl. Phys. A818, 139 (2009)
- (42) F. Ŝimkovic, V. Rodin, A. Faessler, P. Vogel, Phys. Rev. C87, 045501 (2013)
- (43) J. Hyvärinen, J. Suhonen, Phys. Rev. C91, 024613 (2015)
- (44) J. Barea, J. Kotila, F. Iachello, Phys. Rev. C91, 034304 (2015)
- (45) T.R. Rodriguez, G. Martinez-Pinedo, Phys. Rev. Lett. 105, 252503 (2010)
- (46) J. Yao, L. Song, K. Hagino, P. Ring, J. Meng, Phys. Rev. C91, 024316 (2015)
- (47) M. Doi, T. Kotani, E. Takasugi, Prog. Theor. Phys. Suppl. 83, 1 (1985)
- (48) T. Tomoda, Rept. Prog. Phys. 54, 53 (1991)
- (49) M. Aunola, J. Suhonen, Nucl. Phys. A643, 207 (1998)
- (50) K. Muto, E. Bender, H. Klapdor, Z. Phys. A334, 187 (1989)
- (51) P. Bamert, C.P. Burgess, R.N. Mohapatra, Nucl. Phys. B449, 25 (1995)
- (52) J. Kotila, J. Barea, F. Iachello, Phys. Rev. C91, 064310 (2015), [Erratum: Phys. Rev. C92, 029903 (2015)]
- (53) A. Faessler, S. Kovalenko, F. Simkovic, Phys. Rev. D58, 055004 (1998)
- (54) A. Faessler, T. Gutsche, S. Kovalenko, F. Simkovic, Phys. Rev. D77, 113012 (2008)
- (55) A. Faessler, G.L. Fogli, E. Lisi, A.M. Rotunno, F. Šimkovic, Phys. Rev. D83, 113015 (2011)
- (56) A. Faessler, A. Meroni, S.T. Petcov, F. Šimkovic, J. Vergados, Phys. Rev. D83, 113003 (2011)