Abnormal flip in coherent phonon oscillations of Ca2RuO4
Abstract
We employ an optical pump-probe technique to study coherent phonon oscillations in Ca2RuO4. We find that oscillation-amplitude of an symmetric phonon mode is strongly suppressed at 260 K, a putative transition point of orbital ordering. The oscillation also shows a gradual but huge change in its , such that the oscillation even flips over with a 180∘ change across the temperature. Density functional theory calculations indicate that the phonon has an eigenmode of octahedral distortion with conventional tilting along the -axis and antipolar distortion of apical oxygen. Careful inspection of the lattice captures an unusually large antipolar distortion in low-temperature structures, which may play a crucial role for the phase transition at 260 K.
Ca2RuO4 is a prototype Mott insulator, where all of the degrees of freedom — charge, spin, orbital and lattice — show robust interactions in distinctive phase transitions Nakatsuji1997 ; Braden1998 ; Friedt2001 ; Jain2017 ; Lee2017 ; Zegkinoglou2005 ; Porter2018 . A metal-insulator transition (MIT) occurs at = 357 K, accompanied by a structural transition that involves strong distortions of octahedral flattening and tilting Nakatsuji1997 ; Friedt2001 . Upon cooling, antiferromagnetic (AFM) spin ordering develops in Ca2RuO4 below = 113 K, where its magnetism is determined by the spin-orbit coupling and the tetragonal distortions Braden1998 ; Jain2017 . Recently, the sizable spin-phonon coupling has been observed in coherent phonon oscillations Lee2017 . Another interesting anomaly has been observed below = 260 K, where an orbital ordering has been suggested. Resonant x-ray scattering (RXS) experiments indicated that the antiferromagnetic diffraction peak shows up even in the paramagnetic phase below Zegkinoglou2005 ; Porter2018 . However, the exact configuration and origin of the ordering remain unresolved. Apart from these RXS results, there have been no further experimental observations on the 260 K anomaly, nor has any theoretical model been presented to support the order.
Recent advances in ultrafast techniques have rendered it possible to investigate novel phenomena in non-equilibrium states Huber2001 ; Brorson1990 ; Mankowsky2014 ; Kubler2007 ; Kim2012 ; Gerber2015 ; Schmitt2008 ; Schafer2010 ; Forst2011 ; Polli2007 ; Dhar1994 . Of particular interest is coherent phonon oscillations, which result in oscillations of a probing signal arising from periodic modulation of the lattice potential Dhar1994 ; Zeiger1992 ; Stevens2002 ; Kuznetsov1994 . In contrast to thermally activated phonons with random phases, coherent phonons provide an oscillation-phase value that reflects physical properties of a material. However, this phase tends to be overlooked, as it has been believed to be simply determined by the generation mechanism Dhar1994 ; Zeiger1992 ; Stevens2002 ; Kuznetsov1994 .
In this study, we find that the coherent phonon oscillations of Ca2RuO4 exhibit huge anomalies across . To our surprise, one phonon mode changes its oscillation- showing an unexpected 180∘ flip. Density functional theory (DFT) calculations find that the phonon mode is of octahedral tilting vibrations that are nearly parallel to the structural deformation at . Scrutiny of the temperature dependent octahedral structure reveals that a lattice deformation with a large antipolar distortion along the -axis develops below .
We perform time-resolved reflectance measurements on single-crystalline Ca2RuO4, synthesized by the floating zone method Nakatsuji2001 . We utilize near infrared 800-nm pulses for both the pump and probe beams generated from a commercial Ti:Sapphire amplifier system with a 250-kHz repetition rate. The corresponding photon energy of 1.55 eV is much greater than the optical gap of 0.6 eV of Ca2RuO4 Jung2002 . The time duration of the pump and probe pulses are 30 fs. The oscillations show a linear response to pump fluence over a wide fluence range up to 1 mJ/cm\ce^2 (Fig. S1). We present data measured at pump and probe fluences of 140 and 80 \ceJ/cm\ce^2, respectively, to minimize the heating effect and to maintain the measurement conditions close to the linear response region of the electronic response. The full width half maximum (FWHM) spot sizes of the pump and probe pulses were 80 and 40 m, respectively. The pump and probe pulses are linearly polarized and perpendicular to each other. We cannot find a noticeable anisotropy of the response depending on both pump and probe polarizations.
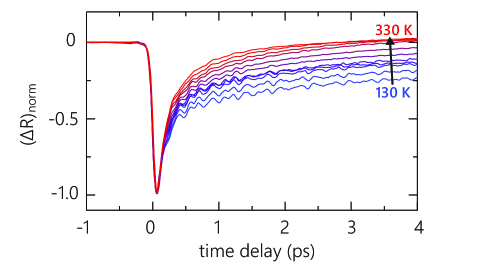
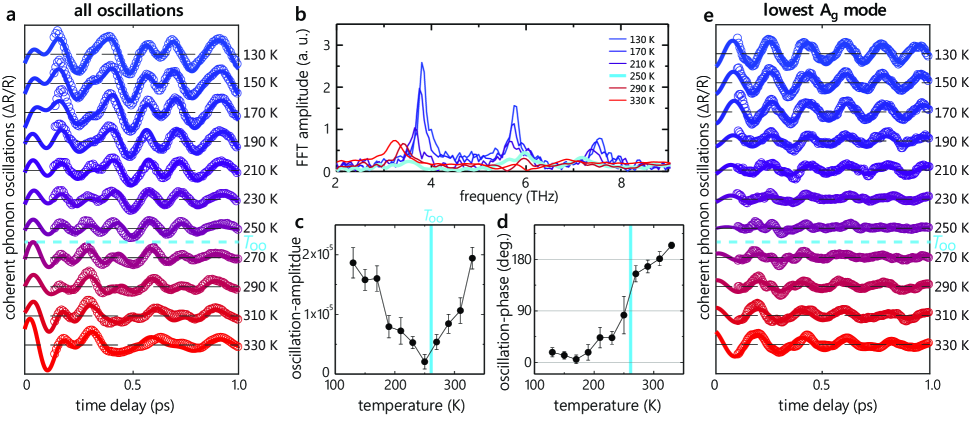
Figure 1 shows the photoinduced reflectivity change of Ca2RuO4 after near-infrared pumping at various temperatures from 130 to 330 K. The data are normalized by the maximum peak values at each temperature for a clear comparison. Analysis using a bi-exponential function fitting (Fig. S2) indicates that relaxation processes exhibit two decay time scales of 0.1 ps and 1 ps. The electronic responses of both relaxation times do not show a noticeable anomaly across .
Superimposed over the overall relaxation, periodic oscillations in the transient reflectivity are clearly observed. The oscillating components obtained by subtracting the electronic responses by means of the bi-exponential curve fitting are shown in Fig. 2(a). Fourier transform analysis reveals that the coherent oscillations are composed of multiple phonon modes as shown in Fig. 2(b). All of the modes correspond to symmetric phonons that have been observed in the previous Raman experiments Rho2005 ; Souliou2017 . Interestingly, the phonon mode of the lowest frequency of 3.8 THz gets almost fully suppressed at = 260 K. The suppression also appears in Raman scattering spectra as shown in Fig. S3, although previous Raman studies did not focus on the transition at Rho2005 ; Souliou2017 .
To extract quantitative information from the coherent oscillations, we fit the data with a damped harmonic oscillator model: = , where , and present the amplitude, frequency, initial phase, and damping time of the symmetric modes, respectively. The fitting results are shown as line curves in Fig. 2(a); all of the curves well-matched to the measurement data. Figure 2(c) and 2(d) show the oscillation-amplitude and of the 3.8 THz mode, respectively. Both parameters show clear anomalies, i.e., not only suppression of the amplitude, but also huge variation in the phase across . These anomalies show up also in the time domain signal of the phonon oscillations of the lowest frequency mode after the subtraction of higher-frequency components above 4 THz, as shown in Fig. 2(e). Such a phase variation by 180∘ of flipping is unexpected without a structural transition. As far as we know, the oscillation- flip has been reported previously only once in blue bronze across a structural phase transition Schafer2010 .
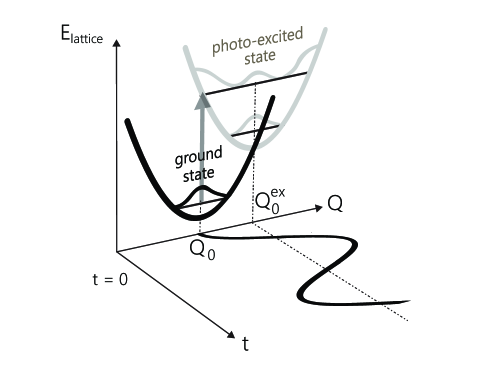
The observed values in Fig. 2(e) suggest that the cosine-type phonon oscillations are dominant in the paramagnetic insulating state well below and above . Such cosine-type oscillations have been explained by the displacive-type generation Zeiger1992 . The generation process is shown schematically in Fig. 3 in terms of the lattice potential as a function of lattice coordinate () depending on the absorption. The essence is that photo-excitation can shift the minimum position of the lattice potential from to , because of an instantaneous change in the charge density distribution Zeiger1992 ; Stevens2002 ; Kuznetsov1994 . Using optical ellipsometry techniques, we confirm that Ca2RuO4 are always strongly absorbing the pump beam at all measured temperatures (Fig. S4), which is consistent with the displacive-type oscillations. Although there is a gradual change in absorption across , the 180∘ flip is unexpected based on the case of the abovementioned displacive type coherent phonons.
What is the origin of the -flip in Ca2RuO4? Modulations of the reflectivity due to phonon oscillations should follow Zeiger1992 ; Stevens2002 ; Kuznetsov1994 . The initial displacement at is determined by the shift of the minimum of the lattice potential, in Fig. 3. If gradually changes its sign, the flip of the reflectivity modulations may occur (Fig. S5). The gradual sign change of is also consistent with the suppression of the oscillation amplitude when around . On the other hand, the phase-flip could occur when changes the sign while stays with the same sign. The change of the reflectivity on the phonon displacement is given by Zeiger1992 . The contributions of and are proportional to the Raman cross section Zeiger1992 , the intensity of which shows an anomaly across as illustrated in Fig. S3. Thus, it is also possible that Raman susceptibility changes sign across the ordering temperature, whereas the sign of the initial phonon displacement is invariant.
To investigate the coupling between the phonon and the phase transition at , we perform DFT calculations. The phonon eigenmodes are calculated by frozen phonon method. The eigenmode of the lowest mode is shown in Fig. 4(a) and Fig. 4(b); we display only four neighboring RuO6 octahedra, omitting the motions of Ca2+ because the cations with fully occupied electron shells hardly influence the optical responses. The mode can be described by octahedral tilting associated with motions of both in-plane oxygen () and apical oxygen (). The motion of tilts along the -axis. However, we find that vibrates along the [] direction at the site of the Ru(1) [Ru(2)] ion. The diagonal motion of in Ca2RuO4 is unusual, distinct from motions in usual phonon modes of a tilting character in other layered compounds, which show rigid tilts of octahedral along the unit cell axis Cohen1988 ; Sohn2014 .
We find that the position of Ca2RuO4 qualitatively becomes different across . We closely examined the crystal structure associated with . Figures 4(c) and 4(d) show simplified diagrams of the octahedral distortions, which are obtained from a close scrutiny of the previously reported neutron scattering experiments at 295 and 180 K Braden1998 ; Friedt2001 . The octahedral rotations around the -axis are ignored in the diagrams for simplicity. The positions at 295 K () represent usual octahedral tilting but with a discrepancy in tilting angles and . The tilting angle () is smaller than the tilting angle (). As a result, when projected normally to the local planes, is shifted from the symmetric center positions in the [] direction at the Ru(1) [Ru(2)] site, respectively, as shown in Fig. 4(c). However, the positions at 180 K () are shifted along the diagonal directions along [] in Ru(1) [Ru(2)] octahedral as depicted in Fig. 4(d). This contrasts clearly with the 295 K structure.
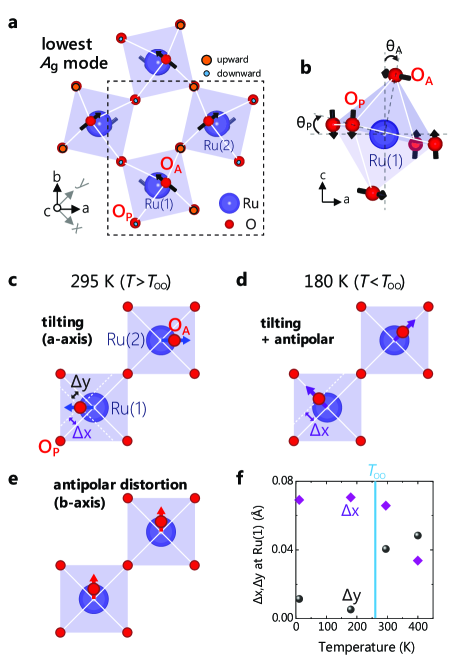
The discrepancy between the 180 K and 295 K structures can be understood by an additional antipolar distortion of toward the -axis, as shown in Fig. 4(e). The 180 K structure can be obtained if the antipolar distortion is added to the structure at 295 K. This results in site-dependent local anisotropy below . The neutron scattering data available at four temperatures Braden1998 ; Friedt2001 indicate that the antipolar distortion develops around as shown in Fig. 4(f). The relative displacement of at the Ru(1) [Ru(2)] site is almost pure [] at 180 K below , while the and components are comparable at 295 K above . Indeed, the tilting angle of increases more steeply than below 260 K Bradentilt , which might be attributed due to the development of the antipolar distortion. We note that the distortions from the symmetric position at 180 K are exactly parallel to the apical motions of the lowest phonon mode. Therefore, it is natural that the phonon oscillations are sensitive to the temperature dependent octahedral deformation. We suggest that the change of the position of the apical oxygen may result in a sign change in either of or . Verifying the exact origin of the -flip in Ca2RuO4 requires additional time-resolved measurement on the lattice structures, using X-ray pump–probe spectroscopy.
In summary, we investigate the coherent phonon oscillations in Ca2RuO4 that show a 180∘ variation across = 260 K. Careful inspection of the crystal structure provides an evidence of structural evolution of octahedra with the development of antipolar distortion below . These observations put cornerstones to understand the mysterious 260 K transition in Ca2RuO4. Our results emphasize that -sensitive measurements of coherent oscillations offer a unique opportunity to investigate quantum phase transitions coupled to the lattice in complex materials.
Acknowledgements.
This work was supported by the Institute for Basic Science (IBS) in Korea (IBS-R009-D1). K.W.K. was supported by the Basic Science Research Program through the National Research Foundation of Korea (NRF) funded by the Ministry of Science, ICT and Future Planning (NRF-2015R1A2A1A10056200 and 2017R1A4A1015564). J. Kim and S. Yoon were supported by NRF-2016R1D1A1B01009032. This work was supported by JSPS KAKENHI (Nos. JP15H05852, JP15K21717 and JP17H06136), JSPS Core-to-Core program. C.S acknowledges support of the JSPS International Research Fellowship (No. JP17F17027).References
- (1) S. Nakatsuji, S. I. Ikeda and Y. Maeno, J. Phys. Soc. Japan 66, 1868 (1997).
- (2) O. Friedt, M. Braden, G. Andre, P. Adelmann, S. Nakatsuji, and Y. Maeno, Phys. Rev. B 63, 174432 (2001).
- (3) M. Braden, G. Andre, S. Nakatsuji, and Y. Maeno, Phys. Rev. B 58, 847 (1998).
- (4) A. Jain, M. Krautloher, J. Porras, G. H. Ryu, D. P. Chen, D. L. Abernathy, J. T. Park, A. Ivanov, J. Chaloupka, G. Khaliullin, B. Keimer, and B. J. Kim, Nat. Phys. 13, 633 (2017).
- (5) M.-C. Lee, C. H. Kim, I. Kwak, C. W. Seo, C. H. Sohn, F. Nakamura, C. Sow, Y. Maeno, E.-A. Kim, T. W. Noh, and K. W. Kim, arXiv 1712.03028 (2017).
- (6) I. Zegkinoglou, J. Strempfer, C. S. Nelson, J. P. Hill, J. Chakhalian, C. Bernhard, J. C. Lang, G. Srajer, H. Fukazawa, S. Nakatsuji, Y. Maeno, and B. Keimer, 95, 136401 (2005).
- (7) D. G. Porter, V. Granata, F. Forte, S. Di Matteo, M. Cuoco, R. Fittipaldi, A. Vecchione, and A. Bombardi, arXiv 1807.00721 (2018).
- (8) R. Huber, F. Tauser, A. Brodschelm, M. Bichler, G. Abstreiter, and A. Leitenstorfer, Nature 414, 286 (2001).
- (9) S. D. Brorson, A. Kazeroonian, J. S. Moodera, D. W. Face,T. K. Cheng, E. P. Ippen, M. S. Dresselhaus, G. Dresselhaus, Phys. Rev. Lett. 64, 2172 (1990).
- (10) R. Mankowsky, A. Subedi, M. Först, S. O. Mariager, M. Chollet, H. T. Lemke, J. S. Robinson, J. M. Glownia, M. P. Minitti, A. Frano, M. Fechner, N. A. Spaldin, T. Loew, B. Keimer, A. Georges, and A. Cavalleri., Nature 516, 71 (2014).
- (11) C. Kübler, H. Ehrke, R. Huber, R. Lopez, A. Halabica, R. F. Haglund, and A. Leitenstorfer, Phys. Rev. Lett. 99, 116401 (2007).
- (12) K. W. Kim, A. Pashkin, H. Schäfer, M. Beyer, M. Porer, T. Wolf, C. Bernhard, J. Demsar, R. Huber and A. Litenstorfer, Nat. Mater. 11, 497 (2012).
- (13) S. Gerber, K. W. Kim, Y. Zhang, D. Zhu, N. Plonka, M. Yi, G. L. Dakovski, D. Leuenberger, P. S. Kirchmann, R. G. Moore, M. Chollet, J. M. Glownia, Y. Feng, J.-S. Lee, A. Mehta, A. F. Kemper, T. Wolf, Y.-D. Chuang, Z. Hussain, C.-C. Kao, B. Moritz, Z.-X. Shen, T. P. Devereaux and W.-S. Lee, Nat. Commun. 6, 7377 (2015).
- (14) F. Schmitt, P. S. Kirchmann, U. Bovensiepen, R. G. Moore, L. Rettig, M. Krenz, J.-H. Chu, N. Ru, L. Perfetti, D. H. Lu, M. Wolf, I. R. Fisher, and Z.-X. Shen, Science 321, 1649 (2008).
- (15) H. Schäfer, V. V Kabanov, M. Beyer, K. Biljakovic, and J. Demsar, Phys. Rev. Lett. 105, 066402 (2010).
- (16) M. Först, C. Manzoni, S. Kaiser, Y. Tomioka, Y. Tokura, R. Merlin, and A. Cavalleri, Nat. Phys. 7, 854 (2011).
- (17) D. Polli, M. Rini, S. Wall, R. W. Schoenlein, Y. Tomioka, Y. Tokura, G. Cerullo, and A. Cavalleri, Nat. Mater. 6, 643 (2007).
- (18) L. Dhar, J. A. Rogers, and K. A. Nelson, Chem. Rev. 94, 157 (1994).
- (19) H. J. Zeiger, J. Vidal, T. K. Cheng, E. P. Ippen, G. Dresselhaus, and M. S. Dresselhaus, Phys. Rev. B 45, 768 (1992).
- (20) T. E. Stevens, J. Kuhl, and R. Merlin, Phys. Rev. B 65, 144304 (2002).
- (21) A. V. Kuznetsov and C. J. Stanton, Phys. Rev. Lett. 73, 3243 (1994)
- (22) S. Nakatsuji and Y. Maeno, J. Solid State Chem. 156, 26 (2001).
- (23) J. H. Jung, Z. Fang, J. P. He, Y. Kaneko, Y. Okimoto, and Y. Tokura, Phys. Rev. Lett. 91, 056403 (2003).
- (24) H. Rho, S. L. Cooper, S. Nakatsuji, H. Fukazawa, and Y. Maeno, Phys. Rev. B 71, 245121 (2005).
- (25) S.-M. Souliou, J. Chaloupka, G. Khaliullin, G. Ryu, A. Jain, B. J. Kim, M. Le Tacon, and B. Keimer, Phys. Rev. Lett. 119, 067201 (2017).
- (26) R. E. Cohen, W. E. Pickett, H. Krakauer, and L. L. Boyer, Physica B 150, 61 (1988).
- (27) C. H. Sohn, M.-C. Lee, H. J. Park, K. J. Noh, H. K. Yoo, S. J. Moon, K. W. Kim, T. F. Qi, G. Cao, D.-Y. Cho, and T. W. Noh, Phys. Rev. B 90, 041105 (2014).
- (28) See Fig. 6 in Ref. [3] of Phys. Rev. B 58, 847 (1998).