From Quantum Dots to Quantum Dashes: Excitonic Spectra of Highly Elongated InAs/InP Nanostructures
Abstract
A transition from a cylindrical quantum dot to a highly elongated quantum dash is theoretically studied here with an atomistic approach combining empirical tight binding for single particle states and configuration interaction method for excitonic properties. Large nanostructure shape anisotropy leads to a peculiar trend of the bright exciton splitting, which at certain point is quenched with further shape elongation, contradicting predictions of simplified models. Moreover strong shape elongation promotes pronounced optical activity of the dark exciton, that can reach substantial fraction of the bright exciton intensity without application of any external fields. An atomistic calculation is augmented with a elementary phenomenological model expressed in terms of light-hole exciton add-mixture increasing with the shape deformation. Finally, exctionic complexes , , and are studied as well and the correlations due to presence of higher excited states are identified as a key-factor affecting excitonic binding energies and the fine structure.
I Introduction
Self-assembled InAs/InP nanostructures are promising quantum emitters at or m telecom wavelengths. Anufriev et al. (2015); Yuan et al. (2011); Benyoucef et al. (2013); Kors et al. (2017) Potential usage of these systems involves single photons and entangled photons generation, Michler et al. (2000); Santori et al. (2001); Benson et al. (2000); Stevenson et al. (2006a) with applications in quantum information and quantum communication. Knill et al. (2001); Waks et al. (2002); Kok et al. (2007) The realm of InAs/InP nanostructures is rich and varies from more conventional cylindrical self-assembled, Williams et al. (2001); Kors et al. (2018) and nanowire quantum dots Dalacu et al. (2009); Versteegh et al. (2014); Bouwes Bavinck et al. (2012) to rather unconventional semiconductor nanostructures with characteristic large in-plane elongation, known as quantum dashes. Dery et al. (2004); Sauerwald et al. (2005); Reithmaier et al. (2005, 2007); Khan et al. (2014); Musiał et al. (2012, 2014a); Gawełczyk et al. (2017); Dusanowski et al. (2017); Musiał et al. (2014b); Jung et al. (2018) Quantum dashes have demonstrated their potential for utilization in e.g. lasers and amplifiers Reithmaier et al. (2005, 2007); Azouigui et al. (2009) or single photon emitters. Dusanowski et al. (2013, 2014) Quantum dashes show also significant tuning capabilities e.g. by embedding in photonic mesas Mrowiński et al. (2018) as well as demonstrate several unique properties such a suppression of phonon-induced decoherence. Musiał et al. (2014b)
Recently, by application of external magnetic field, quantum dashes Mrowiński et al. (2015) have demonstrated their capability to systematically reduce the bright exciton fine structure splitting, Bayer et al. (2002) below the natural line width of emission, which makes the quantum dashes prospective as a source of polarization entangled photon pairs from biexciton-exciton cascade. Benson et al. (2000) The reduction of the fine structure splitting, aiming for entanglement generation, in an important scientific topic, and significant efforts have been made to achieve this goal including, among many others, post-growth annealing, Langbein et al. (2004); Young et al. (2005) spectral filtering, Akopian et al. (2006) sample selection, Hafenbrak et al. (2007); Olbrich et al. (2017) growth of high symmetry structures, Singh and Bester (2009); Karlsson et al. (2010); Dupertuis et al. (2011); Versteegh et al. (2014); Kors et al. (2018) the application of external electric, Kowalik et al. (2005); Bennett et al. (2010) magnetic, Stevenson et al. (2006a, b); Gerardot et al. (2007) and strain fields. Seidl et al. (2006); Ding et al. (2010); Trotta et al. (2012) It is thus of practical importance to study, as done in this work, the bright exciton fine structure splitting in quantum dot-quantum dash systems and see how it evolves with deformation for high-aspect ratio structures. At the other end of excitonic spectra are the dark exciton states, which recently gained an attention as potential long-lived, yet optically addressable quantum bits Schwartz et al. (2015a, b); Zieliński et al. (2015a) or could be utilized as auxiliary (metastable) states for the time-bin entanglement generation scheme. Simon and Poizat (2005); Weihs et al. (2017) For the same reasons the biexciton spectra is particularly interesting as well, and hence both the dark exciton and several excitonic complexes, such as the biexciton, are studied in this paper in detail.
Apart from any practical utilization quantum dashes are intriguing from a basic science point of view. For example, it is curious how single particle and many body properties evolve from that characteristic for a cylindrical quantum dot, by gradual deformation of nanostructure’s shape to a high-aspect ratio, deformed quantum dash. Such observation is typically not directly possible in the experiment, yet it is fully attainable in a theoretical study, which by its nature focuses on individual, single quantum systems of well defined size, shape and composition. Further, often the experiment is pestered by uncertainties due to inhomogeneous broadening in the ensemble studies Mrowiński et al. (2016a) or unavoidable alloy randomness effects originating from the specifics of the epitaxial growth, Mrowiński et al. (2016a); Zieliński et al. (2015b) in particular growth on mixed composition substrates (e.g. InGaAlAs Maryński et al. (2013); Jung et al. (2018)). A detailed knowledge (chemical composition, intermixing, actual dimensions) of nanostructure’s morphology, is often very much complicated, if not impossible to obtain. Dery et al. (2004); Sauerwald et al. (2005); Khan et al. (2014); Mlinar et al. (2009) Theoretical simulation can to a certain degree filter out these difficulties, and focus not on the direct comparison with a particular quantum dash or quantum dot experiment, but rather an analysis of general trends with shape elongation. Utilization of accurate (e.g. atomistic) approach should however give hope to produce results consistent and supporting experimental findings. Moreover theoretical studies should also give an insight used next for e.g. intentional tailoring of high-aspect ratio nanostructures to match spectral features demanded in the broad field of nanophotonics. Salter et al. (2010); Santori et al. (2002); Gérard et al. (1998); Peter et al. (2005)
The focus of this paper is on the details of the InAs/InP quantum dot-quantum dash single exciton spectra and in particular the fine structure splitting, as well as the bright and the dark exciton optical activity, all calculated as a function of shape deformation from high rotational shape symmetry to high-aspect ratio elongation. Spectra of several excitonic complexes, the negatively and positively charged exciton and the biexciton, are studied here as well. For all these cases, this article underlines the key role of correlation effects due to presence of higher levels (configuration mixing) affecting significantly all major features of quantum dashes excitonic spectra.
I.1 System and methods
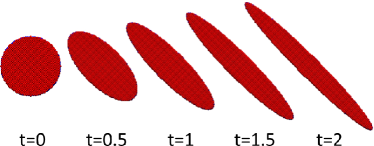
In this work I study InAs nanostructures elongated from an ideal disk-shape quantum dot to a highly-elongated (nanorod-like) elliptical quantum dash. The height of all deformed nanostructures is kept fixed and equal to nm. The diameter in a fully cylindrical case is nm (radius nm). These dimensions are typical for self-assembled quantum dots and quantum dashes. Khan et al. (2014) In our previous work Mrowiński et al. (2016a) we have studied effects of nanostructure size and composition on quantum dashes spectra, here focus on the role of lateral deformation for pure InAs/InP system. The anisotropy is applied as by elongating the system along axis and shrinking it in the perpendicular axis at the same time, such that the base field (and the overall dot volume) is kept constant. The elongation axis was chosen as , consistent with experimental findings. Mrowiński et al. (2016b) The elongation is governed by anisotropy Kadantsev and Hawrylak (2010); Zieliński (2013a) parameter with a longer (major) axis length changing as and a shorter (minor) axis length given by . We consider to vary from to (Fig. 1), and thus the aspect ratio () is given as and reaches for the highest deformation considered. The nanostructure is located on a lattice constant ( monolayers) thick ( nm) InAs wetting layer Rudno-Rudziński et al. (2006) and embedded in InP barrier. Since was varied from to with a step the calculations we performed for total of different systems.
The calculation starts with finding atomic positions that minimize total elastic energy. This is done by using the valence force field method of Keating Keating (1966); Martin (1970) with a cylindrical computational box containing total of over million atoms, and the minimization of strain energy performed using the conjugate gradient method. Jaskólski et al. (2006) The valence force method is described in more detail in Refs.Pryor et al. (1998); Saito and Arakawa (2002) and in my previous papers. Jaskólski et al. (2006); Zieliński et al. (2010); Zieliński (2012a, 2013b) Next, from atomic positions the piezoelectric potential is calculated by accounting for both linear and quadratic Bester et al. (2006a, b); Beya-Wakata et al. (2011) terms.
Then the single particle spectra of electrons and holes are obtained with the empirical tight-binding method accounting for -orbitals and spin-orbit interaction. Zieliński (2012a, 2013b) The single-particle tight-binding Hamiltonian for the system of atoms and orbitals per atom can be written, in the language of the second quantization, in the following form: Zieliński et al. (2010)
| (1) |
where () is the creation (annihilation) operator of a carrier on the (spin-)orbital localized on the site , is the corresponding on-site (diagonal) energy, and describes the hopping (off-site, off-diagonal) of the particle between the orbitals on (four) nearest neighboring sites. The summation goes over all atoms, whereas the summation over goes over the four nearest neighbors only. is a composite (spin and orbital) index of the on-site orbital, whereas is a composite index of the neighboring atom orbital. Coupling to further neighbors is thus neglected, whereas (on-site, off-diagonal) accounts for the spin-orbit interaction following the description given by ChadiChadi (1977) and including the contributions from atomic orbitals.
Here I use the parametrization of Jancu Jancu et al. (1998). The tight-binding calculation is effectively performed on a smaller domain than the valence force field calculation, Lee et al. (2004); Zieliński (2012b) yet still the number of atoms in the tight-binding computational box exceeds million presenting a substantial numerical problem. More details of the tight-binding calculation were discussed thoroughly in our earlier papers. Zieliński (2012a, 2013b); Jaskólski et al. (2006); Zieliński et al. (2010)
Finally excitonic spectra are calculated with the configuration interaction method. The Hamiltonian for the interacting electrons and holes can be written in second quantization as: Michler (2003)
| (2) |
where and are the single particle electron and hole energies, obtained at the single particle stage of calculations, and are Coulomb matrix elements (Coulomb direct and exchange integrals) calculated according to procedure given in Ref. Zieliński et al. (2010).
Typically only , , and single particles shells are included in the configuration interaction calculation of quantum dot electronic spectra. Zieliński et al. (2010); Zieliński (2013c) In this work I go beyond this approximation and account for the -shell as well, resulting in total (with spin) electron and hole single particle states entering many-body calculations and total of over million Coulomb direct and exchange integrals calculated over million atoms in the computational box. Zieliński et al. (2010); Różański and Zieliński (2016) Calculation of the multi-excitonic spectra produces thus a significant computational challenge and on a -core computer cluster it takes about -hours for all computational stages combined (i.e. strain, piezoelectricity, tight-binding and configuration interaction) for every single value, with the configuration interaction being by far the most time-demanding part.
II Single particle spectra and the excitonic ground state
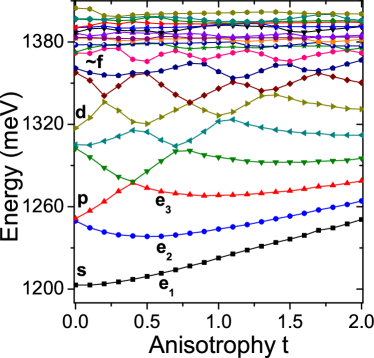
Fig. 2 shows the evolution of several lowest electron levels as a function of increasing lateral shape anisotropy. These levels evolve from the typical case of a cylindrical quantum dot with a characteristic , , , … shell structure Jacak et al. (1998) to a nanorod-like spectrum with nearly equidistant levels and no shells present. In a simplified picture this could be understood as an evolution from a quasi-two-dimensional like confinement effectively described by a -harmonic oscillator Jacak et al. (1998); Michler (2003) model to a quasi-one-dimensional system described by a -harmonic oscillator model, hence nearly equidistant spacings between levels.
Apart from above lowest electron levels experience a blue-shift in energy, with a pronounced increase of the ground electron state energy () by meV for the largest considered deformation () as compared with the cylindrical case (). This happens despite keeping the nanostructure’s volume fixed during the deformation, as mentioned above, and is due to decreased confinement in the direction, which is perpendicular to the direction of the nanostructure deformation direction . The -shell seems to be weakly pronounced and at about meV there is an apparent onset of closely spaced quasi-continuum states (-like wetting layer states). Eight (16 with spin) lowest electrons states are typically well confined within the nanostructure with the percent of the wave-function contribution in the quantum dot region varying from about for the ground state to about for , and for . Higher energy states are weakly coupled with small , yet non-negligible, contribution in the nanostructure volume. Higher lying states have progressively increasingly larger content in the wetting layer and in the barrier region. The elongation further reduces localization in the dot region which for drops from for to for and analogously for higher states.
Evolution of hole levels, as shown on Fig. 3, is somewhat more peculiar with a complicated spectra in the elongated case, several apparent anti-crossings of excited levels, and decreasing111Please note the reversed order of hole levels with respect to the electron. energy of the ground hole level by about meV with elongation. As typical for various nanostructures hole states have smaller energy levels spacings due to the larger effective mass of the hole. Hence for the non-elongated case (), the hole splitting appears larger than that of electron, whereas in fact both splittings are quite comparable, with meV value for electrons and meV splitting for holes. It should be noted that the hole -shell is apparently less separated from the excited part of the spectra than in the electron case, the -shell is practically not visible, and that the confined hole shells smoothly transform into closely separated levels below about meV. Yet, contrary to the electron, and again due to larger effective mass, even excited holes states are well confined in the nanostructure with above hole wave-function localization in the dot region for all ( with spin) lowest (-) hole states considered in latter part of the text with respect to the excitonic calculations. Interestingly the shape-deformation has little (reduction on the order of at most ) effect on the ground hole state localization degree.
At the end of the single particle energies analysis, let me note that the ground and the first excited state () spacing decreases monotonically with deformation, dropping for electrons (Fig. 2) from meV (for ) to meV (for ), and for holes (Fig. 3) from meV to meV correspondingly.
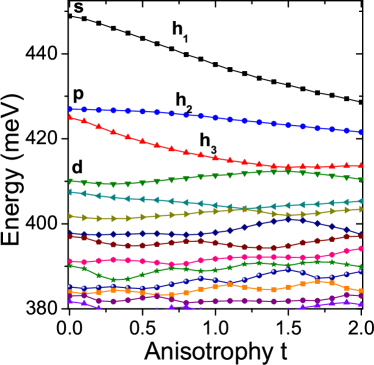
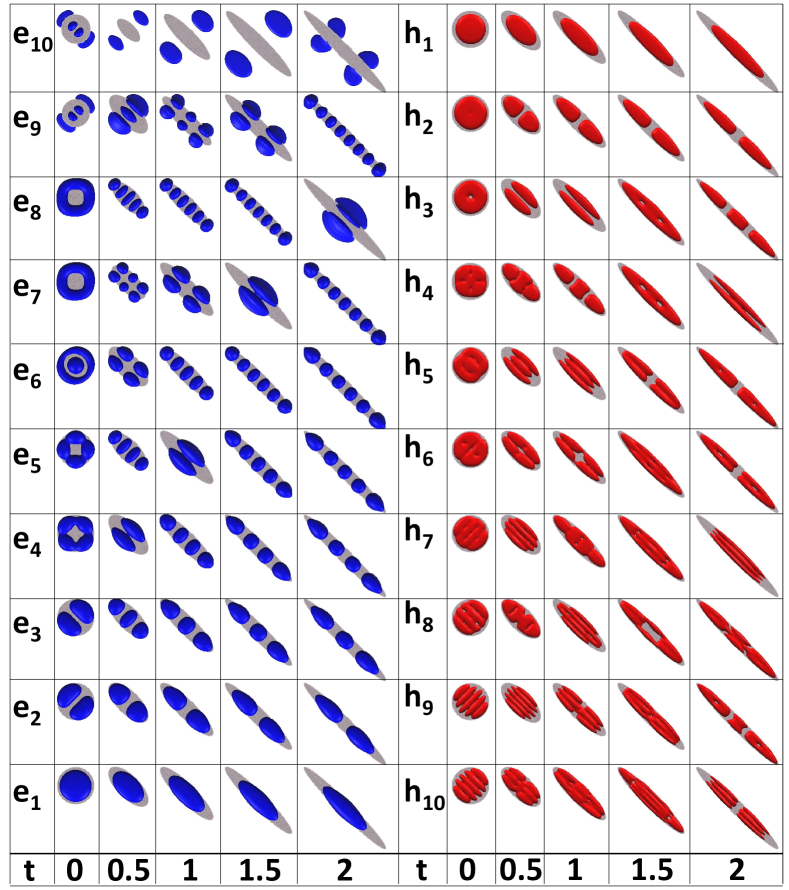
Fig. 4 shows charge densities corresponding to single particles levels shown on Fig. 2 and Fig. 3. For electron states the transition from a cylindrical to a quasi-one-dimensional confinement is apparent and manifests itself in the charge density by an increasing number of nodal planes along the elongation axes. This is particularly well visible for highly-elongated cases (e.g. ) were the manifold of lowest electron states starts for a node-less ground states, then the first excited state has one nodal plane, the second excited states has two nodal planes, and so on.
This simple, intuitive picture is somewhat complicated by a presence of apparently delocalized states intruding in-between localized ones. This is well visible for example for and . These particular state apparently origins from , one of the cylindrical () quantum dot states, which evolves higher in energy with the shape-deformation due to a presence of a node in this state aligned with the longer axis of the nanostructure. Such near-delocalized states have significant fraction of their charge density ”leaking” out of the nanostructure into the InAs wetting layer and finally into the InP barrier. Another example of an interesting behaviour is seen for higher excited states and for and cases. Here again these states have mixed character with a fraction of charge density in the nanostructure hybridized with the rest of it penetrating the wetting layer. Finally there are electron states shown here as well (e.g. for ), with no apparent density in the quantum dash area, but rather delocalized in the wetting layer.
The ground hole state charge density is shown on the right hand size of Fig. 4 (please note again reversed ordering of hole levels) and behaves similarly to the ground electron state. The only difference is that seems to localize more strongly within the nanostructure, whereas shows some spreading (leakage) in the () direction perpendicular to the deformation. Generally all (10) hole states shown here are more strongly localized in the nanostructures area. This is expected since plots shown here must be consistent with numbers (degrees of localization reaching ) discussed earlier.
Finally, let me note that the excited state shows a simple behaviour with a single nodal plane, but higher excited hole states have far more complicated nodal structure than electrons, with non-trivial nodes (both in and directions) - an apparent manifest of holes multi-band character.
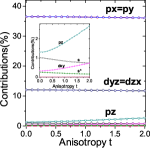
Apart from energies and charge densities, in the tight-binding formalism one can naturally inspect orbital contribution from different atomic orbitals constituting single particle quantum dot confined states. The orbital contribution to the ground hole state (for more details see the Appendix) is dominated by lateral atomic orbitals ( and ) reaching , with a significant fraction of from ( and ) -orbitals, and much smaller contributions from other states, most notably , , and altogether constituting not more than about of the total hole ground state charge density. For completeness, it should be mentioned that the ground electron state is built predominantly (over contribution) by and atomic orbitals with a small add-mixture of orbitals and much smaller contribution form other orbital species (, and ). Presence of -type orbitals in the electron state or orbitals in the ground hole state should not surprise, and it is a direct manifestation of a multi-band and multi-valley character of the tight-binding calculation. Moreover, despite pronounced changes of single particle states energies with the deformation, the orbital contribution is very little affected and stable with the deformation (for more details please see Fig. 17 in the Appendix). Hence it can be speculated that the key features of elongated systems spectra are related to the overall, spatial character of single particle state, rather than their particular orbital components.
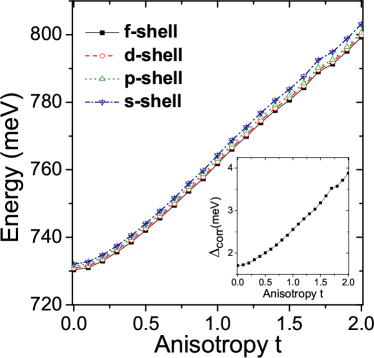
Quasi-particle states are next used as the input for the many-body (up to -shell) calculation of excitonic spectra and the resulting excitonic ground state energy evolution is shown on Fig. 5. Here within small deformations range the excitonic energy changes little since the decreased confinement in one direction () is compensated by the increased confinement in the other [110] direction, consistent e.g. with my previous work on weakly elongated quantum dots Zieliński (2013a) with . The ground exciton state upward shift in energy is thus only meV for case with respect to system. Yet, for larger deformations there is a clear, nearly linear growth of excitonic energy reaching about meV for , that is about meV larger than for the non-elongated quantum dot. It should be emphasized that the increase of excitonic ground state energy with an elongation ( meV shift) is determined mostly by single particles energy contributions ( meV) of electron and hole forming an exciton. There is thus apparently only a relatively small magnitude ( meV) of change of electron-hole Coulomb interaction between cylindrical and elongated cases. However there are different contributions to electron-hole interaction due direct term and correction due to correlations - these effects will be discussed in the latter part of the text where excitonic complexes will be studied.
Apart from the direct electron-hole Coulomb interaction there is also a matter of configuration mixing. Since in the single particle spectra we could observe the presence of different shells it is curious to check how these will affect the excitonic spectra. Hence a series of configuration interaction calculations was performed with a systematically increasing number of electron and hole shells accounted for, and results summarized on Fig. 5. For the single exciton this corresponds to , , , electron-hole configurations for , , and shells correspondingly. Since there is no shell structure for elongated systems and moreover the -shell is not well pronounced even for cylindrical dot, thus using a notion of ”shell” is just a shortcut. Accounting for the -shell means accounting for the ground electron and hole states only, -shell corresponds to ( with spin) lowest electron and ( with spin) lowest hole states, and -shell is ( with spin) states for each of charged carriers, and finally -shell corresponds to accounting for ( with spin) of each of single particle states. The energetic difference between cases accounting for and is shown as well (inset) on Fig. 5 and the correction due presence of higher shells is only about meV for symmetrical case, while it reaches more substantial meV for the largest considered deformation. The trend shown on the inset on Fig. 5 is intuitive since one could expect higher role of configuration mixing in case of closely spaced levels for elongated systems of broken symmetry than in more cylindrical cases with well separated shells. Whereas the effect of inclusion of higher-levels seems to be a small (few meV) correction as compared to the overall excitonic energy of about meV, yet this particular (-) difference is a direct measure of correlation effects due to the add-mixture of higher energy configurations and will play a crucial role e.g. in the magnitude of excitonic complexes binding energies discussed later in the text.
III Excitonic fine structure: bright and dark excitons
Apart from the main features it is curious to study the details of excitonic spectra, that is its fine structure. Typical quantum dot spectra consist of two pairs of excitonic states. One pair is formed by two states with anti-parallel electron-hole spin alignments leading to an optically active bright exciton doublet. Second pair, energetically below the bright excitons (due to electron-hole exchange) is a doublet of two dark excitonic states with parallel electron-hole spins. Both of these doublets can be further split by various effects including presence of anisotropic lattice, strain, and alloying. Zieliński (2013a) The bright exciton splitting is also commonly known as the fine structure splitting.
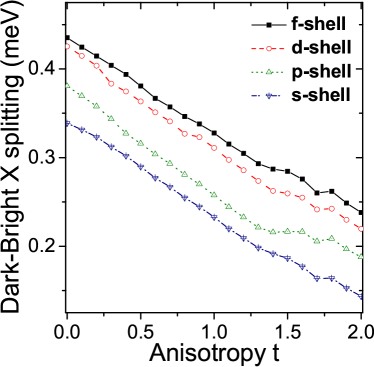
Fig. 6 shows energy difference between the lowest bright exciton state and the higher energy dark exciton. Notably this splitting goes down with the elongation in all considered approximations in the configuration interaction calculation. We can understand that in terms of decreasing electron-hole exchange interaction due to change of lateral confinement with a progressing deformation, however we should also note that this energy difference is affected also by splittings within bright and dark doublets discussed later. Interestingly one can also observe here a non-negligible effect of higher-lying levels on dark-bright exciton energy splitting. Here, the calculation including the -shell only gives the splitting by about meV smaller than that performed in the full -shell basis. The difference between the -shell and the -shell cases is much smaller and varies between to meV, and is somewhat larger for elongated cases.
One could question here the convergence of configuration interaction method with respect to number of shells included. In fact I will try to address this problem in a future work, however currently accounting for shells even higher than is prohibitively numerically demanding. For the dark-bright exciton splitting a rough estimate of such error would be about eV, still much smaller than the absolute value of the dark-bright exchange splitting.
Next, Fig. 7 shows the splitting of the bright exciton (the fine structure splitting) as a function of the deformation.
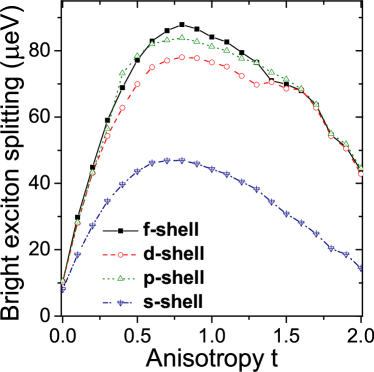
One observes here two characteristic and peculiar features. Firstly, there is again a significant difference between configuration interaction results when accounting for different shells. A ”customary” approach with -shell only reproduces well the general trend, but quite importantly it strongly underestimates the magnitude of the splitting giving about half of it. Addition of higher energy configurations has little effect for weakly deformed systems, e.g. for a cylindrical case (where the fine structure splitting is present due to low lattice symmetry, despite the cylindrical shape) the contribution from the -shell equals to V and is a dominating the total splitting equal to V. However the importance of higher levels is pronounced for elongated systems and it can be intuitively understood since the reduced symmetry would seem to promote increased mixing between configurations. For a moderately deformed nanostructures and parameter value between about and the fine structure splitting dependence on the number of included shells is far from trivial, e.g. the addition of -shell apparently reduces the bright exciton splitting compared to -shell inclusion only. Interestingly for larger deformations () addition of higher shells (above the -shell) has a small effect on the splitting. For the largest considered deformation the contribution due to -shell only gives splitting of eV, addition of the -shell increases the splitting by additional eV giving the total splitting of eV, further addition of - and curiously decreases the splitting, yet by mere eV. It thus appears that for elongated cases most of the splitting is given by accounting for the ground, first and second excited electron and hole levels whereas the ground state orbitals give as little as of the contribution to the splitting.
Moreover our previous results demonstrate the that bright exciton splitting is also a sensitive function of overall nanostructure volume (height and length) as well as intermixing effects due to alloying in the surrounding barrier.
Apart from observations regarding the correlations due to different shells the next key effect is the trend of fine structure evolution itself. At first the splitting goes up quasi-linearly with following predictions based on the effective mass approximation Kadantsev and Hawrylak (2010) and anisotropy related mixing of quantum dot heavy-hole states. However with the increase of the deformation the trend seems to flatten-up, and it saturates with a plateau ( eV) at about equal to . More curiously with further shape deformation the fine structure splitting on Fig. 7 is reduced with anisotropy: a trend clearly contradicting an simple intuition.
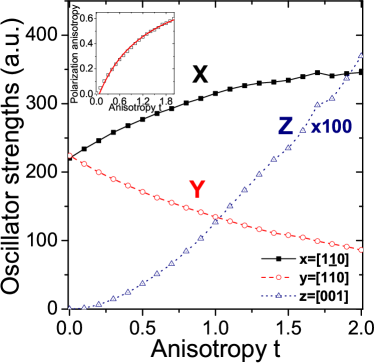
In order to analyze this effect further let us focus our attention on the excitonic emission spectra. Fig. 8 shows emission from two bright excitonic states in form of two and linearly polarized lines. line corresponds to lower energy bright exciton, whereas to higher energy bright exciton state. For case there is only a small intensity difference between these two lines due to the presence of anisotropic crystal lattice and strain. Zieliński (2013a) For the dominant oscillator strength comes from polarization, following thus an elongation axis, whereas for the polarized line the oscillator strength is reduced with elongation, with the ratio going from for to over for . The growth of -polarized line oscillator strength is thus strictly followed by the decrease in -polarized line oscillator strength. Curiously the dependence on elongation can be approximately described by a following linear relation . A more established measure of polarization anisotropy is polarization degree shown (black/empty squares) on the inset on Fig. 8. Polarization degree dependence on elongation ratio can be well described by a simple following relation: . A more accurate formula can be found by a fitting with t), shown as a red line on the inset on Fig. 8. Such a simple relation between polarization anisotropy and elongation suggest that there maybe a single dominant factor strongly affecting the spectra.
It is often assumed Bayer et al. (2002) that structural quantum dot elongation will lead to mixing of the bright exciton states and , where corresponds to heavy-hole spin projection, and are electron spin projections. Such mixing would lead to the bright exciton splitting and presence of two orthogonal lines of linear polarization. However mixing of pure heavy-hole states seem not to be sufficient to describe strong polarization anisotropy as observed here. Recently several authors Smoleński et al. (2012); Tonin et al. (2012); E.Tsitsishvili (2017); Léger et al. (2007) have suggested a mechanism in which lateral anisotropy would effectively induce heavy-hole/light-mixing, with the bright excitons states given as:
| (3) |
thus effectively add-mixing exciton state heavy-hole component with a light-hole component of opposite projection , and correspondingly mixing with . is a measure of that mixing, and the polarization anisotropy due to mixing can be descried as:Tonin et al. (2012); Léger et al. (2007)
| (4) |
We can use a fit to the above equation in order to effectively retrieve from our atomistic calculations of the polarization degree.
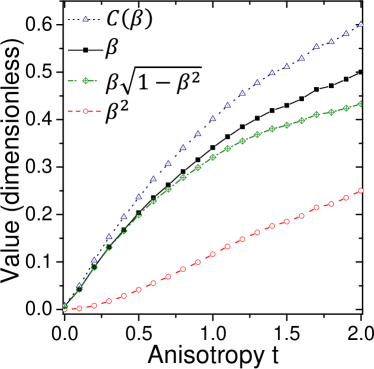
The results are shown on Fig. 9, with increasing monotonically with the deformation and reaching considerable value of about for the largest considered deformation. My previous Zieliński (2013c) calculations for cylindrical nanowire quantum dots indicate that further increase of aspect ratio could in fact lead to a formation of a light-hole dominated exciton, however the analysis of light-hole excitons goes beyond the scope of current work. Additionally and contrary to tall (high vertical aspect ratio) nanowire quantum dots Zieliński (2013c) the orbital contribution of single particle states in flat ( nm of height) nanostructure is not changed much with the deformation (for the ground hole state in particular; see the discussion earlier and the Appendix) and the large content corresponds to a change in the envelope character of the hole wave-function, rather than in its microscopic part. Here the term ”envelope” was borrowed from the language of the continuous media approximation (and methods such as the effective mass approach) and it should be used with a great caution since the notion of ”envelope” is not present in the linear combination of atomic orbitals (LCAO) approach utilized by the tight-binding method.
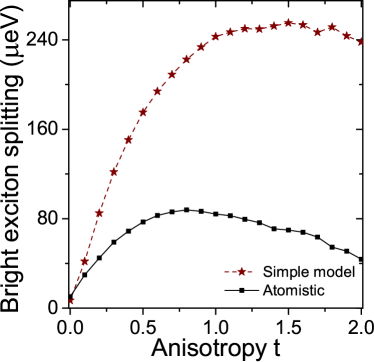
Let us now come back to the matter of the bright exciton spectra as discussed above and shown earlier on Fig. 7. For clarity we plot this splitting (for -shell case only; solid-line/squares) again on Fig. 10, yet this time compared with simple model estimation (dashed line/starts) based on recent work by Tsitsishvili E.Tsitsishvili (2017), where the bright exciton splitting in case of significant light-hole add-mixture could be given , where is the ”usual” (i.e. non-anisotropic) electron-hole exchange, related to dark-bright exciton splitting shown previously on Fig. 6. The dependence term is shown on Fig. 9, where it is compared with and and it shows sub-linear dependence on . This term is then multiplied by the dark-bright exciton splitting , which I reiterate gets reduced with the increasing deformation (Fig. 6). Hence for elongated systems there are two opposing effects. The first is the increasing () contribution due to light-hole add-mixture that leads to the increase of the splitting. The second opposing effect is the decreasing value of the electron-hole overlap leading to a reduction of the dark-bright exciton splitting. These two effects combined together lead first to the growth of the bright exciton splitting with the deformation, then its saturation and then the decrease of the splitting with even further elongation. The simple model, combined with input from the atomistic calculation ( and from excitonic energy and emission spectra correspondingly) is thus able to qualitatively explain the behaviour of the bright exciton in highly-elongated system, yet we should also emphasize it is only a qualitative agreement. The phenomenological model overestimates the value of splitting by a large factor (typically over ) and the fully atomistic calculation is needed for the qualitative prediction of the splitting magnitude.
Based on the above one can conclude that the strong admixture of light-hole component could explain polarization properties of the bright excitons and their splitting in strongly elongated systems, moreover it turns out that light-excitons would also have a pronounced effect on the dark exciton proprieties. My calculations indicate that with an increasing deformation one of the dark excitons gets a non-negligible oscillator strength, shown on Fig. 8 as (out-of-plane) polarized line, with magnitude reaching considerable (about ) fraction of the -polarized bright exciton emission. This dark exciton non-zero optical activity comes from higher energy dark exciton state, where the other (low energy) state remains fully dark, consistent with group-theoretical predictions for heavy-hole dominant quantum dots. Dupertuis et al. (2011); Karlsson et al. (2010) It should be noted however that such large dark exciton optical activity is orders of magnitude stronger than that observed for weakly deformed quantum dots. Korkusinski and Hawrylak (2013); Zieliński (2013a) In a phenomenological model accounting for the light-hole exciton add-mixture to the dark exciton state, Smoleński et al. (2012); E.Tsitsishvili (2017) the magnitude of the dark exciton activity should Smoleński et al. (2012) follow dependence. This is in fact qualitatively consistent with our results: with -polarized line on Fig. 8 and on Fig. 9 showing qualitatively the same behaviour. We note here that such pronounced optical activity of the dark of exciton could have potential applications in quantum information and computation Schwartz et al. (2015a, b); Zieliński et al. (2015a) since the dark state is both long-lived and optically addressable at the same time, and its properties could be likely be tailored by the degree of nanostructure elongation.
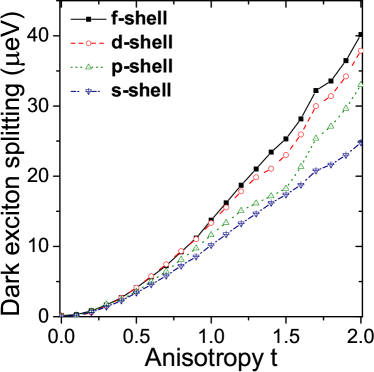
Apart from the optical activity, it is instructive to study the dark exciton splitting as shown on Fig. 11. The dark exciton splitting goes from a small value of eV for a cylindrical system to a substantial splitting exceeding eV for . One should notice that this is an extraordinarily large dark exciton splitting, comparable with that of the bright exciton. Based on a simple model E.Tsitsishvili (2017) one can expect the dark exciton splitting to grow proportionally to (and thus to ), due the admixture of the light-hole exciton add-mixture to the dark exciton state. Therefore a substantial content of the light-hole exciton will have a dramatic impact on the dark exciton properties, including the dark exciton splitting. One can observe however yet another effect that cannot be easily captured even qualitatively by a simple model. Namely, for deformations larger than exciton one can notice the increasing role of higher-lying shells, with the magnitude of dark exciton splitting increasing progressively with the admixture of these shells. This leads to a general trend of the dark exciton emission resemble more quadratic-like behaviour as a function of with -shell included, and more linear-like for the -shell included only.
To summarize this section let me note that the calculated range (from to eV) of the bright exciton splittings falls reasonably well within the range of values observed experimentally Mrowiński et al. (2016a) for large-aspect ratio quantum dashes emitting at around meV (i.e. from about to nearly eV). However I emphasize that in this work I do not aim at the direct comparison with a particular quantum dash or quantum dot experiment, but rather focus on an analysis of general trends with shape elongation. Moreover a detailed comparison with a particular experiment Mrowiński et al. (2016a) should include a comprehensive knowledge of nanostructure’s morphology, which is often near impossible to obtain. Dery et al. (2004); Sauerwald et al. (2005); Khan et al. (2014); Mlinar et al. (2009) Nevertheless one can speculate here that obtained results strongly suggest that is is unlikely for elongated quantum dashes to achieve a very small fine structure splitting unless other phenomena such as alloying due to annealing or composition intermixing are included into the consideration Olbrich et al. (2017); Jung et al. (2018) or external fields are applied. Mrowiński et al. (2015) Otherwise growers should aim for non-elongated Kors et al. (2018) or weakly elongated nanostructures, where small elongation along axis Zieliński (2013a) should lead to the reduced fine structure splitting, by minimizing the anisotropic contribution due to strain. One the other hand the profoundly increased dark exciton states optical activity in highly-elongated systems could in principle open new routes for quantum dashes applications including entanglement generation via the time-bin approach Simon and Poizat (2005); Weihs et al. (2017) or by utilizing the dark exciton as a optically addressable quantum bit. Poem et al. (2010); Schwartz et al. (2015a, b); Zieliński et al. (2015a)
IV Excitonic complexes
Besides a single exciton is it instructive to study spectral properties of excitonic complexes, i.e. positively (), and negatively () charged excitons, and the biexciton (). Understanding of the biexciton spectra is particularly relevant from applications point of view since in various schemes Benson et al. (2000); Weihs et al. (2017) its plays an essential role for the entanglement generation.
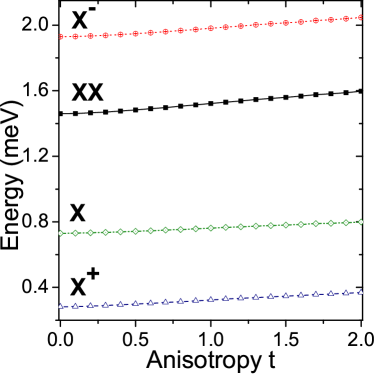
The ground states energies of these complexes are presented on Fig. 12, and they show a weak monotonic, increasing trend with , similar to that of the single exciton () shown previously on Fig. 5, and presented here as well for the purpose of comparison. Contrary to a single exciton, in an optical experiment it is not straightforward to measure directly ground state energies, but one rather studies transition energies. Therefore Fig. 13 shows the evolution of binding energies of , , and as a function of shape deformation . Similarly to a photoluminescence experiment these binding energies were calculated with respect to the single exciton. For a case of this means the optical recombination leaving as a final state. The energy of this bright optical transition (i.e. ) is then compared with that of the bright exciton to define the binding energy of a complex. The binding energy measures thus the energetic difference between bright lines from recombining , , complexes and the lowest bright state.
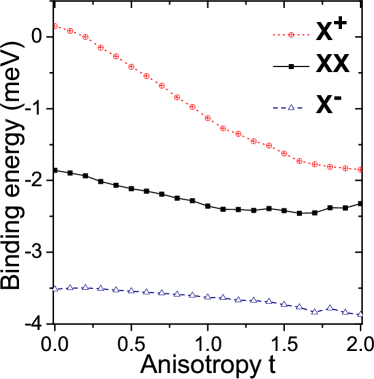
Depending on the nature of a complex, their binding energy spectra reveal a different behaviour, with the and showing only a weak change with the shape elongation. The binding energy varies from about to about meV, similar to our earlier results Mrowiński et al. (2016a) obtained for quantum dashes with triangular cross-sections. Whereas the is more bound with the binding energy changing from to nearly meV for the largest considered deformation. Here I utilize a convention in which a negatively bound complex has emission energy lower than the bright single exciton state.
The positively charged exciton shows a much more pronounced trend with the shape elongation. Its binding energy goes form a small positive value of meV for a cylindrical system to nearly about meV for . It is curious to analyze such different behavior of , and since and differ by a presence of an additional hole, one can speculate that the difference between all these excitonic species is related to the hole state properties.
On a more formal ground one can estimate these binding energies in terms of Coulomb integrals calculated for an electron and a hole in their ground states and : Gong et al. (2008); Zieliński et al. (2015b); Zieliński (2012c)
| (5) |
where are electron-electron, hole-hole, and electron-hole Coulomb integrals mentioned above, are (negative) corrections due to correlation (and exchange) effects, and accounted for by the exact diagonalization (configuration interaction). Similarly to experiments Mrowiński et al. (2016a) the recombination process happens between the initial (e.g. ) and a final (e.g. ) state of two different excitonic complexes.
The above formula should in principle help us to understand properties of excitonic complexes in terms of contributions from selected Coulomb integrals, which are shown on Fig. 14.
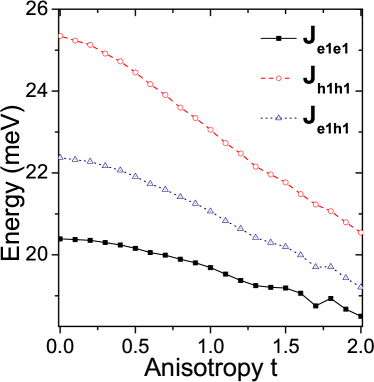
The hole-hole repulsion is reduced by about meV with the anisotropy, whereas the electron-electron repulsion is reduced by a meV factor only, and the electron-hole attraction shows an intermediate trend (sign of was set as positive according to convention used in Eq. 5). The pronounced change of an integral involving hole state suggests that the hole is apparently more prone to the reduction of lateral confinement (shrinking) in the direction, perpendicular to the shape elongation in . Although likely oversimplified this is consistent with charge density plots shown earlier on Fig. 4, where seems to be more localized in the nanostructure for elongated cases, whereas tends to leak out, thus partially overcoming the effect of elongation.
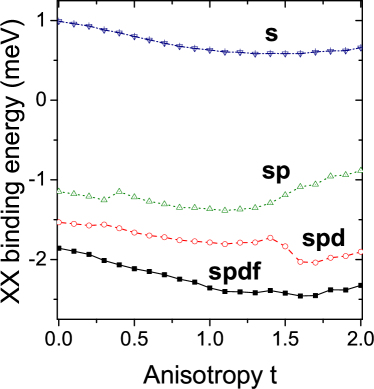
The strongly decreasing value of integral combined with formula (from Eq. 5) seems to be able to qualitatively explain the strong evolution with the deformation, and also weak changes of and states. However the simple estimations based solely on the ground state properties are not able to address the overall binding energy of excitonic complexes. This is well illustrated on Fig. 15, where the binding energy was calculated by using different number of electron and hole levels accounted for in the configuration interaction calculation. The -shell calculation effectively corresponds to Eq. 5 with correction due to correlations set to zero. Whereas the overall trend with the deformation does not change strongly between different approaches, only inclusion of ,, and -shells seems to produce binding energy reaching meV in a reasonable agreement with the experiment. Mrowiński et al. (2016a, b)
For the case including the -shell, the correction to binding energy due to correlations is equal to about meV for all considered values. However it should be emphasized again that the correction due to correlations () in the binding energy in the recombination process is affected by both the correlations in the initial state () and the final states (). Correlations in the initial state, i.e. in the ground state (Fig. 16), shift down its energy by meV for as compared to a single electron-hole -shell configuration. This correction grows with the deformation and reaches a substantial meV for . A pronounced ground state energy shift due to configuration mixing is also well known in standard, non-elongated quantum dots Jacak et al. (1998), and is a key factor determining binding energy in the emission spectra. Yet the magnitude of this correction reaching meV is far larger than in typical self-assembled quantum dots.
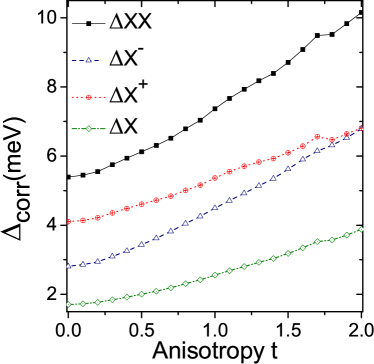
Moreover here differently from cylindrical systems the correlation correction is also present and non-negligible in a final, single exciton state. This effect was briefly mentioned in the earlier part of this paper (inset on Fig. 5), with correlation correction reaching considerable value of meV for a single exciton in its ground state and . In elongated systems correlations thus have a strong effect on both (initial) and (final) states, and in both these of excitonic species, these correction increase their magnitudes with the deformation. Yet effectively in recombination spectra case these terms partially cancel out, leading to apparently stable biexciton binding energy with the elongation. Finally, I speculate the that addition of higher excited electron and hole levels (currently prohibited by numerical complexity) would likely further reduce the binding energy closer to the experimentally observable values, i.e. about meV.
V Summary
An increasing nanostructure shape anisotropy leads to transition from a cylindrical quantum dot to an heavily-elongated quantum dash. In this work this transition was shown to have a strong impact on both the single particle and many-body properties of such systems. As expected, the shape deformation leads to an increasing splitting of the bright exciton, however at a certain aspect ratio the splitting saturates and peculiarly it is reduced with the further elongation. The emission from the bright exciton is characterized as well by a strong degree of polarization anisotropy. The magnitudes of fine structure splitting ( eV) as well the polarization degree of up to , obtained here by atomistic calculations, compare well with experimental data for InAs/InP quantum dashes, even though we did not focus on alloying (mixed composition) effects always present in epitaxial systems. The main spectral features of strongly elongated systems can be also qualitatively explained in terms of a simple model assuming anisotropy induced contribution of a light-hole exciton to a heavy-hole dominated excitonic ground state. This contribution affects the dark excitonic states as well, leading to a dark exciton splitting growing proportionally with the shape deformation, and the magnitude of splitting reaching comparable values to that of the bright exciton. Moreover the dark exciton gains a very significant increase of its optical activity getting to about of the dominant bright exciton line. The shape elongation was further found to have a strong impact on correlation effects in these nanostructures. The add-mixture of higher, excited (often with tails in the wetting layer) electron and hole states (up to the -th level corresponding the -shell of a cylindrical quantum dot) has a pronounced effect on the ground excitonic complexes states, magnitudes of dark and bright excitons splitting of the single exciton, as well as binding energies of excitonic complexes. Finally, this paper shows that the control of the degree of elongation (or quantum dot anisotropy) could in principle be used to tailor optical properties of nanostructures in a broad range of values, including cases with a curiously strong optically activity of the dark exciton.
VI Acknowledgment
The author would like to thank Michał Gawełczyk, Krzysztof Gawarecki, and Grzegorz Sęk for insightful discussions. The support from the Polish National Science Centre based on decision No. 2015/18/E/ST3/00583 is kindly acknowledged.
VII Appendix
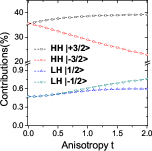
Since the ground hole single particle state has a dominant contribution to several lowest (two dark and two bright) excitons state and due to the importance of heavy-hole/light-hole couplings as discussed above let us inspect atomic orbital coefficients in the tight-binding (LCAO - linear combination of atomic orbitals) expansion of the ground hole state wave-function shown on Fig. 17 (left). One should analyze such plots as Fig. 17 with care and note first that apart from atomic orbital contribution there is an strong ”envelope” contribution which is not straightforward to be retrieved from the tight-binding method, and is not shown on Fig. 17. Either way, inspection of Fig. 17 reveals that (sum of squared moduli) contributions from and orbitals are the same and only weakly depend on the deformations. Combined contribution of lateral orbitals reaches and orbital-wise is a dominant contribution to the wave-function. Moreover one can notice important contribution of about combined from and orbital, which again does not change with the deformation. The elongation however affects orbitals contribution which goes from about for to almost for . Contributions from (and ) are (not surprisingly) much smaller and do not exceed (inset on Fig. 17 (left)). Here corresponds to direction and it must be strongly emphasized that and indices refer to crystal axis and and not to the nanostructure elongations axes and . Since and are equivalent (whereas and are not) hence and contributions must be identical.
The point of presenting Fig. 17 is twofold. First, in simplified models, and contrary to atomistic approaches, one very often neglects contributions to the ground hole state other than from and orbitals. Such approach is apparently doubtful here since the contribution from -orbitals reaches a significant fraction of the entire hole-function charge density. Second, analysis of only selected components can be somewhat misleading. This is emphasized on Fig. 17 (right) where atomic orbitals where combined to form ”atomic” heavy-hole and light-hole combinations (e.g. ) and the sum of their squared moduli over all atoms in the system is plotted as a function of shape-elongation . clearly various with the elongation, whereas separated square moduli of and do not. This reveals an apparent change of phases between and atomic orbitals there was simply not visible in straightforward plots. Next, the contribution grows with the deformation, yet it is present () even for a cylindrical case contrary to assumptions made by simplified approaches. Moreover, the orbital or the light-hole ”atomic” component (constructed from atomic , and orbitals shown on Fig. 17 (right)) reveals only a weak trend with the elongation. Thus the analysis of orbitals or light-hole ”atomic” components only, and the neglect of the overall wave-function character (i.e. spatial charge density distribution) is not sufficient by itself to explain the increase of dark-exciton optical activity by nearly four orders of magnitude.
 |
 |
References
- Anufriev et al. (2015) R. Anufriev, J.-B. Barakat, G. Patriarche, X. Letartre, C. Bru-Chevallier, J.-C. Harmand, M. Gendry, and N. Chauvin, Nanotechnology 26, 395701 (2015).
- Yuan et al. (2011) J. Yuan, H. Wang, R. P. van Veldhoven, J. Wang, T. de Vries, B. Smalbrugge, C. Jin, P. Nouwens, E. J. Geluk, A. Y. Silov, et al., Applied Physics Letters 98, 201904 (2011).
- Benyoucef et al. (2013) M. Benyoucef, M. Yacob, J. Reithmaier, J. Kettler, and P. Michler, Applied Physics Letters 103, 162101 (2013).
- Kors et al. (2017) A. Kors, K. Fuchs, M. Yacob, J. Reithmaier, and M. Benyoucef, Applied Physics Letters 110, 031101 (2017).
- Michler et al. (2000) P. Michler, A. Kiraz, C. Becher, W. V. Schoenfeld, P. M. Petroff, L. Zhang, E. Hu, and A. Imamoglu, Science 290, 2282 (2000).
- Santori et al. (2001) C. Santori, M. Pelton, G. Solomon, Y. Dale, and Y. Yamamoto, Phys. Rev. Lett. 86, 1502 (2001).
- Benson et al. (2000) O. Benson, C. Santori, M. Pelton, and Y. Yamamoto, Phys. Rev. Lett. 84, 2513 (2000).
- Stevenson et al. (2006a) R. M. Stevenson, R. J. Young, P. Atkinson, K. Cooper, D. A. Ritchie, and A. J. Shields, Nature 439, 179 EP (2006a).
- Knill et al. (2001) E. Knill, R. Laflamme, and G. J. Milburn, Nature 409, 46 EP (2001), article.
- Waks et al. (2002) E. Waks, K. Inoue, C. Santori, D. Fattal, J. Vuckovic, G. S. Solomon, and Y. Yamamoto, Nature 420, 762 EP (2002).
- Kok et al. (2007) P. Kok, W. J. Munro, K. Nemoto, T. C. Ralph, J. P. Dowling, and G. J. Milburn, Rev. Mod. Phys. 79, 135 (2007).
- Williams et al. (2001) R. Williams, G. Aers, P. Poole, J. Lefebvre, D. Chithrani, and B. Lamontagne, Journal of crystal growth 223, 321 (2001).
- Kors et al. (2018) A. Kors, J. P. Reithmaier, and M. Benyoucef, Applied Physics Letters 112, 172102 (2018).
- Dalacu et al. (2009) D. Dalacu, A. Kam, D. G. Austing, X. Wu, J. Lapointe, G. C. Aers, and P. J. Poole, Nanotechnology 20, 395602 (2009).
- Versteegh et al. (2014) M. A. M. Versteegh, M. E. Reimer, K. D. Jöns, D. Dalacu, P. J. Poole, A. Gulinatti, A. Giudice, and V. Zwiller, Nat. Commun. 5 (2014).
- Bouwes Bavinck et al. (2012) M. Bouwes Bavinck, M. Zieliński, B. J. Witek, T. Zehender, E. P. A. M. Bakkers, and V. Zwiller, Nano Lett. 12, 6206 (2012).
- Dery et al. (2004) H. Dery, E. Benisty, A. Epstein, R. Alizon, V. Mikhelashvili, G. Eisenstein, R. Schwertberger, D. Gold, J. Reithmaier, and A. Forchel, Journal of applied physics 95, 6103 (2004).
- Sauerwald et al. (2005) A. Sauerwald, T. Kümmell, G. Bacher, A. Somers, R. Schwertberger, J. Reithmaier, and A. Forchel, Applied Physics Letters 86, 253112 (2005).
- Reithmaier et al. (2005) J. P. Reithmaier, A. Somers, S. Deubert, R. Schwertberger, W. Kaiser, A. Forchel, M. Calligaro, P. Resneau, O. Parillaud, S. Bansropun, M. Krakowski, R. Alizon, D. Hadass, A. Bilenca, H. Dery, V. Mikhelashvili, G. Eisenstein, M. Gioannini, I. Montrosset, T. W. Berg, M. van der Poel, J. Mørk, and B. Tromborg, Journal of Physics D: Applied Physics 38, 2088 (2005).
- Reithmaier et al. (2007) J. P. Reithmaier, G. Eisenstein, and A. Forchel, Proceedings of the IEEE 95, 1779 (2007).
- Khan et al. (2014) M. Z. M. Khan, T. K. Ng, and B. S. Ooi, Progress in Quantum Electronics 38, 237 (2014).
- Musiał et al. (2012) A. Musiał, P. Kaczmarkiewicz, G. Sęk, P. Podemski, P. Machnikowski, J. Misiewicz, S. Hein, S. Höfling, and A. Forchel, Physical Review B 85, 035314 (2012).
- Musiał et al. (2014a) A. Musiał, P. Gold, J. Andrzejewski, A. Löffler, J. Misiewicz, S. Höfling, A. Forchel, M. Kamp, G. Sęk, and S. Reitzenstein, Physical Review B 90, 045430 (2014a).
- Gawełczyk et al. (2017) M. Gawełczyk, M. Syperek, A. Maryński, P. Mrowiński, K. Gawarecki, J. Misiewicz, A. Somers, J. Reithmaier, S. Höfling, G. Sęk, et al., Physical Review B 96, 245425 (2017).
- Dusanowski et al. (2017) Ł. Dusanowski, P. Mrowiński, M. Syperek, J. Misiewicz, A. Somers, S. Höfling, J. Reithmaier, and G. Sęk, Applied Physics Letters 111, 253106 (2017).
- Musiał et al. (2014b) A. Musiał, A. Maryński, P. Mrowiński, J. Andrzejewski, P. Machnikowski, J. Misiewicz, A. Somers, S. Höfling, J. Reithmaier, G. Sęk, et al., Physical Review B 90, 125424 (2014b).
- Jung et al. (2018) D. Jung, D. J. Ironside, S. R. Bank, A. C. Gossard, and J. E. Bowers, Journal of Applied Physics 123, 205302 (2018).
- Azouigui et al. (2009) S. Azouigui, B. Dagens, F. Lelarge, J.-G. Provost, D. Make, O. Le Gouezigou, A. Accard, A. Martinez, K. Merghem, F. Grillot, et al., IEEE Journal of Selected Topics in Quantum Electronics 15, 764 (2009).
- Dusanowski et al. (2013) Ł. Dusanowski, M. Syperek, W. Rudno-Rudziński, P. Mrowiński, G. Sęk, J. Misiewicz, A. Somers, J. Reithmaier, S. Höfling, and A. Forchel, Applied Physics Letters 103, 253113 (2013).
- Dusanowski et al. (2014) Ł. Dusanowski, M. Syperek, P. Mrowiński, W. Rudno-Rudziński, J. Misiewicz, A. Somers, S. Höfling, M. Kamp, J. Reithmaier, and G. Sęk, Applied Physics Letters 105, 021909 (2014).
- Mrowiński et al. (2018) P. Mrowiński, M. Emmerling, C. Schneider, J. Reithmaier, J. Misiewicz, S. Höfling, and G. Sęk, Physical Review B 97, 165427 (2018).
- Mrowiński et al. (2015) P. Mrowiński, A. Musiał, A. Maryński, M. Syperek, J. Misiewicz, A. Somers, J. Reithmaier, S. Höfling, and G. Sęk, Applied Physics Letters 106, 053114 (2015).
- Bayer et al. (2002) M. Bayer, G. Ortner, O. Stern, A. Kuther, A. A. Gorbunov, A. Forchel, P. Hawrylak, S. Fafard, K. Hinzer, T. L. Reinecke, S. N. Walck, J. P. Reithmaier, F. Klopf, and F. Schäfer, Phys. Rev. B 65, 195315 (2002).
- Langbein et al. (2004) W. Langbein, P. Borri, U. Woggon, V. Stavarache, D. Reuter, and A. Wieck, Physical Review B 69, 161301 (2004).
- Young et al. (2005) R. Young, R. Stevenson, A. Shields, P. Atkinson, K. Cooper, D. Ritchie, K. Groom, A. Tartakovskii, and M. Skolnick, Physical Review B 72, 113305 (2005).
- Akopian et al. (2006) N. Akopian, N. Lindner, E. Poem, Y. Berlatzky, J. Avron, D. Gershoni, B. Gerardot, and P. Petroff, Physical Review Letters 96, 130501 (2006).
- Hafenbrak et al. (2007) R. Hafenbrak, S. Ulrich, P. Michler, L. Wang, A. Rastelli, and O. Schmidt, New Journal of Physics 9, 315 (2007).
- Olbrich et al. (2017) F. Olbrich, J. Höschele, M. Müller, J. Kettler, S. Luca Portalupi, M. Paul, M. Jetter, and P. Michler, Applied Physics Letters 111, 133106 (2017).
- Singh and Bester (2009) R. Singh and G. Bester, Phys. Rev. Lett. 103, 063601 (2009).
- Karlsson et al. (2010) K. F. Karlsson, M. A. Dupertuis, D. Y. Oberli, E. Pelucchi, A. Rudra, P. O. Holtz, and E. Kapon, Phys. Rev. B 81, 161307 (2010).
- Dupertuis et al. (2011) M. A. Dupertuis, K. F. Karlsson, D. Y. Oberli, E. Pelucchi, A. Rudra, P. O. Holtz, and E. Kapon, Phys. Rev. Lett. 107, 127403 (2011).
- Kowalik et al. (2005) K. Kowalik, O. Krebs, A. Lemaitre, S. Laurent, P. Senellart, P. Voisin, and J. Gaj, Applied Physics Letters 86, 041907 (2005).
- Bennett et al. (2010) A. Bennett, M. Pooley, R. Stevenson, M. Ward, R. Patel, A. B. de La Giroday, N. Sköld, I. Farrer, C. Nicoll, D. Ritchie, et al., Nature Physics 6, 947 (2010).
- Stevenson et al. (2006b) R. Stevenson, R. Young, P. See, D. Gevaux, K. Cooper, P. Atkinson, I. Farrer, D. Ritchie, and A. Shields, Physical Review B 73, 033306 (2006b).
- Gerardot et al. (2007) B. Gerardot, S. Seidl, P. Dalgarno, R. J. Warburton, D. Granados, J. Garcia, K. Kowalik, O. Krebs, K. Karrai, A. Badolato, et al., Applied Physics Letters 90, 041101 (2007).
- Seidl et al. (2006) S. Seidl, M. Kroner, A. Högele, K. Karrai, R. J. Warburton, A. Badolato, and P. M. Petroff, Applied Physics Letters 88, 203113 (2006).
- Ding et al. (2010) F. Ding, R. Singh, J. Plumhof, T. Zander, V. Křápek, Y. Chen, M. Benyoucef, V. Zwiller, K. Dörr, G. Bester, et al., Physical review letters 104, 067405 (2010).
- Trotta et al. (2012) R. Trotta, E. Zallo, C. Ortix, P. Atkinson, J. Plumhof, J. Van den Brink, A. Rastelli, and O. Schmidt, Physical review letters 109, 147401 (2012).
- Schwartz et al. (2015a) I. Schwartz, D. Cogan, E. R. Schmidgall, L. Gantz, Y. Don, M. Zieliński, and D. Gershoni, Phys. Rev. B 92, 201201 (2015a).
- Schwartz et al. (2015b) I. Schwartz, E. R. Schmidgall, L. Gantz, D. Cogan, E. Bordo, Y. Don, M. Zielinski, and D. Gershoni, Phys. Rev. X 5, 011009 (2015b).
- Zieliński et al. (2015a) M. Zieliński, Y. Don, and D. Gershoni, Phys. Rev. B 91, 085403 (2015a).
- Simon and Poizat (2005) C. Simon and J.-P. Poizat, Phys. Rev. Lett. 94, 030502 (2005).
- Weihs et al. (2017) G. Weihs, T. Huber, and A. Predojević, in Quantum dots for quantum information technologies (Springer, 2017) pp. 267–284.
- Mrowiński et al. (2016a) P. Mrowiński, M. Zieliński, M. Świderski, J. Misiewicz, A. Somers, J. P. Reithmaier, S. Höfling, and G. Sęk, Phys. Rev. B 94, 115434 (2016a).
- Zieliński et al. (2015b) M. Zieliński, K. Gołasa, M. R. Molas, M. Goryca, T. Kazimierczuk, T. Smoleński, A. Golnik, P. Kossacki, A. A. L. Nicolet, M. Potemski, Z. R. Wasilewski, and A. Babiński, Phys. Rev. B 91, 085303 (2015b).
- Maryński et al. (2013) A. Maryński, G. Sęk, A. Musiał, J. Andrzejewski, J. Misiewicz, C. Gilfert, J. Reithmaier, A. Capua, O. Karni, D. Gready, et al., Journal of Applied Physics 114, 094306 (2013).
- Mlinar et al. (2009) V. Mlinar, M. Bozkurt, J. M. Ulloa, M. Ediger, G. Bester, A. Badolato, P. M. Koenraad, R. J. Warburton, and A. Zunger, Phys. Rev. B 80, 165425 (2009).
- Salter et al. (2010) C. Salter, R. Stevenson, I. Farrer, C. Nicoll, D. Ritchie, and A. Shields, Nature 465, 594 (2010).
- Santori et al. (2002) C. Santori, D. Fattal, J. Vučković, G. S. Solomon, and Y. Yamamoto, Nature 419, 594 (2002).
- Gérard et al. (1998) J. Gérard, B. Sermage, B. Gayral, B. Legrand, E. Costard, and V. Thierry-Mieg, Physical review letters 81, 1110 (1998).
- Peter et al. (2005) E. Peter, P. Senellart, D. Martrou, A. Lemaître, J. Hours, J. Gérard, and J. Bloch, Physical review letters 95, 067401 (2005).
- Mrowiński et al. (2016b) P. Mrowiński, K. Tarnowski, J. Olszewski, A. Somers, M. Kamp, J. P. Reithmaier, W. Urbańczyk, J. Misiewicz, P. Machnikowski, and G. Sęk, Journal of Applied Physics 120, 074303 (2016b).
- Kadantsev and Hawrylak (2010) E. Kadantsev and P. Hawrylak, Phys. Rev. B 81, 045311 (2010).
- Zieliński (2013a) M. Zieliński, Phys. Rev. B 88, 155319 (2013a).
- Rudno-Rudziński et al. (2006) W. Rudno-Rudziński, R. Kudrawiec, P. Podemski, G. Sęk, J. Misiewicz, A. Somers, R. Schwertberger, J. Reithmaier, and A. Forchel, Applied physics letters 89, 031908 (2006).
- Keating (1966) P. N. Keating, Phys. Rev. 145, 637 (1966).
- Martin (1970) R. M. Martin, Phys. Rev. B 1, 4005 (1970).
- Jaskólski et al. (2006) W. Jaskólski, M. Zieliński, G. W. Bryant, and J. Aizpurua, Phys. Rev. B 74, 195339 (2006).
- Pryor et al. (1998) C. Pryor, J. Kim, L. W. Wang, A. J. Williamson, and A. Zunger, J. Appl. Phys. 83, 2548 (1998).
- Saito and Arakawa (2002) T. Saito and Y. Arakawa, Physica E 15, 169 (2002).
- Zieliński et al. (2010) M. Zieliński, M. Korkusinski, and P. Hawrylak, Phys. Rev. B 81, 085301 (2010).
- Zieliński (2012a) M. Zieliński, Phys. Rev. B 86, 115424 (2012a).
- Zieliński (2013b) M. Zieliński, J. Phys.: Condens. Matter 25, 465301 (2013b).
- Bester et al. (2006a) G. Bester, X. Wu, D. Vanderbilt, and A. Zunger, Phys. Rev. Lett. 96, 187602 (2006a).
- Bester et al. (2006b) G. Bester, A. Zunger, X. Wu, and D. Vanderbilt, Phys. Rev. B 74, 081305 (2006b).
- Beya-Wakata et al. (2011) A. Beya-Wakata, P.-Y. Prodhomme, and G. Bester, Phys. Rev. B 84, 195207 (2011).
- Chadi (1977) D. J. Chadi, Phys. Rev. B 16, 790 (1977).
- Jancu et al. (1998) J.-M. Jancu, R. Scholz, F. Beltram, and F. Bassani, Phys. Rev. B 57, 6493 (1998).
- Lee et al. (2004) S. Lee, F. Oyafuso, P. von Allmen, and G. Klimeck, Phys. Rev. B 69, 045316 (2004).
- Zieliński (2012b) M. Zieliński, Acta Phys. Pol. A 122, 312 (2012b).
- Michler (2003) P. Michler, ed., Topics in Applied Physics, Vol. 90 (Springer, New York, 2003).
- Zieliński (2013c) M. Zieliński, Phys. Rev. B 88, 115424 (2013c).
- Różański and Zieliński (2016) P. T. Różański and M. Zieliński, Phys. Rev. B 94, 045440 (2016).
- Jacak et al. (1998) L. Jacak, P. Hawrylak, and A. Wojs, Quantum Dots (Springer, Berlin, 1998).
- Note (1) Please note the reversed order of hole levels with respect to the electron.
- Smoleński et al. (2012) T. Smoleński, T. Kazimierczuk, M. Goryca, T. Jakubczyk, Ł. Kłopotowski, Ł. Cywński, P. Wojnar, A. Golnik, and P. Kossacki, Physical Review B 86, 241305 (2012).
- Tonin et al. (2012) C. Tonin, R. Hostein, V. Voliotis, R. Grousson, A. Lemaitre, and A. Martinez, Phys. Rev. B 85, 155303 (2012).
- E.Tsitsishvili (2017) E.Tsitsishvili, Physica E: Low-dimensional Systems and Nanostructures (2017).
- Léger et al. (2007) Y. Léger, L. Besombes, L. Maingault, and H. Mariette, Phys. Rev. B 76, 045331 (2007).
- Korkusinski and Hawrylak (2013) M. Korkusinski and P. Hawrylak, Phys. Rev. B 87, 115310 (2013).
- Poem et al. (2010) E. Poem, Y. Kodriano, C. Tradonsky, N. H. Lindner, B. D. Gerardot, P. M. Petroff, and D. Gershoni, Nat. Phys. 6, 993 (2010).
- Gong et al. (2008) M. Gong, K. Duan, C.-F. Li, R. Magri, G. A. Narvaez, and L. He, Phys. Rev. B 77, 045326 (2008).
- Zieliński (2012c) M. Zieliński, Nanoscale Research Letters 7, 265 (2012c).