The Mass of the Cepheid V350 Sgr11affiliation: Based on observations with the NASA/ESA Hubble Space Telescope obtained at the Space Telescope Science Institute, which is operated by the Association of Universities for Research in Astronomy, Inc., under NASA contract NAS5-26555.
Abstract
V350 Sgr is a classical Cepheid suitable for mass determination. It has a hot companion which is prominent in the ultraviolet and which is not itself a binary. We have obtained two high resolution echelle spectra of the companion at orbital velocity maximum and minimum with the Hubble Space Telescope (HST) Space Telescope Imaging Spectrograph (STIS) in the 1320 to 1510 Å region. By cross-correlating these spectra we obtained the orbital velocity amplitude of the companion with an uncertainty in the companion amplitude of 1.9 km sec-1. This provides a mass ratio of the Cepheid to the companion of 2.1. The ultraviolet energy distribution of the companion provides the mass of the companion, yielding a Cepheid mass of 5.2 0.3 M⊙. This mass requires some combination of moderate main sequence core convective overshoot and rotation to match evolutionary tracks.
1 Introduction
Masses are the most fundamental parameter governing the evolution of single stars. Interactions between stars in binary/multiple systems can, of course, alter a mass in interesting ways. The tension between the masses derived from evolutionary calculations and those from pulsation calculations has been designated “the Cepheid mass problem”. A good summary of the differences and the recent state is provided in Neilson, et al (2011), who conclude that it still exists at the 10-20% level. This implies uncertainty in the evolutionary predictions of luminosity for post-main sequence He burning stars. For classical Cepheids evolutionary calculations are also important in making any adjustments needed to the Leavitt (Period-Luminosity) Law for differences in metallicity between galaxies.
Observed masses are needed to clarify these questions. In the Milky Way (MW) there are no Cepheids known in eclipsing binaries. The advent high resolution spectra in the ultraviolet (UV) from satellite observations (originally the International Ultraviolet Explorer [IUE] and currently the Hubble Space Telescope [HST]) has provided orbital velocity amplitudes of the hot companions of several Cepheids. Combining this amplitude with the ground-based orbital velocity amplitude for the Cepheid, and a mass of the companion from the energy distribution in the ultraviolet provides a Cepheid mass. In addition, a dynamical mass has been determined for Polaris using HST astrometry (Evans, et al. 2008, 2018). An upper limit to the mass for W Sgr has been derived from HST astrometry. A summary of the references and results is provided by Evans, et al. (2011). In several cases improved masses are anticipated soon, largely because of the incorporation of interferometry to provide additional resolved orbits. The first result of this program is V1334 Cyg (Gallenne, et al. 2018).
Not only is the determination of masses in the MW improving, an additional valuable comparison has become possible with Cepheids in the Large Magellanic Cloud (LMC). Several eclipsing binaries have been discovered in the LMC (Gieren, et al. 2015; Pilecki, et al. 2013; Pilecki, et al. 2015; summarized by Pilecki et al 2018). Thus a comparison of the mass luminosity relation can be made at two metallicities.
The first step in mass determination is the derivation of a binary orbit for the primary (Cepheid) from ground-based spectra, which is available for many stars. An early result from UV studies of the companions is that a substantial fraction of the companions are themselves binaries (e.g. Evans, et al. 2005). This is to be expected in high and intermediate mass systems, but the additional observations needed to determine a mass are often prohibitively expensive of telescope time.
The system containing the Cepheid V350 Sgr = HD 173297 is one where previous UV observations found the companion to be single. It was observed twice with the HST Goddard High Resolution Spectrograph (GHRS) medium resolution (R = / 20,000) between 1840 and 1880 Å in 1995 (Evans, et al. 1997). From the velocity difference between phases of these two spectra, and the velocity difference from the Cepheid orbit, they derived a mass ratio = 2.1 0.3. Using the mass from the UV energy distribution of the companion (B9.0 V; Evans and Sugars 1997), they derived a mass for the Cepheid of 5.2 0.9 M⊙.
Since that discussion, a number of factors have contributed to an improved analysis of the system. A new orbit has been derived based on considerable additional velocity data (Evans, et al. 2011), particularly including data near minimum velocity. Because the orbital period is very close to 4 years, uniform phase coverage has been difficult to obtain. In the project here HST spectra obtained with the Space Telescope Imaging Spectrograph (STIS) are combined with this new orbit, providing improved velocities of the companion as discussed in the next section. Successive sections below discuss the observations, the details of velocity measurement from these spectra, the companion, and the results and implications of the new measurements.
Gaia will, of course, ultimately be important in improving the distance and mass. However, the current DR2 release does not include binary motion in the solution. To illustrate, the expected parallax based on the distance from the Benedict et al. (2007) Leavitt law is 1.12 mas. The semi-major axis of the orbit (Evans, et al. 2011) a sin i is 1.32 AU, which is 1.48 mas at this distance. Hence the Gaia solution including orbital motion is clearly needed. Because of this, and also concerns about the effect of Cepheid light variation and possibly the brightness of the system, the appropriate solution will come with later Gaia releases.
2 Observations
STIS observations were obtained in HST Cycles 21 and 23, sampling orbital velocity maximum and minimum. The STIS spectra provide several improvements over the GHRS spectra. The high resolution echelle mode was used (E140H resolution 114,000 in place of the GHRS G200M resolution of 20,000). The much larger wavelength range (1320 to 1510 Å) provided many more spectral lines for the velocity measurement. Finally, the new orbit resulted in phases selected for better optimization of the velocity amplitude measurement. The observations are summarized in Table 1, which includes the orbital velocity of the Cepheid at the time of the observations.
To sumarize the observations we provide the schematic in Fig 1. The Cepheid orbit is from Evans, et al. 2011; the orbit of the companion anticipates the result of this paper for the orbital velocity ratio. The phases of the STIS observations and the previous GHRS observations are shown. For the best velocity accuracy, we have cross-correlated the two STIS spectra to derive the velocity difference between the two, rather than using a template of a different star to determine the velocity of each individual star. Previous experience has shown that cross-correlation between two observations of the same star produces much better defined results, particularly for weak spectra, since the lines have the the same abundances, rotation velocity, and microturbulence. Thus, Fig 1 is a schematic to indicate the phases of the observations, but not measured velocities.
Using these observations, the reductions were done as described in the next section. The velocity difference measured for the companion was compared with that of the Cepheid at the same phases to determine the mass ratio between the two stars. To determine the mass of the Cepheid, the mass of the companion is needed. Since it is on the main sequence, the companion mass is comparatively well known, and an ultraviolet spectrum provides an energy distribution. The determination of the companion mass now includes both updated masses from eclipsing binaries (Torres, et al. 2010), as well as comparison with recent model atmospheres (Bohlin, et al. 2017). To summarize, comparisons were made with other Cepheid masses in the MW and the LMC.
| Year | Dates | JD | VrorbCep | |
|---|---|---|---|---|
| -2,400,000 | km s-1 | |||
| 2013 | Oct. 1-5 (Oct 3) | 56599 | 0.123 | 11.1 |
| 2016 | Aug. 23-28 (Aug 25) | 57625 | 0.819 | -9.9 |

3 Reductions
The two sets of observations of V350 Sgr each consist of 12 individual spectra, which each contain 40 echelle orders, covering 1320Å to 1510Å. The flux calibration of the STIS echelle gratings is sensitive to changes in the alignment of the echelle blaze function (Bowers and Lindler 2003). Misregistration of these blaze functions can impose artificial patterns on the calibrated flux for each spectral order. This is particularly problematic when attempting to cross correlate spectra taken at different times, since for broad-lined stars the change in spectral shape resulting from the misaligned blaze can be difficult to cleanly separate from a velocity shift.
The STIS calibration pipeline applies a correction for the expected blaze function shift, which depends on both the wavelength offset measured in the contemporaneous lamp calibration spectra and on the date of the observation (see Alosi 2011). The latter term is needed because the blaze function shift for the STIS echelle gratings has been shown to evolve systematically over time. Unfortunately, at the time the bulk of our analysis was done, the time dependent terms for the post-SM4 blaze function shifts were not yet available in the default pipeline calibration. This led to very large misalignments in the flux calibration. Flux inconsistencies in the overlap between spectral orders of 10% or more were common.
To correct for the blaze function misalignment, we developed a simple IDL script which recovers the applied sensitivity curves for each spectral order from the net and flux vectors delivered in the pipeline calibrated spectra, and then finds the overall shift of those sensitivity curves which makes the calibrated flux in the wavelength overlap between spectral orders most consistent. The approach we used is a preliminary version of the algorithm in Baer, Proffitt, and Lockwood (2018).
Once this correction has been applied, it is still necessary to combine the multiple, rather faint observations, each containing 40 different echelle orders, into a single 1D spectrum for each of our two epochs. We first define our final output wavelength grid, which is chosen to have the same average dispersion as our echelle observations, but with uniform spacing in delta(log lambda). For each individual observation, we then interpolate the flux and error at each wavelength bin onto this output grid. Where two echelle orders overlap in wavelength, we weight their contributions at each wavelength by the relative sensitivities at that wavelength. We then combine all of the separate observations, this time weighting by their relative exposure times. This simple interpolation procedures does introduce some smoothing and results in some correlations between adjacent wavelength bins which are not properly taken into account by simply interpolating the error vector. However, for our science goals, preserving the spectral resolution and the absolute wavelength calibration are the highest priority, and as a practical matter, this combined spectrum will normally be further smoothed prior to cross-correlation to determine the velocity difference. We estimate that the mean S/N per resolution element is approximately 10.
Note that attempting to combine these echelle spectra by weighting using the pipeline estimated errors instead of the relative throughputs or exposure time results in biasing the coaddition towards data points that happen to have fluctuated low, and for relatively low S/N data such as we obtained for V350 Sgr, this can lead to significant problems in the spectral combination and cross-correlation.

Representative regions of the spectra are shown in Fig 2.
The summed spectra for each epoch were then “blemished”, to remove interstellar medium (ISM) features, easily recognizable because they are narrow compared with the stellar lines. This included several 12CO lines, again recognizably narrow.
The spectra at the 2 epochs were cross-correlated using an IDL routine. The resulting spectra are still relatively weak, however the single quantity–the radial velocity difference between the two–can still be determined relatively well from two spectra with identical properties: temperature, abundance, and rotation. In measuring the velocity, we explored a number of parameters. The cross-correlations were done in a series of pieces, typically 10 Å wide. However, the boundaries of these regions were carefully selected so that the relatively broad lines are contained within a region (not sliced in half). The effect of smoothing was explored, again since the stellar features are broad. The final smoothing was selected based on reduced noise in the broad stellar features (20 point smooth which corresponds to approximately 0.11 Å). A gaussian was fitted to the cross-correlation result, with particular attention paid to the background identification in the fitting.
A series of tests was also performed using several IDL cross-correlation routines, data treatments such as smoothing, and Gaussian fitting widths. These involved typically cross-correlation of the whole spectrum, and also a truncated version omitting a prominent feature which was contaminated by strong ISM absorption.
3.1 Velocity
The individual cross correlations of pieces of the spectra were inspected, and three were removed because the gaussians were unsatisfactory. Three further segments were removed as outliers. The remaining reliable values of the velocity difference from 13 segments is -43.3 1.9 km sec-1, which we use as the estimate for the uncertainty of the velocity. Considering the rotation velocity of the star (75-100 km/s), this is a reasonable uncertainty. Similar treatment of a more highly smoothed spectrum (50 point smooth) provided a velocity within these errors. The results of the tests using the full spectrum and the truncated version were consistent with this velocity and error estimate.
The velocity uncertainty is dominated by the number of broad features from which velocities can be measured. STIS wavelength precision is very high using standard observing procedures, such as peakup during acquisition. Ayres (2010) has confirmed this, and our estimated instrumental error is 0.5 pixel corresponding to 0.75 km sec-1, which is only a small contribution to the error. We have confirmed this using the repeatability of the ISM lines of two other Cepheids with similar observations (S Mus and V1334 Cyg). The RMS scatter in about the mean velocity is only 0.24 km sec-1 (Proffitt et al. 2017).
4 The Companion
The mass of the companion must be determined to complete the determination of the Cepheid mass. It is based on an International Ultraviolet Explorer (IUE) spectrum, as discussed by Evans and Sugars (1997). An important aspect of this approach to mass determination is that the spectrum of a late B companion is completely uncontaminated by the brighter Cepheid for wavelengths shorter than 1700 Å. In this spectral type range the situation is favorable since the energy distribution is very temperature sensitive and mass changes comparably slowly as a function of spectral type.
We add to the discussion in Evans and Sugars in two ways using temperatures determined from model atmospheres and using a recent list of masses determined from eclipsing binaries.
To assess the energy distribution, the spectrum must, of course, be corrected for reddening. As in previous discussions (Evans 1991), the reddening is derived from optical colors which have been corrected for the comparatively small effects of the light from the companion, resulting in E(B-V) = 0.32 mag in the case of V350 Sgr. This is then corrected to the E(B-V) which would be seen by the broadband colors of an OB star [E(B-V) = 0.36 mag] before applying the reddening law of Cardelli, Clayton, and Mathis (1989) to the spectrum using the IDL routine UNRED_CCM. Because the star is relatively close and the extinction is low, this extinction law should be applicable.
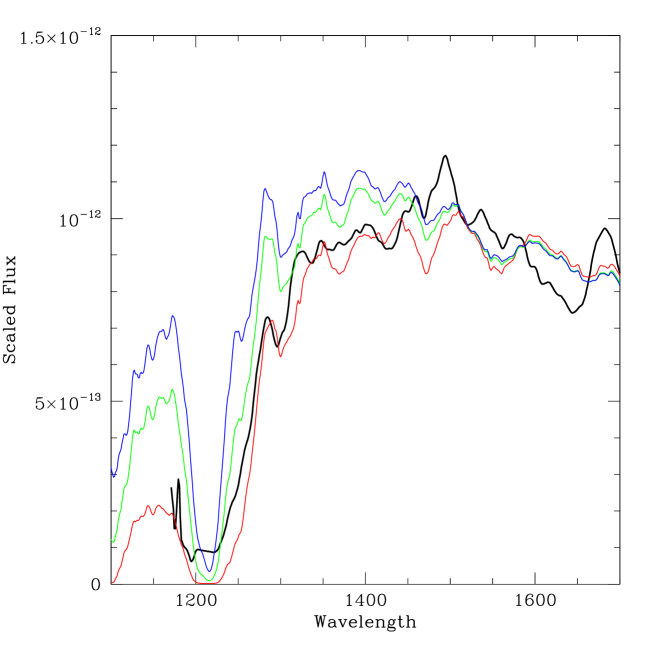
The analysis is focused on the temperature sensitivity of the energy distribution between 1150 and 1700 Å. The spectrum was compared with “BOSZ” model atmospheres from Bohlin, et al. (2017) for temperatures 10750 K, 12000 K, and 13000 K (log g = 4.00, turbulence = 2 km sec-1) corresponding closely to B9 V, B8 V, and B7 V respectively. The models and the IUE spectrum have been scaled to the wavelength region 1500 to 1700 Å for comparison (Fig 3). Fig 3 shows that the V350 Sgr B is slightly hotter than 10750 K, but distinctly cooler than 12000 K. To make the comparison more quantitative, the ratio of the flux in bins from 1250 to 1350 Å to the flux from 1500 to 1700Å was computed (Table 2). Using these ratios, the temperature of V350 Sgr B is estimated to be 11000 K.
Ultraviolet spectra are particularly sensitive to interstellar extinction. However, this is not as serious a contributor to the estimate of the mass of the companion as might be expected. The E(B-V) of Cepheids has been well studied, and the value for the V350 Sgr system is moderate. Care has been taken in the correction of the energy distribution for reddening (above). In particular, the energy distributions of late B stars are very temperature sensitive in the region of Fig 3, and the temperature is estimated from a relatively short wavelength range (Table 2). To illustrate that a moderate uncertainty in the reddening does not distort the interpretation of the ultraviolet spectrum (Fig 3), the bottom two lines in Table 2, show the range of the flux ratio for the range of E(B-V) = 0.33 to 0.39 mag. The flux ratios remain between B9 V and B8V.
| Spectrum | Flux Ratio | E(B-V) | M |
|---|---|---|---|
| Type | 1300/1600 | mag | M⊙ |
| V350 Sgr B | 0.781 | 0.36 | |
| B9 V 10750 K | 0.707 | 2.41 | |
| B8 V 12000 K | 0.928 | 2.78 | |
| B7 V 13000 K | 1.044 | 3.22 | |
| V350 Sgr B | 0.818 | 0.39 | |
| V350 Sgr B | 0.748 | 0.33 |

In order to determine the mass corresponding to this temperature, we have used the data of Torres, et al (2010). Fig 4 shows their temperature and mass data for O and B stars. For comparison with the discussion of Evans and Sugars (1997) we use the mass-temperature relation from Harmanec (1988). An important fact in assessing the mass of V350 Sgr B is that the age of the star is known, since it is a companion of a young Cepheid. This means that it will lie very close to the zero age main sequence, in contrast to many of the eclipsing binaries which will have evolved significantly beyond. The spread in ages for the eclipsing binaries is responsible for much of the scatter in Fig 4. For this reason, it is the lower envelope in Fig 4 which is appropriate for our comparison. The Harmanec relation lowered by 0.02 in log mass provides a good lower envelope. Fig 3 and Table 2 show that V350 Sgr B is slightly warmer than the B9 V model (10750 K), but cooler than the mid-point between B9 V and B8 V (which we will call B8.5 V). Using the masses in Table 2 (Harmanec envelope), the mass between B9 V and B8.5 V is 2.50 M⊙, which is 0.1 M⊙ from either B9 V or B8.5 V, which are ruled out by Fig 3. This is the same as the result from Evans and Sugars using MK spectral classes.
5 Results
The orbital velocity difference between the observed phases (very close to the orbital velocity amplitude) of V350 Sgr B (-43.3 1.9 km sec-1) can be compared with the orbital velocity difference for the Cepheid V350 Sgr A. We have used the orbit of Evans, et al. (2011) to determine the velocity difference of the Cepheid at the same phases as the STIS observations, which is 21.0 km sec-1 (Table 1). Thus the mass ratio MCep/MCom is 2.1 0.084. Combining this with the mass of the companion from the previous section 2.5 0.1 M⊙ (4%) yields Cepheid mass of 5.2 M⊙ with an error estimated from the combined error of the velocity and companion mass of 6%.

6 Discussion
Fig 5 puts the mass of V350 Sgr in the context of the measured Cepheid masses, and also of theoretical predictions. New masses are available for V350 Sgr (this paper), V1334 Cyg (Gallenne, et al. 2018) and Polaris (Evans, et al. 2018). Other masses for MW Cepheids are from the sources listed in Evans, et al. (2011). (Note that the mass for SU Cyg is a lower limit, and that of W Sgr is an upper limit.) W Sgr and FF Aql incorporate HST Fine Guidance System (FGS) astrometry (Benedict, et al 2007; Evans, et al. 2009). This is a “before” picture, since the accuracy of the masses of S Mus and SU Cyg will be improved in near future including the results from interferometry (which will produce an “after” picture). The mass for Polaris is preliminary, and will ultimately be improved using CHARA interferometry, but because of the long period of its orbit, this will not be for several years.
Luminosities in Fig 5 for the MW Cepheids are derived from the Leavitt Law (Period-Luminosity) of Benedict, et al. (2007). Alternately for V350 Sgr, a radius was derived using the modified Balona technique (Rastorguev and Dambis 2011) after carefully correcting for the effect of the companion on the light curve. The resulting luminosity is slightly smaller than that in Fig 5.
The LMC Cepheids in eclipsing binaries have recently been rediscussed by Pilecki, et al (2018) and their masses and luminosities are shown in Fig 5 . This includes the interesting case of LMC-CEP-1812 which is crossing the instability strip for the first time (the least luminous Cepheid in Fig 5) and may be a merger product (Neilson et al. 2015). It occurs approximately 0.2 in log(L/L⊙) lower than the relation in Fig 5 for second and third crossing stars as expected the predictions of Bono et al. (2016) from the comparison of luminosities between crossings. In addition the system LMC-CEP-1718 A and B contains a pair of first overtone pulsators (the two most massive LMC stars in Fig 5). The combination is unusual in that the more massive is less luminous. However this may be explained by the uncertainty in the luminosities.
The range of theoretical predictions from evolutionary tracks is also shown. The left (short dash) line is for the metallicity of the LMC; others are for MW metallicity. The right hand line (long dash) shows the prediction for stars with no core convective overshoot on the main sequence (Bono, et al. 2016). As is well known, these predictions produce the lowest luminosity for a given mass. The two lines in the middle illustrate combinations of parameters which can increase the luminosity for a given mass by increasing the size of the central He core after core hydrogen burning. The solid line has moderate convective overshoot added (dover = 0.2 Hp where Hp is the pressure scale height). The dotted line shows recent Geneva calculations (Anderson, et al. 2014) which include both a smaller amount of overshoot (dover = 0.1 Hp) and rotation. The value of 0.5 (critical velocity) actually represents the effects of a wide range of rotations well. All the predictions in Fig 5 are for combined second and third crossings of the instability strip.
The improved accuracy of the mass of V350 Sgr confirms that evolutionary tracks without rotation or overshoot predict too low a luminosity for the mass, which is in agreement with other masses in Fig 5. As improved masses become available, other parameters influencing the luminosity in the Cepheid stage will be more tightly constrained.
Acknowledgments: The referee’s report improved the clarity of presentation. Support was provided by HST Grant GO-13368.01-A and Chandra X-ray Center NASA Contract NAS8-03060 (to NRE) and HST-GO-13368.008-A (to CP) . A. Rastorguev acknowledges Russian Foundation for Basic Research (RFBR grant 18-02-00890) for partial support.
References
- alosi (2011) Alosi, A. 2011, Time Dependence of the Echelle Modes Sensitivity before the STIS Repair, Instrument Science Report STIS 2011-04, Baltimore, MD: STScI
- anderson (2014) Anderson, R. I., Ekström, S, Georgy, C., Meynet, G., Mowlavi, N. and Eyer, L. 2014, A&Ap, 564, 100
- ayres (2010) Ayres, T. R. 2010, ApJS, 187, 149
- baer et al (2018) Baer, M., Proffitt, C. R., and Lockwood, S. A. 2018, Instrument Science Report STIS 2018-01, Baltimore, MD: STScI
- benedict et al (2007) Benedict, G. F. et al. 2007, AJ, 133, 1810
- bohlin (2017) Bohlin, R. C., Meszaros, S., Fleming, S. W., Karl D. Gordon, K. D., Koekemoer, A. M., and Kovacs, J. 2017, AJ, 153, 234
- bono (2016) Bono et al. 2016 Mem S. A. It., 87, 358
- bowers lindler (2003) Bowers, C. W., & Lindler, D. 2003, STIS Echelle Blaze Shift Correction in The 2002 HST Calibration Workshop : Hubble after the Installation of the ACS and the NICMOS Cooling System, Proceedings of a Workshop held at the Space Telescope Science Institute, Baltimore, Maryland, October 17 and 18, 2002
- cardelli (1989) Cardelli, J. A., Clayton, G. C., and Mathis, J. S. 1989 ApJ, 345, 245
- evans (1991) Evans, N. R. 1991, ApJ, 372, 597
- evans etal (2009) Evans, N. R. Massa, D., and Proffitt, C. 2009, AJ, 137, 3700
- evetal (2011) Evans, N. R., Berdnikov, L., Gorynya, N., Rastorguev, A., and Eaton, J. 2011, AJ, 142, 87.
- evetal (2005) Evans, N. R., Carpenter, K. G., Robinson, R., Kienzle, F., and Dekas, A. E. 2005, AJ, 130, 789
- evetal (1997) Evans, N. R., Böhm-Vitense, E., Carpenter, K., Beck-Winchatz, B., and Robinson, R. 1997, PASP, 109, 789
- evsug (1997) Evans, N. R. and Sugars, B. J. A. 1997, AJ, 113, 792
- evetal (2008) Evans, N. R., Schaefer, G. H., Bond, H. E., Bono, G. Karovska, M., Nelan, E., Sasselov, D., and Mason, B. D. 2008, AJ, 136, 1137
- evetal (2018) Evans, N. R., Karovska, M., Bond, H. E., Schaefer, G. H., Sahu, K., Mack, J., Nelan, E., and Bono, G. 2018 ApJ, 863, 187
- galetal (2018) Gallenne, A., Kervella, P., Evans, N. R., et al. 2018, ApJ, submitted
- gietal (2015) Gieren, W., Pilecki, B., Pietrzynski, G., et al. 2015, ApJ, 815, 28
- harmanec (1988) Harmanec, P. 1988, Bull. Astron. Inst. Czech, 39, 329
- neetal (2011) Neilson, H. R., Cantiello, M., and Langer, N. 2011, A&A, 529, L9.
- neetal (2015) Neilson, H. R., Izzard, R. G., Langer, N. and Ignace, R. 2015, A&A, 581, L1
- pietal (2013) Pilecki, B., Graczyk, D., Pietrzynski, G., et al. 2013, MNRAS, 436, 953
- pietal (2015) Pilecki, B., Graczyk, D., Gieren, W. et al. 2015, ApJ, 806, 29
- pietal (2018) Pilecki, B., Gieren, W., Pietrzynski, G. et al 2018 arXiv:1806:0139
- pretal (2017) Proffitt, C. R., Evans, N. R., Winston, M. E., Gallenne, A., and Kervella, P 2017, 22 Los Alamos Pulsation Meeting, San Pedro Chile
- rastorguev dambis (2011) Rastorguev, A. S. and Dambis, A. K. 2011, Ast Bull, 66, 47
- torresetal (2010) Torres, G., Andersen, J., and Gimenez, A. 2010, A& Ap Rv, 18, 67