Testing Monte Carlo absolute dosimetry formalisms for a small field ‘D’-shaped collimator used in retinoblastoma external beam radiotherapy
Abstract
Purpose: To investigate the validity of two Monte Carlo simulation absolute dosimetry approaches in the case of a small field dedicated ‘D’-shaped collimator used for the retinoblastoma treatment with external photon beam radiotherapy.
Methods: The Monte Carlo code penelope is used to simulate the linac, the dedicated collimator and a water phantom. The absolute doses (in Gy per monitor unit) for the field sizes considered are obtained within the approach of Popescu et al. in which the tallied backscattered dose in the monitor chamber is accounted for.
The results are compared to experimental data, to those found with a simpler Monte Carlo approximation for the calculation of absolute doses and to those provided by the analytical anisotropic algorithm. Our analysis allows for the study of the simulation tracking parameters. Two sets of parameters have been considered for the simulation of the particle transport in the linac target.
Results: The change in the tracking parameters produced non-negligible differences, of about 10% or larger, in the doses estimated in reference conditions. The Monte Carlo results for the absolute doses differ from the experimental ones by 2.6% and 1.7% for the two parameter sets for the collimator geometries analyzed. For the studied fields, the simpler approach produces absolute doses that are statistically compatible with those obtained with the approach of Popescu et al. The analytical anisotropic algorithm underestimates the experimental absolute doses with discrepancies larger than those found for Monte Carlo results.
Conclusions: The approach studied can be considered for absolute dosimetry in the case of
small, ‘D’-shaped and off-axis radiation fields. However, a detailed description of the radiation transport in the linac target is mandatory for an accurate absolute dosimetry.
I Introduction
Nowadays, the Monte Carlo (MC) simulation of radiation transport is considered to provide the most accurate determination of the energy deposited by ionizing radiation in a medium. The MC method permits an accurate modeling of the physics behind the radiation-matter interaction processes, thus improving the dose determination in situations that are difficult for other algorithms (e. g., inhomogeneities and tissue interfaces). Particularly interesting is the case of small irradiation fields in which the charged particle equilibrium is lost, a problem that has gained importance due to the increasing incidence of intensity-modulated radiation therapy (IMRT). This treatment modality requires independent methods for quality assurance and therein MC algorithms may play a crucial role.
Despite the advantages of MC simulations, they have been mainly devoted to the verification of treatments planned with other algorithms. However, the increasing calculation power of the new computers has opened the possibility of computing treatment plans using MC algorithms to simulate both the linear accelerator and the computerized tomography image of the patient in times that begin to be acceptable in the routine clinical practice. There is, however, a drawback with MC dosimetry. While MC codes usually produce doses in units of eV/g per primary particle, those used in clinical dosimetry are expressed in Gy per monitor unit (MU). A conversion factor between these two units could be found if the current intensity of the electron beam impinging the target is known.
As the current is usually unknown, there are several procedures aiming at estimating the MC absolute dose (Francescon et al. 2000, Popescu et al. 2005, Lax et al. 2006, Panettieri et al. 2007). In general, all of them are based on the determination of the ratio between the MC dose at a reference point in a water phantom and the output in Gy/MU given by the calculation algorithm of the treatment planning system used (Francescon et al. 2000, Lax et al. 2006, Panettieri et al. 2007). A more accurate approach is that developed by Popescu et al. (2005) in which the dose delivered to the monitor ionization chamber of the linac is also taken into account. In principle, these absolute dosimetry formalisms can be applied to any radiation field configuration, open or blocked, small or large, in- or off-axis.
In the present work we apply these methodologies to small off-axis radiation fields. In particular, we consider the radiation fields currently used at the University Hospital of Essen for the treatment of retinoblastoma, the most common intraocular malignancy in early childhood. The Essen procedure (Sauerwein and Stannard 2009) is a technique developed from that originally proposed by Schipper (Schipper 1983, Schipper et al. 1997). Specifically, a dedicated ‘D’-shaped collimator, inserted in the accessory tray holder of a Varian Clinac 2100 C/D, operating at 6 MV, is used. This collimator can conform irradiation fields to two different sizes, 3.1 cm2 or 5.2 cm2, if an optional brass insert is included or not, respectively. The purpose of the collimator is twofold: (i) to reduce the absorbed dose to normal tissues, thus lowering the incidence of radiation-induced secondary tumors, and (ii) to reach a better definition of the beam penumbrae, thus improving the lens protection. An accurate dosimetry in the globe and the adnexa is necessary (Flühs et al. 1997, ICRU 2004, Schueler et al. 2006). However, it is complicated to attain and MC simulation appears to be a good tool to tackle it. In fact, MC simulation has permitted to accurately describe the dose distribution in small-sized irradiated volumes of the eyes (Thomson et al. 2008, Brualla et al. 2012b, Chiu et al. 2012, Miras et al. 2013).
In previous works, and using the MC code penelope (Baró et al. 1995, Sempau et al. 1997, Salvat et al. 2011), the relative absorbed dose distribution produced by the aforementioned ‘D’-shaped collimator in a water phantom was analyzed in detail (Brualla et al. 2012a, Mayorga et al. 2014). In this work we aim at evaluating the ability of the aforementioned procedures for determining the MC absolute dose in the case of this collimator and comparing the results to experimental data and to the dose distribution obtained with the analytical anisotropic algorithm (AAA) (Ulmer and Harder 1995, Ulmer and Kaissl 2003, Sievinen et al. 2005, VanEsch et al. 2006).
II Material and methods
II.1 Determination of the absolute dose
In the approach of Popescu et al. (2005) the MC total absolute dose per monitor unit (MU) deposited in the phantom at the position is calculated as
| (1) |
Here is the dose per primary electron, deposited in the phantom, in a scoring voxel that is centered at the position . A “primary electron” refers to an electron emitted from the source that impinges on the linac target. In equation (1), and are doses per primary electron deposited in the monitor chamber included in the simulation geometry of the linac. It is assumed that these doses are average values scored in the whole active volume of the monitor chamber. The superscript “ref” indicates that the dose must be obtained in reference conditions, that is for a field size of 10 cm 10 cm and a source-to-surface distance (SSD) of cm. is the dose per monitor unit, in reference conditions, at the calibration point, which is commonly situated at the isocenter, at a depth of 10 cm in the water phantom. Finally, is the dose per primary electron, deposited in a scoring voxel that is centered at the calibration point, in reference conditions. The lower case doses appearing in the r.h.s. of equation (1) are obtained in MC simulations while is an experimental value of the specific linac for which the analysis is carried out.
The dose scored in the monitor chamber can be separated in two terms as follows:
| (2) |
Here is the contribution due to the beam particles that enter the monitor chamber from above, following the beam incident flux, and is that of those particles that enter the monitor chamber after being backscattered on the jaws, and the remaining elements of the linac head geometry situated downstream below the chamber. For a given operation energy of the linac, is the same for all configurations. Conversely, may depend on the field aperture defined by the collimation system of the linac. Then, the total dose in equation (1) can be written as
| (3) |
where
| (4) |
Here
| (5) |
is the so-called monitor chamber backscatter factor. Recently, Zavgorodni et al. (2014) combined measured factors with simulated and (which are rather insensitive to the geometrical details of the monitor chamber) to determine, through equation (5), the dose to be used in equations (3)-(5) for various qualities of a 21EX and a TrueBeam Varian linac.
Other authors (Francescon et al. 2000, Lax et al. 2006, Panettieri et al. 2007) proposed to calculate the MC total dose per MU using a simpler expression:
| (6) |
This is equivalent to assume
| (7) |
in the prescription of Popescu et al.
II.2 ‘D’-shaped collimation system
As indicated above, the aim of the present work is to apply the approaches described in the previous subsection to the irradiation fields provided by a ‘D’-shaped collimation system used for the retinoblastoma treatment at the University Hospital of Essen. The whole collimation system is described in detail in the work by Brualla et al. (2012a). Its transverse sections that show up the shape of the two irradiation fields available are shown in figure 1. The collimator is made of Cerrobend and patients can be treated with either 3.1 cm2 (right panel) or 5.2 cm2 (left panel) fields according to whether the insert is present or not. The configuration without the brass insert is referred as G geometry, while G labels that including it.
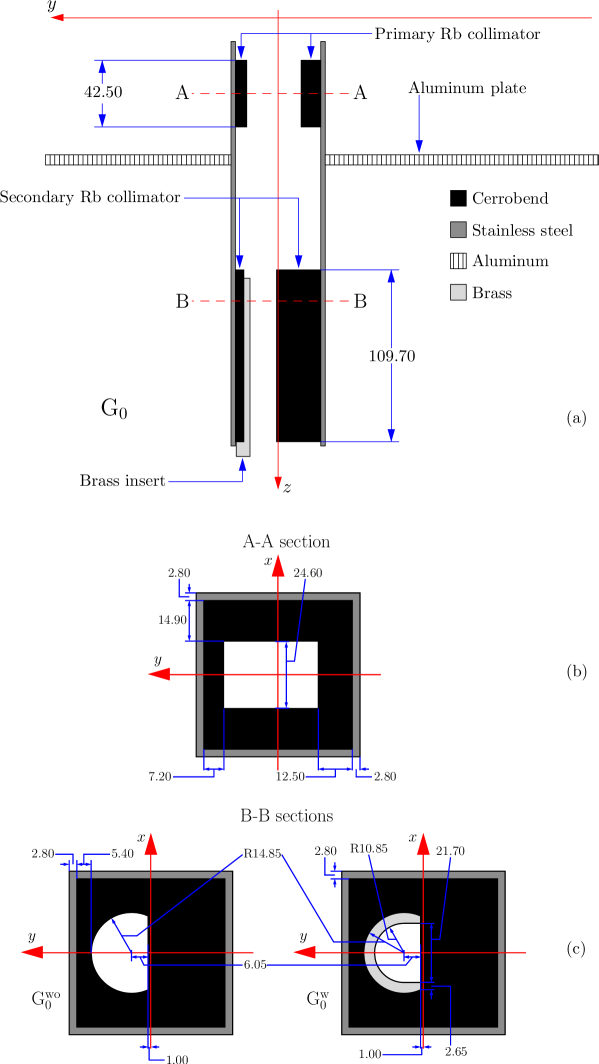
The collimator is inserted in the accessory tray holder of a Varian Clinac 2100 C/D operating at 6 MV. Recently (Brualla et al. 2012a), the dosimetry of this system was analyzed by comparing results obtained in MC simulations with penelope, experimental measurements in a water phantom and the predictions of the AAA implemented in the Eclipse (Varian Medical Systems, Palo Alto, California) treatment planning system. Also the dosimetric role of the various elements included in the collimation system was analyzed with MC simulations (Mayorga et al. 2014).
In figure 1 the coordinate system used in all calculations is indicated. The direction of increasing coincides with the beam central axis. The origin of coordinates is situated upstream, at cm from the isocenter. At the isocenter, the radiation field defined by the jaws is centered at and cm. It is symmetric, with cm width, about the axis as defined by the -jaws of the linac. In the -direction, the -jaws open cm in the negative -axis and cm in the positive one, defining a field cm wide. The movable jaws are situated in the same position independently whether the brass insert is used or not.
II.3 Simulation details
As said above, all -doses in equations (1)–(5) were obtained from MC simulations in which the complete geometry of the linac head and the collimation system were taken into account. Simulations were carried out with penEasy (Sempau et al. 2011), a main steering code that uses the general-purpose MC system penelope.
penelope simulates the coupled transport of electrons, positrons and photons. This MC system performs the simulations using a mixed scheme in which electron and positron interactions are classified as hard or soft events. In hard events the angular deflections and/or the energy losses are larger than certain cutoffs; these events are simulated in a detailed way. All soft interactions occurring between two hard events are described within a multiple scattering theory; in particular, their simulation is done in terms of a single artificial event. Photons are simulated on a detailed scheme, that is simulating all their interactions in chronological order. Particle transport is carried out until the particle kinetic energy is below user-defined absorption energies (), and the particle is locally absorbed. The multiple scattering algorithm is controlled by the following parameters: is related to the average angular deflection due to a hard elastic collision and all previous soft collisions. controls the maximum allowed value for the average fractional energy loss in a step. and are energy cutoffs for hard inelastic collisions and hard bremsstrahlung emission, respectively. If the user sets and equal to an arbitrary negative number, penelope performs a detailed simulation for electrons and positrons.
The whole detailed head of a Varian Clinac 2100 C/D operating at 6 MV, the retinoblastoma collimator and a water phantom of were included in the simulations. The linac geometry was generated with the code penEasyLinac (Brualla et al. 2009a, Sempau et al. 2011, Rodriguez et al. 2013). Specific benchmarks of the calculations with this set of codes for the linac and nominal energy considered in this work were done in previous publications (Fernández-Varea et al. 2007, Brualla et al. 2009a, Brualla et al. 2009b, Panettieri et al. 2009, Sempau et al. 2011)
Simulations were performed in several steps in which the various -doses were calculated. A detailed description of these steps can be found in the Appendix. In the simulations performed the following variance-reduction techniques (VRTs) were applied: Movable-skins (Brualla et al. 2009b) were used in the linac primary collimator and the jaws. Interaction forcing (Salvat et al. 2011) was applied to bremsstrahlung interactions in the photon target. Rotational splitting (Brualla and Sauerwein 2010) was used in the upper part of the linac, above the jaws, where cylindrical symmetry holds. Standard particle splitting was used in the water phantom.
In a recent work Rodriguez et al. (2015) pointed out the disagreement between simulated and experimental dose distributions obtained from a linac when a long step length was used for the simulation of the bremsstrahlung emission in the target. Specifically, using values of and greater than 10-3 for the tungsten of the target may produce a bias in the bremsstrahlung distribution that otherwise disappears almost completely when values of 10-3 or smaller are used for both tracking parameters. In order to investigate the effect of this new set of tracking parameters on absolute dosimetry in Gy/MU, all simulations were run with the tracking parameters for the target indicated in table 4, namely , keV and keV, and with the parameter set proposed by Rodriguez et al. (2015) for the tungsten of the target: , keV and keV. The results obtained with both sets of parameters were labeled P1 and P2, respectively.
II.4 Comparison to experimental measurements
In order to test the validity of the approaches described, experimental doses measured at the point were compared to the MC doses given by equation (3). This point coincides with the center of curvature of the circular part of the field at the measurement plane (). Actually, the comparison was done as follows. According to equation (3) we can write
| (8) |
Similarly, for the simpler approach one gets
| (9) |
These normalized doses are dimensionless quantities that were compared to the corresponding experimental ones given by
| (10) |
Measurements were carried out according to the protocols DIN 6800-2 (DIN 2008), for the reference doses, and DIN 6809-8 (DIN 2014), for the small field doses. The size of the alignment field was cm2. The experimental doses were measured with a PTW M31016 ionization chamber, which has an active volume of cm3, at the point with an isocentric configuration. In this way it was possible to obtain measurements at different depths by varying the SSD from 96 to cm in cm step. The two configurations for the retinoblastoma collimator, G and G, were considered. The values selected for and permit to maximize the dose rate in the treatment field of the retinoblastoma. As we had five experimental determinations of each dose , taken during the last four years, we compared the MC values to the corresponding averages over the five experimental values, . Also the corresponding calibration dose was measured in reference conditions.
The doses required to obtain the MC normalized doses were calculated by considering a scoring voxel of 0.016 cm3 centered around the same point where the effective point of measurement of the chamber was situated and with the same geometrical conditions for the phantom positioning. Results for both P1 and P2 parameter sets were determined.
Statistical uncertainties with a coverage factor were estimated for all quantities considered. In the case of the MC doses, these uncertainties were obtained directly from the corresponding simulations. For the normalized doses the linear propagation prescription was assumed.
In order to complete the analysis, the average experimental values were also compared to
| (11) |
where are the doses obtained using the Eclipse treatment planing system that implements the AAA as calculation engine. Eclipse (v. 8.9.09) on ARIA 8 with AAA (v. 8.9.08) were used. In Eclipse, the detailed geometry of the retinoblastoma collimator cannot be simulated and calculations were done by considering a block cm thick, with 0.1% transmission, that includes an aperture with 100% transmission. The shape of this aperture is designed according to the two fields defined by the retinoblastoma collimator, including or not the brass insert. A cm calculation grid size was used and scoring voxels of cm3 were defined in the water phantom.
III Results and discussion
The doses , and obtained in the simulations performed with the two parameter sets P1 and P2 are given in table 1. The calculation of the backward dose does not show differences between the two geometries analyzed G and G, therefore only one value is reported. This is due to the fact that both geometries share the same position of the jaws, which produce the largest contribution to the backscatter radiation in the ionization chamber. Also, and are the same for these two geometries.
The change in the tracking parameters produces a noticeable increase of 12.6% in . In contrast, the forward dose in the chamber is slightly reduced while the backward ones are increased by a few percent. As the factor , given in equation (4), is inversely proportional to the dose , the values of this factor found for P1 are larger than those obtained with the P2 parameter set.
| P1 | P2 | relative difference | |
| 0.635(3) | 0.715(3) | 12.6% | |
| -0.7% | |||
| 3.7% | |||
| 4.0% | |||
| 1.576(8) | 1.399(7) | -11.2% | |
| 1.00095(8) | 1.00099(5) | 0.41% |
| (Gy/100 MU) | |||||||||||
|---|---|---|---|---|---|---|---|---|---|---|---|
| G | G | ||||||||||
| set | (Gy/100 MU) | SSD=99 | SSD=98 | SSD=97 | SSD=96 | SSD=99 | SSD=98 | SSD=97 | SSD=96 | ||
| 1 | 0.808 | 0.943 | 0.972 | 0.938 | 0.900 | 0.938 | 0.961 | 0.927 | 0.886 | ||
| 2 | 0.802 | 0.923 | 0.952 | 0.918 | 0.881 | 0.924 | 0.951 | 0.915 | 0.877 | ||
| 3 | 0.805 | 0.932 | 0.947 | 0.914 | 0.876 | 0.929 | 0.945 | 0.908 | 0.869 | ||
| 4 | 0.804 | 0.933 | 0.954 | 0.920 | 0.885 | 0.929 | 0.950 | 0.916 | 0.879 | ||
| 5 | 0.803 | 0.942 | 0.969 | 0.927 | 0.890 | 0.936 | 0.955 | 0.921 | 0.884 | ||
| 1.162(9) | 1.192(9) | 1.148(9) | 1.102(8) | 1.158(9) | 1.184(9) | 1.140(9) | 1.093(9) | ||||
| (eV/g/particle) | ||||||||||
| P1 | P2 | |||||||||
| SSD=99 | SSD=98 | SSD=97 | SSD=96 | SSD=99 | SSD=98 | SSD=97 | SSD=96 | |||
| G | 0.746(9) | 0.775(9) | 0.746(8) | 0.716(7) | 0.830(9) | 0.862(8) | 0.834(7) | 0.801(7) | ||
| G | 0.740(8) | 0.765(7) | 0.739(7) | 0.708(7) | 0.825(9) | 0.856(8) | 0.824(7) | 0.789(7) | ||
We also analyzed the effect produced by the approximation (7) in the absolute dose calculation. The values of the ratio are given in table 1. The difference found between the results for both parameter sets are well below 1% and the correction introduced when the ratio of equation (5) is considered is 0.1% at most.
Table 2 summarizes the experimental data used in our comparison. The doses found for the five different sets are shown for the four SSD values and the two collimator configurations at . Also the corresponding calibration doses are given (second column). The average normalized doses are shown in the last row.
Table 3 shows the doses obtained in the various simulations carried out with the two configurations of the retinoblastoma collimator studied in the present work. The values for the two parameter sets P1 and P2 are given. Those corresponding to P2 are larger than those of P1 and the differences are slightly above 10% at most. These differences, together with those found in some of the dose values tabulated in table 1, point out the relevant effect produced by the modification in the tracking parameters considered in the step 1 of the linac simulation process (see Appendix).
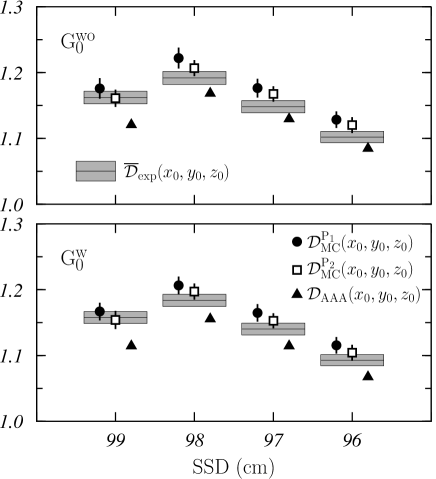
The results obtained using the simulated doses are in agreement, within the uncertainties, with the experimental ones for P2 while for P1 this is true only if a coverage factor is considered. This can be seen in a clearer manner in figure 2 where the normalized experimental doses (gray rectangles) are compared to the normalized simulated (solid circles for P1 and open squares for P2) for G (upper panel) and G (lower panel).
Regarding the comparison between simulations, it is worth mentioning that the doses , given by equation (9), are statistically compatible with the corresponding . In fact , which amounts to for P1 and 1.00099(5) for P2 (see table 1).
The relative differences between experimental and calculated doses are below 2.6% for P1 and 1.7% for P2. These maximum differences are around the maximum value of 2% found by Popescu et al. (2005). These authors used the BEAMnrc/DOSXYZnrc codes (Rogers et al. 2001,Walters and Rogers 2003) to simulate both open and blocked fields, including those employed in IMRT. It is worth pointing out that the differences with the experimental values are larger for the geometry G than for G, when the brass insert is present and the irradiation field is smaller: in this last case the maximum differences are below 2.2% and 1.2% for P1 and P2, respectively. In general, the use of the tracking parameter set P2 improves in all cases analyzed the agreement with the experimental data.
The doses are always smaller than the corresponding . Differences between the results obtained with the two tracking parameter sets are below 1.3% in absolute value.
Figure 2 also includes the normalized doses , given by equation (11), which are shown by the triangles. AAA underestimates the experimental doses in all cases calculated and shows a better agreement with the experiment in the case of G than for G.
At cm, the relative differences between AAA and the experiment are larger than 3% in absolute value. This contrasts with the fact that the doses obtained for both and show the best agreement with the experiment precisely for this SSD. For the other SSDs, the relative differences between AAA results and the experimental doses are similar, in magnitude, to those corresponding to P2 in the case of G, while for G are much larger, above 2%, that is of the same order of the relative differences found for P1. This points out that the accuracy of AAA decreases when the field size reduces. Similar findings have been quoted by other groups (see e. g., Ong et al. 2011).
IV Conclusions
Two formalisms proposed to estimate total absolute doses from MC simulations have been evaluated for the case of small off-axis fields defined by a collimator used in the retinoblastoma treatment with external beams produced by a linac.
The simulation of the linac has been carried out with penelope and its geometry has been generated with penEasyLinac. Two tracking parameters sets, P1 and P2, have been considered for the simulation of the particle transport in the target of the linac, the second one characterized by extremely low values of , and and providing a nearly detailed simulation of charged particles in the target. The change in the parameters produced non-negligible differences, above 10%, in doses tallied in reference conditions.
The absolute doses found using the procedure of Popescu et al. have been compared to measured doses for different SSDs. The MC results differ from the experimental ones by 2.6% and 1.7% for P1 and P2, respectively. The absolute doses obtained for the two parameter sets in the two geometries analyzed show differences below 1.3%, despite the aforementioned disagreement in . These results validate the use of the approach proposed by Popescu and collaborators in the case of the small, ‘D’-shaped and off-axis radiation fields considered herein. The approximation amounts to an error below 0.1% and can be used in the studied cases.
Acknowledgements
The work of PAM and AML has been supported in part by the Junta de Andalucía (FQM0220,FQM0387) and the Spanish Ministerio de Economía y Competitividad and FEDER (projects FPA2012-31993 and FPA2015-67694). LB and WS are grateful to the Deutsche Forschungsgemeinschaft (project BR 4043/3-1).
Apendix. Details of the simulations
Simulations were performed in several steps in which the various -doses entering equations (1)-(7) were calculated. The values of the tracking parameters considered in the different simulation steps are shown in table 4. In what follows a description of the main characteristics of each simulation step is given.
| step | material | Part of the geometry | |||||||
| 1 | Tungsten | 0.1 | 0.1 | target [P1] | |||||
| 100 | 20 | 100 | 0.001 | 0.001 | 20 | target [P2] | |||
| Tungsten | 0.1 | 0.1 | primary collimator (skins) | ||||||
| Tungsten | 0 | 0 | 0 | 0 | primary collimator (non-skins) | ||||
| Air | 0 | 0 | 0 | monitor chamber | |||||
| Air | 0 | 0 | 0 | 0 | PSFsec | ||||
| 2 | Tungsten | 0.1 | 0.1 | jaws (skins) | |||||
| Tungsten | 0 | 0 | 0 | 0 | jaws (non-skins) | ||||
| Air | 0 | 0 | 0 | monitor chamber | |||||
| Air | 0 | 0 | 0 | 0 | PSF, PSF | ||||
| Tungsten | 0.1 | 0.1 | jaws | ||||||
| Air | 0 | 0 | 0 | monitor chamber | |||||
| 3 | Cerrobend | 0.1 | 0.1 | Rb collimator | |||||
| Air | 0 | 0 | 0 | 0 | PSF, PSF | ||||
| 4, | Air | 0.1 | 0.1 | ||||||
| Water | 0.1 | 0.1 | phantom | ||||||
- Step 1.
-
A simulation was run from the electron source downstream to the exit of the upper segment of the linac, that is, just above its secondary collimator (lead shield) where a phase-space file, PSFsec, was tallied. The primary electron source was modeled as a monoenergetic point-like pencil beam with zero divergence. Electrons were emitted with an initial kinetic energy of 6.26 MeV. This set of initial beam parameters is the same for P1 and P2 simulations and reproduces well the absorbed dose distribution of the Clinac 2100 C/D used at the University Hospital of Essen. It must be noticed that this particular linac is not tuned to reproduce the Golden Beam Data Set provided by Varian for this type of linacs. To determine the PSFsec, a very thin air slab was defined just above the secondary collimator and all particles reaching it were stopped by imposing arbitrarily high absorption energies (GeV). In this step the movable skins VRT, with a thickness of mm, was considered in the primary collimator of the linac, interaction forcing was used in the target, with a forcing factor of 100, and rotational splitting (with a splitting factor of 15) was applied to particles reaching a thin air slab situated just after the monitor ionization chamber, previously to the secondary collimator of the linac. Apart from tallying the PSFsec, in this step was determined by scoring the dose in the air-cavity of the monitor chamber. A total of primary electrons were simulated.
- Step 2.
-
In the second step the simulation through the jaws was carried out and two phase-space files were scored. One of them, PSF, corresponded to the geometry G0. It is worth pointing out that the position of the jaws was the same if the optional brass insert was present or not. The second phase-space file, PSF, was tallied with the jaws situated in reference conditions. In this step the PSFsec was used as the particle source. The movable skins VRT, also with mm thickness, as in the primary collimator, was applied in the jaws. The two PSFs were accumulated in a thin air slab situated just below the jaws.
- Step 2′.
-
The second step was repeated in order to determine the dose scored in the monitor chamber due to backscattering in the jaws (as well as in all the remaining elements of the collimation system of the linac). In these simulations the doses (for the geometries G and G) and (corresponding to the reference conditions) were calculated. The main difference with the simulations of step #2 is that no VRTs were applied in the jaws to avoid any possible bias in the evaluated backscattering doses. No PSFs were scored in this step.
- Step 3.
-
In the third step particles emitted from the phase-space file PSF were transported through the corresponding retinoblastoma collimators and new phase-space files were scored in a thin air slab situated at their exit. We labeled them as PSF and PSF, according to the geometries used, G and G, respectively.
- Step 4.
-
In the last simulation step, the phase-space files PSF and PSF were used as sources of particles that were emitted towards a water phantom of cm3 where the dose values were determined.
- Step 4′.
-
This simulation was carried out to determine . The phase-space file, PSF scored in Step 2 was used as source of particles emitting towards the water phantom that was situated at a cm. The dose of interest was calculated following the prescription of Popescu et al. (2005) and a voxel of mm3 centered at the point (isocenter) was used to score the dose.
All materials not explicitly indicated in table 4 share the same parameters as tungsten in the skin regions. The parameter , defining the maximum step length of a particle trajectory, was fixed in each geometry body to one tenth of its characteristic thickness.
References
Baró J, Sempau J, Fernández-Varea J M and Salvat F 1995 PENELOPE: An algorithm for Monte Carlo simulation of the penetration and energy loss of electrons and positrons in matter Nucl. Instrum. Meth. Phys. Res. B 100 31-46
Brualla L, Mayorga P A, Flühs A, Lallena A M, Sempau J and Sauerwein W 2012a Retinoblastoma external beam photon irradiation with a special ‘D’-shaped collimator: a comparison between measurements, Monte Carlo simulation and treatment planning system calculation Phys. Med. Biol. 57 7741-51
Brualla L, Palanco-Zamora R, Wittig A, Sempau J and Sauerwein W 2009a Comparison between PENELOPE and eMC in small electron fields Phys. Med. Biol. 54 5469-81
Brualla L, Salvat F and Palanco-Zamora R 2009b Efficient Monte Carlo simulation for multileaf collimators using geometry-related variance-reduction techniques Phys. Med. Biol. 54 4131-49
Brualla L and Sauerwein W 2010 On the efficiency of azimuthal and rotational splitting for Monte Carlo simulation of clinical linear accelerators,” Radiat. Phys. Chem. 79 929-32
Brualla L, Zaragoza F J, Sempau J, Wittig A and Sauerwein W 2012b Electron irradiation of conjunctival lymphoma-Monte Carlo simulation of the minute dose distribution and technique optimization Int. J. Radiat. Oncol. Biol. Phys. 83 1330-7
Chiu-Tsao S-T, Astrahan M A, Finger P T, Followill D S, Meigooni A S, Melhus C S, Mourtada F, Napolitano M E, Nath R, Rivard M J, Rogers D W O and Thomson R M 2012 Dosimetry of 125I and 103Pd COMS eye plaques for intraocular tumors: Report of Task Group 129 by the AAPM and ABS Med. Phys. 39 6161-84
DIN Deutsches Institut für Normung 2008 Dosismessverfahren nach der Sondenmethode für Photonen- und Elektronenstrahlung - Teil 2: Dosimetrie Hochenergetischer Photonen- und Elektronenstrahlung mit Ionisationskammern DIN 6800-2 (Belin: Deutsches Institut für Normung)
DIN Deutsches Institut für Normung 2014 Klinische Dosimetrie Teil 8: Dosimetrie Kleiner Photonen Bestrahlungsfelder DIN 6809-8 (Belin: Deutsches Institut für Normung)
Fernández-Varea J M, Carrasco P, Panettieri V and Brualla L 2007 Monte Carlo based water/medium stopping-power ratios for various ICRP and ICRU tissues Phys. Med. Biol. 52 6475-83
Flühs D, Bambynek M, Heintz M, Indenkämpen F, Kolanoski H, Wegener D, Sauerwein W and Quast U 1997 Dosimetry and design of radioactive eye plaques Front. Radiat. Ther. Oncol. 30 26-38 (1997).
Francescon P, Cavedon C, Reccanello S and Cora S 2000 Photon dose calculation of a three-dimensional treatment planning system compared to the Monte Carlo code BEAM Med. Phys. 27 1579-87
International Commission on Radiation Units and Measurements 2004 Dosimetry of beta rays and low-energy photons for brachytherapy with sealed sources ICRU 72 (Bethesda: ICRU)
Lax I, Panettieri V, Wennberg B, Duch M A, Näslund I, Baumann P and Gagliardi G 2006 Dose distributions in SBRT of lung tumors: Comparison between two different treatment planning algorithms and Monte-Carlo simulation including breathing motions Acta Oncol. 45 978-88
Mayorga P A, Brualla L, Sauerwein W and Lallena A M 2014 Monte Carlo study for designing a dedicated ‘D’-shaped collimator used in the external beam radiotherapy of retinoblastoma patients Med. Phys. 41 011714
Miras H, Terrón J A and Lallena A M 2013 Monte Carlo simulation of COMS ophthalmic applicators loaded with Bebig I25.S16 seeds and comparison with planning system predictions Phys. Med.: Eur. J. Med. Phys. 29 60-7
Ong CL, Cuijpers JP, Senan S, Slotman BJ and Verbakel WFAR 2011 Impact of the calculation resolution of AAA for small fields and RapidArc treatment plans Med. Phys. 38 4471-9
Panettieri V, Barsoum P, Westermark M, Brualla L and Lax I 2009 AAA and PBC calculation accuracy in the surface build-up region in tangential beam treatments. Phantom and breast case study with the Monte Carlo code PENELOPE Radiother. Oncol. 93 94-101
Panettieri V, Wennberg B, Gagliardi G, Duch M A, Ginjaume M and Lax I 2007 SBRT of lung tumours: Monte Carlo simulation with PENELOPE of dose distributions including respiratory motion and comparison with different treatment planning systems
Phys. Med. Biol. 52 4265-81
Popescu I A, Shaw C P, Zavgorodni S F and Beckham W A 2005 Absolute dose calculations for Monte Carlo simulations of radiotherapy beams Phys. Med. Biol. 50 3375-92
Rodriguez M, Sempau J and Brualla L 2013 PRIMO: A graphical environment for the Monte Carlo simulation of Varian and Elekta linacs Strahlenther. Onkol. 189 881-6
Rodriguez M, Sempau J and Brualla L 2015 Study of the electron transport parameters used in PENELOPE for the
Monte Carlo simulation of Linac targets Med. Phys. 42 2877-81
Rogers D W O, Ma C-M, Walters B R B, Ding G X, Sheikh-Bagheri D and Zhang G 2001 BEAMnrc Users Manual PIRS-0509(A)revG (Ottawa: National Research Council of Canada); online at http://www.irs.inms.nrc.ca/inms/irs/BEAM/user manuals 2001
Salvat F, Fernández-Varea J M and Sempau J 2011 PENELOPE - A code system for Monte Carlo simulation of electron and photon transport (Issy-les-Moulineaux: OECD/NEA Data Bank)
Sauerwein W and Stannard C E 2009 Auge und orbita, in Radioonkologie Band 2: Klinik, edited by Bamberg M, Molls M and Sack H (Munich: Zuckschwerdt Verlag), pp 294-316
Schipper J 1983 An accurate and simple method for megavoltage radiation therapy of retinoblastoma Radiother. Oncol. 1 31-41
Schipper J, Imhoff S M and Tan K E W P 1997 Precision megavoltage external beam radiation therapy for retinoblastoma Front. Radiat. Ther. Oncol. 30 65-80
Schueler A O, Flühs D, Anastassiou G, Jurklies C, Sauerwein W and Bornfeld N 2006 Beta-ray brachytherapy of retinoblastoma: feasibility of a new small-sized Ruthenium-106 plaque Ophthalmic. Res. 38 8-12
Sempau J, Acosta E, Baró J, Fernández-Varea J M and Salvat F 1997 An algorithm for Monte Carlo simulation of coupled electron-photon transport Nucl. Instrum. Meth. Phys. Res. B 132 377-90
Sempau J, Badal A and Brualla L 2011 A PENELOPE based system for the automated Monte Carlo simulation of clinacs and voxelized geometries application to far-from-axis fields Med. Phys. 38 5887-95
Sievinen J, Ulmer W and Kaissl W 2005 AAA photon dose calculation model in EclipseTM TRAD#7170A (Palo Alto: Varian Medical Systems)
Thomson R M, Taylor R E and Rogers D W O 2008 Monte Carlo dosimetry for 125I and 103Pd eye plaque brachytherapy Med. Phys. 35 5530-43
Ulmer W and Harder D 1995 A triple Gaussian pencil beam model for photon beam treatment planning Z. Med. Phys. 5 25-30
Ulmer W and Kaissl W 2003 The inverse problem of a Gaussian convolution and its application to the finite size of the measurement chambers/detectors in photon and proton dosimetry Phys. Med. Biol. 48 707-27
Van Esch A, Tillikainen L, Pyykkonen J, Tenhunen M, Helminen H, Siljamäki S, Alakuijala J, Paiusco M, Lori M and Huyskens D P 2006 Testing of the analytical anisotropic algorithm for photon dose calculation Med.
Phys. 33 4130-48
Walters B R B and Rogers D W O 2003 DOSXYZnrc Users Manual PIRS-794 (Ottawa: National Research Council of Canada);
online at http://www.irs.inms.nrc.ca/inms/irs/BEAM/user manuals
Zavgorodni S, Alhakeem E and Townson R 2014 Monitor backscatter factors for the Varian 21EX and TrueBeam linear accelerators: measurements and Monte Carlo modelling Phys. Med. Biol. 59 911-24