Low star formation efficiency in typical galaxies at –6
Abstract
Using the VLA and ALMA, we have obtained CO(2–1), [Cii], [Nii] line emission and multiple dust continuum measurements in a sample of “normal” galaxies at . We report the highest redshift detection of low- CO emission from a Lyman Break Galaxy, at . The CO line luminosity implies a massive molecular gas reservoir of (K km s-1 pc, suggesting low star formation efficiency, with a gas depletion timescale of order 1 Gyr. This efficiency is much lower than traditionally observed in starbursts, indicating that star forming conditions in Main Sequence galaxies at may be comparable to those of normal galaxies probed up to to-date, but with rising gas fractions across the entire redshift range. We also obtain a deep CO upper limit for a Main Sequence galaxy at with times lower SFR, perhaps implying a high conversion factor, as typically found in low metallicity galaxies. For a sample including both CO targets, we also find faint [Nii] 205m emission relative to [Cii] in all but the most IR-luminous “normal” galaxies at , implying more intense or harder radiation fields in the ionized gas relative to lower redshift. These radiation properties suggest that low metallicity may be common in typical 10 galaxies at . While a fraction of Main Sequence star formation in the first billion years may take place in conditions not dissimilar to lower redshift, lower metallicity may affect the remainder of the population.
1. Introduction
Massive galaxies started forming during the epoch of reionization at and may have experienced their fastest growth toward the end of the first billion years of cosmic time (), doubling their stellar mass content on time-scales of order a hundred million years (e.g., Bouwens et al. 2015; Faisst et al. 2016a). While the high redshift universe offers the promise of strong new constraints to dark matter physics through early halo growth (e.g., Buckley & Peter 2017), they have, so far, been limited to coarse stellar mass-halo mass relationships which do not capture the variety in galaxy formation history hinted at by observations (e.g., Behroozi et al. 2018; Moster et al. 2018; Tacchella et al. 2018). The details of such an early growth epoch at may also carry the imprint of cosmic re-ionization, therefore shining light on the physics of the dark ages (e.g., Ferrara 2016; Castellano et al. 2018; Ma et al. 2018).
Crucially, while abundant optical and near infrared (NIR) observations have revealed the end product of early galaxy formation (e.g., Bouwens et al. 2015), the drivers of such evolution are the gas processes of intense gas inflows, outflows, and cooling which lead to primordial star formation, galaxy growth, and dynamical assembly (e.g., Davé et al. 2011; Hopkins et al. 2014). Such gas flows are difficult to observe directly, but measurements of the gas conditions provide the most direct constraints on the physics of early galaxy evolution. For example, the observable gas phase metallicity probes the balance between gas inflows, outflows and metal enrichment due to star formation (e.g., Tremonti et al. 2004; Davé et al. 2012; Lilly et al. 2013). On the other hand, the relationship between local gas properties and star formation rate (the “star formation law”) in early, forming galaxies provides the critical link between observable stellar properties and the more fundamental properties of the interstellar gas (e.g., Sharda et al. 2018; Krumholz et al. 2018). Since the “star formation law” may emerge from the complex effects of stellar feedback and local gas dynamics, it is of great interest to explore its redshift evolution and any variations across galaxy types and gas conditions (e.g., Daddi et al. 2010a; Genzel et al. 2015; Scoville et al. 2016, 2017; Tacconi et al. 2018; Orr et al. 2018). A promising way to better constrain the gas metallicity and the star formation law in “normal” galaxies is to utilize tracers of the stat-forming gas phase. In this work, we take advantage of the latest radio and (sub)millimeter interferometers to probe such tracers up to the first billion years of cosmic time.
CO rotational transitions and atomic fine structure lines in the far infrared (FIR) provide some of the most accurate tracers of the properties of the star-forming interstellar medium (ISM) in galaxies because they are bright, unaffected by dust extinction and probe all the main gas phases (e.g., Stacey et al. 1991; Hollenbach & Tielens 1997; Kaufman et al. 1999; Carilli & Walter 2013). In order to constrain the star formation law we need to trace the cold, molecular gas mass because it is found to be most causally connected to star formation in local galaxies (Schruba et al., 2011; Bigiel et al., 2011; Leroy et al., 2013; Carilli & Walter, 2013). The best characterized tracers of such molecular gas are low-J rotational emission lines of the CO molecule, which have been calibrated within the Milky Way and in local galaxies, and achieve a high degree of consistency (e.g., Leroy et al. 2011; Sandstrom et al. 2013; Bolatto et al. 2013). These measurements may depend on metallicity estimates, since metallicity appears to strongly affect the fraction of molecular gas emitting CO lines and therefore, the gas mass-to-light ratio (e.g., Maloney & Black 1988; Madden et al. 1997; Kaufman et al. 1999; Bolatto et al. 2013). However, it is difficult to measure metallicity directly in the cold molecular medium because no hydrogen lines are directly accessible. Indirect tracers of metallicity typically involve either probes of the nitrogen abundance ratio to other metals or probes of the hardness and intensity of the radiation field (e.g., Masters et al. 2016; Vincenzo et al. 2016). The latter technique rests on observations of local dwarf galaxies, which have shown that lower metallicity environments may produce harder and more intense ultraviolet radiation, producing stronger lines from higher ionization states (e.g., Cormier et al. 2015; Croxall et al. 2017). Therefore, joint measurements of CO and of metallicity probes for the same sample are of key interest to relate high redshift observations to the mechanisms that have been investigated and understood at low redshift.
The [Cii] line at 158m is now commonly observed at high redshift as a probe of the star-forming gas and of the gas dynamics in star-forming galaxies due to its widespread distribution (e.g., Stacey et al. 1991; Maiolino et al. 2005, 2009; Walter et al. 2009; Stacey et al. 2010; Riechers et al. 2013, 2014). The [Cii]/IR luminosity ratio appears to trace the surface density of star formation, providing an important measure of starburstiness (e.g., Luhman et al. 1998; Malhotra et al. 2001). Crucially, metallicity was shown to be the primary variable controlling the residual scatter in the [Cii]/IR– relation (Smith et al., 2017). However, the [Cii] line can originate from gas where hydrogen is ionized, neutral or molecular. Therefore observations of additional diagnostic lines that probe specific phases of the ISM are required to connect observations to physical conditions. In particular, the [Nii] line at m is expected to be emitted under similar conditions of radiation intensity and gas density to [Cii], but uniquely from the ionized phase (e.g., Oberst et al. 2006; Decarli et al. 2014; Pavesi et al. 2016; Díaz-Santos et al. 2017), thereby assessing the fraction of [Cii] coming from the ionized rather than neutral gas. The [Cii]/[Nii] line ratio has been proposed as a metallicity tracer due to its sensitivity to abundance ratios (Nagao et al., 2011, 2012) and especially due to its sensitivity to the hardness of the radiation field as traced by the ionization state of carbon and nitrogen in the ionized gas (Cormier et al., 2015; Pavesi et al., 2016). Croxall et al. (2017) have now conclusively demonstrated a strong correlation between gas-phase metallicity and the [Cii]/[Nii] line ratio using a sample of local galaxies.
Few direct observations of the ISM in galaxies at are available, and the most luminous galaxies have almost exclusively been targeted to date, in particular quasar hosts and the brightest dusty star forming galaxies (DSFGs, Maiolino et al. 2005, 2009; Walter et al. 2009, 2012; Riechers et al. 2013, 2014; Gullberg et al. 2015; Strandet et al. 2017). Although their brightness allows a great level of detail (e.g., Riechers et al. 2013), it is unlikely that the conditions in the most extreme outliers are representative of typical galaxies. For example, although the fraction of dust obscured star formation in extreme starbursts is close to unity, and their metallicity may be close to solar (e.g., Magdis et al. 2011), the first ALMA sample study of [Cii] at 158m and dust emission from normal galaxies at and found lower dust emission than expected (Riechers et al., 2014; Capak et al., 2015; Barišić et al., 2017; Faisst et al., 2017). We have conducted these studies of galaxies in the parent sample which is constituted of “typical” (i.e., ) galaxies with selected from a representative spectroscopic sample containing galaxies in various evolutionary stages selected as Lyman Break Galaxies (LBGs) or Lyman Alpha Emitters (LAEs) (i.e., the two most common selection techniques at ). Since the ultraviolet luminosity of these galaxies is near the characteristic luminosity at , and as they lie near the star-forming Main Sequence (e.g., Speagle et al. 2014) as shown by Faisst et al. (2016a), we refer to these galaxies as “normal” in the following. Their properties significantly differ from massive, hyper-luminous starbursts and quasars which have been studied in most detail in ISM studies at to-date, and which are typically characterized by higher star formation rates (e.g., Riechers et al. 2014; Decarli et al. 2017). While the ultraviolet luminosity and stellar mass of all sample galaxies is approximately equal, one of the main results of our initial ALMA observations was the wide range of [Cii] and dust continuum luminosity observed (Capak et al., 2015). This wide range of FIR properties already in this small sample may suggest an evolutionary sequence, spanning the range from younger galaxies during their first major starburst to more “mature” and dust-rich galaxies bridging the gap to, traditionally sub-mm selected, DSFGs (e.g., Capak et al. 2015; Pavesi et al. 2016; Faisst et al. 2017). This interpretation is supported by an analysis of the IRX/ relation (Faisst et al., 2017), which found similar conditions as observed in massive galaxies at lower redshift in some galaxies while suggesting different dust properties (such as those observed in low metallicity dwarfs) for others.
In order to constrain the conditions for star formation, low-J CO transitions provide the best probe and the most direct comparison to lower redshift surveys (e.g., Daddi et al. 2010b; Tacconi et al. 2013, 2018). The cold molecular gas properties in “normal” star-forming galaxies are poorly constrained beyond . Even at only few significant detections have been achieved, mostly afforded by strong gravitational lensing (Coppin et al., 2007; Riechers et al., 2010a; Dessauges-Zavadsky et al., 2015, 2017), a serendipitous detection at (Gowardhan et al. 2017, 2019), and constraining upper limits for unlensed targets (e.g., Tan et al. 2013). The low detection rate could suggest a strong evolution in with redshift, possibly driven by a rapid metallicity evolution (Tan et al., 2013, 2014). However, as shown by Capak et al. (2015), standard selection techniques at yield a wide range of dust obscuration, which may suggest that a corresponding range of CO enrichment may also exist. We here present NSF’s Karl G. Jansky Very Large Array (VLA) observations of the CO(2–1) transition from the FIR-brightest “normal” galaxy of the Capak et al. (2015) sample and of another, times less FIR-bright, to obtain the first solid constraints at . We also discuss new ALMA measurements of the [Nii] line luminosity in all the galaxies from the Capak et al. (2015) sample with dust continuum and [Cii] detections.
In Section 2, we describe new VLA observations of the CO(2–1) line transition from HZ10 (), and those covering LBG-1 (; also named HZ6; Riechers et al. 2014; Capak et al. 2015) which were initially obtained as part of the CO Luminosity Density at High- (COLDz) survey (Pavesi et al., 2018a). We also present new ALMA observations targeting the [Nii] transition at m from the dust-detected sub-sample among those presented by Capak et al. (2015), composed of HZ4, LBG-1, HZ9 and HZ10, expanding our previous sample study (Pavesi et al., 2016). In Section 3 we present the results from the analysis of our CO and [Nii] measurements. In Section 4 we discuss the implications of our measurements for the metallicity, the state of maturity of the star-forming ISM and the “star formation law” of this sample of “normal” galaxies at . Finally, we present our conclusions in Section 5. In this work, we adopt a Chabrier IMF and a flat, CDM cosmology with km s-1 Mpc-1 and .
| Quantity | HZ4 | LBG-1 | HZ9 | HZ10 |
|---|---|---|---|---|
| [Cii] line properties | ||||
| (GHz) | ||||
| Redshift | ||||
| (mJy) | ||||
| (km s-1) | ||||
| (Jy km s-1) | ||||
| () | ||||
| deconvolved size | ||||
| size (kpc2) | ||||
| (mJy) | ||||
| [Nii] line properties | ||||
| (GHz) | — | |||
| (mJy) | — | |||
| (km s-1) | —a | |||
| (Jy km s-1) | ||||
| () | ||||
| (mJy) | ||||
| CO(2–1) line properties | ||||
| (GHz) | — | — | — | |
| (mJy) | — | — | — | |
| (km s-1) | — | —a | — | |
| (Jy km s-1) | — | — | ||
| ( K km s-1 pc2) | — | — | ||
| (Jy) | — | — |
2. Observations
2.1. VLA observations of CO(2–1)
We observed the CO(2–1) transition in HZ10 using the VLA in Ka band (project ID: 17A-011, PI: Pavesi). A complete description of these observations may be found in Pavesi et al. (2018b), which describes the properties of CRLE, an hyper-luminous DSFG at the same redshift as HZ10 and located within the same field view, with a separation of only 13′′. In three of the eight observing sessions the two intermediate frequencies (IFs) were tuned to the central frequency of the CO(2–1) line in HZ10, and to the adjacent frequency range to maximize continuum sensitivity. In the remaining five sessions the second IF was moved in order to provide uninterrupted coverage of the CO(2–1) line in CRLE, by partially overlapping the first IF (Pavesi et al., 2018b). The total observing time was 19.8 hrs, on source. We imaged the data with the clean algorithm in the Common Astronomy Software Application (casa version 4.7, using natural weighting for maximal sensitivity. The imaging of the CO line data results in a synthesized beam size of at the redshifted CO(2–1) frequency and in the continuum map. The rms noise at the position of HZ10 (i.e., at the phase center) is Jy beam-1 in a 35 km s-1 wide channel. The final rms noise when averaging over the line-free 2.0 GHz of bandwidth is Jy beam-1. The CO(2–1) transition in LBG-1 was observed as part of the COLDz survey (Pavesi et al., 2018a; Riechers et al., 2019), and a preliminary version was shown by Riechers et al. (2014). A complete description of these observations and of the imaging may be found in Pavesi et al. (2018a). The equivalent time on-source in the mosaic is 14 hours at the position of LBG-1. The imaging of the CO line data results in a synthesized beam size of at the redshifted CO(2–1) frequency and in the continuum map. The rms noise at the position of LBG-1 is Jy beam-1 in a 35 km s-1 wide channel. The final rms noise when averaging over the full 8 GHz of bandwidth is Jy beam-1.
2.2. ALMA observations of [Cii] and [Nii]
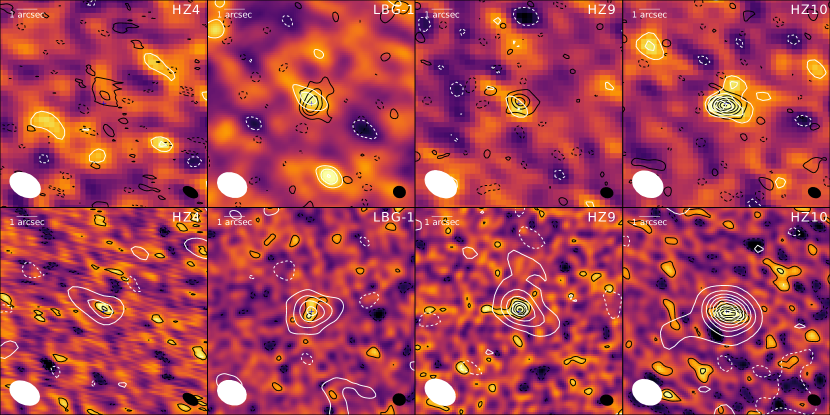
Our observations of the [Cii] line, data reduction and imaging for LBG-1 and HZ10 were previously described by Riechers et al. (2014); Capak et al. (2015), and Pavesi et al. (2016). The ALMA Cycle-1 observations targeting the [Cii] lines for HZ4 and HZ9, have previously been presented by Capak et al. (2015) and here we provide a brief description of the data that we have re-processed and re-analyzed. These observations were taken on 2013 November 4-16 in band 7 as part of a larger project (ID: 2012.1.00523.S, PI: Capak). The HZ4 pointing resulted in min on source with 28 usable antennae. Ganymede was observed as flux calibrator, J05223627 was observed as bandpass calibrator, and J10080621 was observed as amplitude/phase gain calibrator. The HZ9 data resulted in min on source with 27 antennae. Ganymede was observed as flux calibrator, J10372934 was observed as bandpass calibrator, and J10580133 was observed as amplitude/phase gain calibrator. In both cases the correlator was set up to target the expected frequency of the [Cii] line and to provide continuous coverage of the continuum emission in adjacent spectral windows with channels of MHz in Time Division Mode (TDM). casa version 4.5 was used for data reduction and analysis. All images and mosaics were produced with the clean algorithm, using natural weighting for maximal sensitivity. For HZ4, the imaging results in a synthesized beam size of at the redshifted [Cii] frequency and in the continuum map. The rms noise in the phase center is mJy beam-1 in a km s-1 wide channel and the final rms noise when averaging over all spectral windows (i.e. over a total GHz of bandwidth) is Jy beam-1. For HZ9, the imaging results in a synthesized beam size of at the redshifted [Cii] frequency and in the continuum map. The rms noise in the phase center is mJy beam-1 in a km s-1 wide channel and the final rms noise when averaging over all spectral windows (i.e. over a total GHz of bandwidth) is Jy beam-1.
Cycle-3 observations of [Nii] 205m targeting our sample galaxies were taken on 2016 January 1 and 5 in band 6, as part of two separate programs (2015.1.00928.S and 2015.1.00388.S, PIs: Pavesi and Lu, respectively) with one track from each program for HZ10 and LBG-1 and one track for HZ4 and HZ9 from the second program, taken in a compact configuration (max. baseline m). Observations from the first program were previously described by Pavesi et al. (2016), and the HZ10 observations for both programs were previously described by Pavesi et al. (2018b). We here present the remaining observations for LBG-1, HZ4 and HZ9. The two sets of observations for LBG-1 resulted in 64 min and 18 min on source respectively, with 41–45 usable m antennae under good weather conditions at 1.3 mm. The first set of observations was previously described by Pavesi et al. (2016). For the second set of observations of LBG-1, the nearby radio quasar J09480022 was observed regularly for amplitude and phase gain calibration, and J08542006 was observed for bandpass and flux calibration. The observations of HZ4 and HZ9 resulted in 30 and 47 min on source, with 45 and 47 usable m antennae, respectively. The same radio quasar was observed for amplitude and phase calibration as for LBG-1, and J1058+0133 was observed for bandpass and flux calibration. The correlator was set up in an identical configuration for these observations, to cover two spectral windows of 1.875 GHz bandwidth each at MHz (km s-1) resolution (dual polarization) in Time Division Mode (TDM), in each sideband. We estimate the overall accuracy of the flux calibration to be within . We used casa version 4.5 for data reduction and analysis. We combined data from all observations, and produced all images with the clean algorithm, using natural weighting for maximal point source sensitivity. Imaging the [Nii] data for HZ4 results in a synthesized beam size of at the redshifted [Nii] frequency of HZ4 and in the continuum map. The rms noise in the phase center is mJy beam-1 in a km s-1 wide channel. The final rms noise when averaging over the line free spectral windows (i.e. over a total GHz of bandwidth) is Jy beam-1. Imaging the [Nii] data for LBG-1 results in a synthesized beam size of at the redshifted [Nii] frequency of LBG-1 and in the continuum map. The rms noise in the phase center is mJy beam-1 in a km s-1 wide channel. The final rms noise when averaging over the line free spectral windows (i.e. over a total GHz of bandwidth) is Jy beam-1. Imaging the [Nii] data for HZ9 results in a synthesized beam size of at the redshifted [Nii] frequency of HZ9 and in the continuum map. The rms noise in the phase center is mJy beam-1 in a km s-1 wide channel. The final rms noise when averaging over the line free spectral windows (i.e. over a total GHz of bandwidth) is Jy beam-1. Imaging the [Nii] data for HZ10 results in a synthesized beam size of at the redshifted [Nii] frequency of HZ10 and in the continuum map. The rms noise in the phase center is mJy beam-1 in a km s-1 wide channel. The final rms noise when averaging over the line free spectral windows (i.e. over a total bandwidth of GHz) is Jy beam-1 (Figures 1 & 2).
| Quantity | HZ4 | LBG-1 | HZ9 | HZ10 |
|---|---|---|---|---|
| () | ||||
| SFR ( yr-1) | ||||
| ()a | ||||
| ()b | — | — | ||
| () |
3. Analysis
3.1. Dust continuum measurements
We detect dust continuum emission from the full galaxy sample at 158m and 205m (Figure 1, Table 1). No continuum signal is detected in the VLA observations targeting HZ10 and LBG-1 at 34 GHz (corresponding to rest-frame mm), yielding deep upper limits (Table 1). We measure the continuum flux at 158m and 205m by imaging all line-free channels using natural baseline weighting, and using the casa task imfit to fit a 2D Gaussian model to the emission. These detections and upper limits represent the only available constraints to the FIR SED and we use them in the following to constrain the FIR luminosity and to provide initial gas mass estimates through the Rayleigh-Jeans method.
We follow standard procedure and fit these continuum fluxes with a modified black-body smoothly connected to a mid-IR power law (e.g., Casey 2012; Riechers et al. 2014; Pavesi et al. 2016; Faisst et al. 2017). The results of the FIR SED fitting, together with the optical-to-FIR SED for the full galaxy sample, are shown in Appendix A. We adopt a Bayesian approach and employ a Markov Chain Monte-Carlo technique through emcee to infer the posterior distribution for the modified black-body parameters: dust temperature, dust emissivity parameter, mid-IR power law index, flux normalization and wavelength at which the optical depth equals unity. We adopt high dust temperature priors, as suggested by Faisst et al. (2017) for these galaxies. We employ Gaussian priors for the dust emissivity parameter (), for the dust temperature ( K), for the mid-IR power law index () and for the transition rest-frame wavelength to the optically thick regime (m). We note that the relative fluxes at 158m and 205m across our sample (with ratios ranging from to ) suggest a diversity of dust SED shapes. We derive far-infrared (FIR) luminosities by integrating between 42.5 and 122.5 m (Table 2). The available constraints are not sufficient to completely resolve the degeneracy between dust temperature and emissivity index variations, which are however fully captured by our Bayesian approach and contribute to the uncertainties quoted for the FIR luminosity. Because the dust spectral energy distributions (SEDs) are not constrained in the mid-IR, we follow the standard practice of adopting the FIR luminosities as an estimate of total IR, without extrapolating to shorter IR wavelengths (e.g., Riechers et al. 2014; Pavesi et al. 2018b). We caution, however, that this may be an under-estimate, and that the total IR luminosity may be 1.5-2 higher than the FIR alone.
In order to provide constraints on the gas masses in these galaxies independently from the CO measurements, we can use the Rayleigh-Jeans dust continuum emission. This will provide the first constraints to the conversion factor in “normal” galaxies at in the following. The Rayleigh-Jeans dust continuum emission has been used to estimate dust and gas masses, assuming an average emissivity and dust temperature for the dominant cold dust component, and a constant dust-to-gas ratio (Hildebrand 1983; Eales et al. 2012; Scoville 2013; Scoville et al. 2013, 2016, 2017; Bourne et al. 2013; Groves et al. 2015). The dependence on cold dust temperature and dust-to-gas ratio may make the Rayleigh-Jeans method less reliable than at lower redshifts (e.g., Pavesi et al. 2018b). On the other hand, the opposing effects of increasing dust temperatures, and decreasing dust-to-gas ratios that may occur in “normal” galaxies at high redshift may partially compensate each other, as also found in recent simulations that are consistent with this approach to gas mass measurement (e.g., Privon et al. 2018; Liang et al. 2018). We here adopt Equations 10 and 13 in Scoville et al. (2016) to derive gas mass estimates based on our continuum flux measurements, through the same assumptions which were used in those lower redshift samples (Scoville et al., 2016, 2017). The 34 GHz upper limits imply gas mass limits of for HZ10 and for LBG-1, adopting the relation derived by Scoville et al. (2016, 2017). We also use the 230 GHz continuum fluxes to derive approximate estimates, although these measurements may not lie on the Rayleigh-Jeans tail, and therefore may not accurately trace the cold dust component. These continuum measurements would imply gas masses of for HZ4, for LBG-1, for HZ9, and for HZ10, with dominant systematic uncertainties due to the extrapolation of the method to very high redshift.

3.2. CO measurements
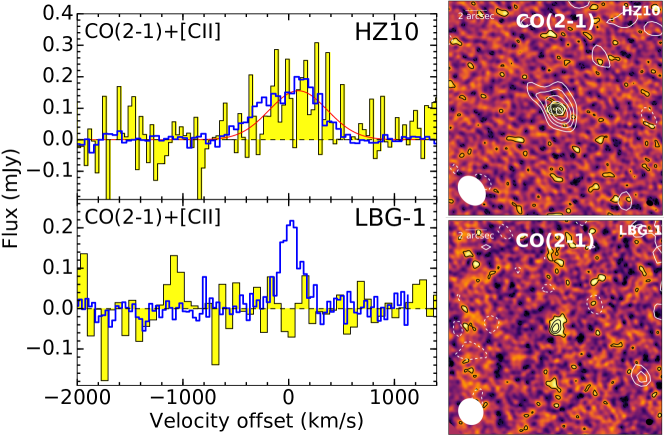
We detect CO(2–1) line emission from HZ10 with a significance of , and provide a constraining upper limit to the CO(2–1) emission toward LBG-1 (Figure 3). We extract an aperture spectrum for HZ10111We adopt elliptical apertures of sizes equal to the FWHM of the best fit 2D Gaussian to the integrated line emission. and a single pixel spectrum at the peak position of the [Cii] emission toward LBG-1, in order to measure or constrain the CO(2–1) line properties (Table 1). The CO(2–1) emission toward HZ10 appears slightly resolved, although the coarse resolution of compact array configuration observations does not allow a precise size determination. We use casa uvmodelfit to fit a circular Gaussian model to the line visibilities in HZ10 and derive a deconvolved FWHM size of for the CO(2–1) emission, corresponding to kpc, which is compatible with the [Cii] and [Nii] size estimates. We do not make use of this size estimate in the following, but use it to validate that CO and [Cii] emission sizes for our target are consistent within the relative uncertainties. Since we find compatible values we will adopt [Cii] emission sizes for gas reservoir sizes in the following222This is a common assumption, since both CO and [Cii] trace the extent of the gas distribution (e.g., De Breuck et al. 2014; Litke et al. 2019).
Our upper limit indicates that CO(2–1) line emission from LBG-1 is unexpectedly weak, relative to low redshift trends. This may be expected as a consequence of low metallicity and relatively low dust abundance (Bolatto et al., 2013), and as previously observed at on multiple occasions (e.g., Genzel et al. 2012; Tan et al. 2014). LBG-1 shows an unusually high inferred [Cii]/CO(1–0) luminosity ratio (, Figure 3), relative to the value in HZ10 () and to the values commonly measured in local starbursts and high redshift galaxies (; e.g., Wolfire et al. 1989; Stacey et al. 1991, 2010) and to a sample of high redshift dusty star forming galaxies (; e.g., Gullberg et al. 2015). The high ratios observed in LBG-1 cannot be explained within standard PDR models, but they naturally arise as a consequence of lower metallicity (e.g., Maloney & Black 1988; Stacey et al. 1991; Madden et al. 1997). In particular, low metallicity dwarf galaxies typically show similar ratios of (e.g., Cormier et al. 2014; Jameson et al. 2018). On the other hand, the normal ratio observed in HZ10 points to star-forming gas properties that are similar to what is observed in lower redshift Main Sequence galaxies.
The CO(2–1) line luminosity is expected to provide a reliable estimate of the molecular gas mass. However, several factors affect the proportionality factor such as heating from, and contrast against, the cosmic microwave background (CMB; e.g., da Cunha et al. 2013) and the strong metallicity dependence of the CO luminosity per unit molecular gas mass (e.g., Bolatto et al. 2013). Current samples including both dusty star-forming galaxies, and main-sequence galaxies at high redshift show nearly thermalized gas excitation up to the J=2–1 transition (; e.g., Carilli & Walter 2013; Daddi et al. 2015). Here, we therefore assume a brightness temperature ratio of between the CO J=2–1 and 1–0 transitions. CMB contributions at are only weakly constrained without additional CO excitation measurements. da Cunha et al. (2013) suggest that we may expect the observed CO line flux to be suppressed by a factor at this redshift. We do not attempt to estimate this effect independently, but simply absorb it into the definition of .
We can use the gas mass estimates based on the Rayleigh-Jeans dust continuum emission to constrain the conversion factor by assuming that the gas mass is dominated by molecular gas. The main uncertainties inherent in the Rayleigh-Jeans dust method are a dependence on the gas-to-dust ratio and on dust properties affecting the dust SED. The effects of these uncertainties dominate over the CO and dust continuum measurement uncertainties. The gas mass estimates presented in Section 3.1 imply constraints to 333Units of assumed throughout the following of ( based on the 220 GHz flux) for HZ10 and 444In order to deal with relative uncertainties of order unity throughout this work, we adopt the convention of quoting Gaussian-equivalent percentiles. Therefore, uncertainty ranges correspond to 16th, 50th and 84th percentiles and limits are defined to imply a 99.7% probability. Propagation of these uncertainties to derived quantities was carried out by numerical sampling and evaluation of posterior distribution percentiles. Lognormal distributions were used to sample skewed distributions described by asymmetric ranges. Upper limits from non-detections are treated as positive-truncated (enforcing a uniform prior), 0-centered Gaussians with specified standard deviation as determined by the noise level. based on the 230 GHz flux for LBG-1. These estimates are dominated by the systematic uncertainty inherent in extrapolating the Rayleigh-Jeans method to very high redshift where it has not yet been validated. These approximate estimates are in agreement with our inference of “normal” star-forming gas properties for HZ10, with near the Milky Way value, and of lower metallicity gas in LBG-1, as signaled by an elevated .
3.3. Dynamical mass and gas mass constraints
In order to estimate dynamical masses for the full galaxy sample, we adopt a commonly used empirical procedure based on the line width and the gas emission size inferred from the integrated line emission which was calibrated on disk galaxy simulations (e.g., Daddi et al. 2010b). The advantage of such method is the applicability to our full galaxy sample, and a more straightforward comparison to most dynamical mass estimates available in the literature, which are typically relying on such estimates (e.g., Tacconi et al. 2008; Förster Schreiber et al. 2009; Engel et al. 2010; Walter et al. 2012; Carilli & Walter 2013; Riechers et al. 2014; Capak et al. 2015; Venemans et al. 2016; Decarli et al. 2016; Oteo et al. 2016).
We apply this technique by using the line FWHM, the fitted half-light radii of the [Cii] emission and the disk inclination from the ratio of minor to major axes (Table 2). The inferred dynamical mass for LBG-1 is times lower than previous estimates, although within the original uncertainties, due to a revised [Cii] size and due to differences in the method employed (Riechers et al., 2014). However, dynamical mass estimates for LBG-1 may be affected by complex velocity structure due to interactions.
In Appendix B we present an alternative dynamical analysis which directly models the observed visibilities555The main advantage of such visibility-based rather than image-based approaches is independence from deconvolution and imaging and from the statistical dependence of image pixels introduced by the non-local synthesized beam., following the method previously described by Pavesi et al. (2018b). The inferred dynamical mass estimates are in agreement with those derived by Jones et al. (2017) based on tilted-rings modeling in the image plane, and with those based on the Daddi et al. (2010b) method for HZ9 and HZ10.
We can therefore use our dynamical masses to provide approximate estimates of the total gas masses in the full sample, by accounting for the contribution of stellar666 Stellar masses for all our galaxies are constrained by the rich multi-wavelength coverage available in the COSMOS field and were measured by Capak et al. (2015) and Laigle et al. (2016) for the entire parent sample and are typically uncertain to within a factor (Table 2). The stellar mass fits include deep (25.5 AB mag) COSMOS/SPLASH (Steinhardt et al., 2014) Spitzer/IRAC photometry to probe wavelengths redder than rest-frame 4000 Å, which is crucial for constraining stellar masses to this accuracy (e.g, Faisst et al. 2016b; Laigle et al. 2016). However, we caution that stellar masses at are difficult to constrain because the rest-frame m wavelength emission, which is the most accurate tracer, will not be observable in such faint galaxies at until the James Webb Space Telescope becomes operational. and dark matter masses (25%) following Daddi et al. (2010b). Using the CO line luminosity measurements and limits in HZ10 and LBG-1, these independent gas mass estimates allow us to place the first constraints to the conversion factor in normal galaxies at this redshift. The dynamical mass estimates would imply total gas masses of for LBG-1, for HZ9 and for HZ10. If we assume this gas mass to be dominated by molecular gas, and thus, divide by the CO line luminosity constraints777Following the procedure explained in footnote 4, these estimates imply an (in units of ) of for HZ10, but do not provide a significant constraint for LBG-1888Due to the large uncertainty in the gas mass estimate, the 3 CO limit only implies a 3 limit of when appropriately propagated through posterior sampling. See footnote 4.. The estimated factor for HZ10 is compatible with the Milky Way value (, in the same units; Bolatto et al. 2013) which may also apply to main-sequence disk galaxies (Daddi et al., 2010b; Carilli & Walter, 2013; Tacconi et al., 2013; Genzel et al., 2015). In the following, we assume a fixed value of for definiteness, in order to derive and constrain gas masses in HZ10 and LBG-1 (Table 2, Figure 4), with the caveat that this value may only be a lower limit in the case of LBG-1, due to metallicity effects (e.g., Bolatto et al. 2013).
3.4. Constraints to high redshift star formation
To study the star formation efficiency in HZ10 and LBG-1, first we directly compare the FIR to CO luminosity (Figure 5) relative to expectations based on previous determinations of the star formation law in the local and high redshift Universe (Carilli & Walter, 2013). Daddi et al. (2010a) and Genzel et al. (2010) measured a relationship between the CO luminosity and the SFR (or IR luminosity) for lower redshift Main Sequence disk galaxies which is indicative of an underlying “star formation law”, and found broad agreement within the significant scatter of the observed correlation. We here aim to investigate its evolution toward higher redshift. The relationship by Daddi et al. (2010a) would predict total IR luminosities of for HZ10 and for LBG-1, respectively, based on the CO luminosity which are compatible with our direct FIR luminosity estimates. Therefore, we find no evidence for an evolution in the star formation law for Main Sequence galaxies all the way up to , although larger samples are necessary to statistically assess this finding.
Adopting our best estimate of the gas mass and the star formation rate in HZ10 (Table 2) yields a gas depletion timescale (the inverse of the star formation efficiency) of Myr,999 Uncertainties were propagated from both the star formation rate and the gas mass estimates. which is significantly longer than what is commonly measured in local and high redshift starburst galaxies (Myr; e.g., Carilli & Walter 2013). HZ10 therefore appears to be very rich in molecular gas, and the efficiency of star formation appears compatible with what is commonly observed in lower redshift, disk-like, main-sequence galaxies (Gyr; e.g., Leroy et al. 2013; Tacconi et al. 2013, 2018).
The IR luminosity of LBG-1 is at least a factor of 2 higher than estimates based on its CO luminosity and the star formation law, suggesting that the CO luminosity in LBG-1 is lower than in lower redshift galaxies with comparable SFR (Figure 5). If we adopt our best estimates for the SFR in LBG-1 based on the inferred IR luminosity, we can obtain estimates of the gas depletion timescale for the gas masses derived from the long-wavelength dust method (Myr), from the dynamical mass constraints (Myr), and CO upper limit Gyr with 99.7% probability when assuming .
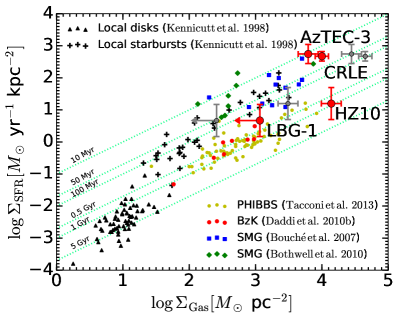
We can also use our estimates for the gas reservoir physical sizes derived from the [Cii] line to compare the gas surface density to the star formation rate density probed by the dust continuum flux and size (Figure 5), probing the physical drivers of star formation more directly, i.e., the Kennicutt-Schmidt law (Kennicutt, 1998; Leroy et al., 2008; Bigiel et al., 2008; Daddi et al., 2010a; Bigiel et al., 2011; Schruba et al., 2011; Kennicutt & Evans, 2012; Leroy et al., 2013). Specifically, we include in this comparison both Main Sequence galaxies at (Tacconi et al., 2013; Daddi et al., 2010a) and intensely star forming sub-millimeter galaxies (SMGs, Bouché et al. 2007; Bothwell et al. 2010). In particular, we focus our comparison on CRLE and AzTEC-3, two hyper-luminous DSFGs at which are located in physical proximity of HZ10 and LBG-1, respectively. Based on their global gas masses and SFR, the gas depletion timescales for CRLE and AzTEC-3 are Myr (Riechers et al., 2010b, 2014; Pavesi et al., 2018b), i.e., an order of magnitude shorter than we observe in HZ10 and LBG-1. We divide each of the SFR and gas masses by the area within the FWHM of the best-fit elliptical Gaussian source model (e.g., De Breuck et al. 2014; Spilker et al. 2016; Litke et al. 2019), uniformly for our sample of two “normal” and two starburst galaxies at . Following Riechers et al. (2014), Spilker et al. (2016), and Hodge et al. (2016), we use the dust continuum sizes at m as representative of the extent of the star-forming region, since the emission at such short wavelength is dominated by the actively star-forming region. We follow De Breuck et al. (2014) and Litke et al. (2019) in using the [Cii] line emission size as a proxy for the extent of the gas reservoir101010Spilker et al. (2016) and Calistro Rivera et al. (2018), among others, clarified the importance of not inferring the gas reservoir extent from dust continuum sizes, in this context.. Due to the compactness of the star formation in AzTEC-3 and CRLE, the local depletion timescale characterizing the ratio of gas and SFR surface densities are as short as Myr, while our estimates for HZ10 and LBG-1 are Gyr and Myr, respectively (Figure 5). Therefore, the physical efficiency, in terms of surface densities, may potentially differ by up to two orders of magnitude already among these galaxies at . The comparison shown by Figure 5 shows that, while AzTEC-3 and CRLE have high star formation efficiency compatible with other high redshift starbursts, HZ10 (and to a lesser degree LBG-1) appear to exhibit the lower efficiencies, longer depletion times typically observed in Main Sequence disks at lower redshift. Although the depletion time measurement in HZ10 is incompatible with that in starbursts (e.g., Silverman et al. 2015, 2018), the systematic uncertainty implies compatibility with both the efficiency in disk galaxies (e.g., Leroy et al. 2013) but also the potentially higher efficiency suggested for Main Sequence galaxies by Tacconi et al. (2013), Genzel et al. (2015), Scoville et al. (2016, 2017), and Tacconi et al. (2018).


3.5. [Nii] measurements
To complement our view of the star forming gas in our sample galaxies, we observed the [Nii] m line emission which is one of the best tracers of the ionized component of the ISM. The [Cii]/[Nii] line ratio is the tool of choice to determine the fraction of [Cii] emission coming from ionized gas (e.g., Oberst et al. 2006; Decarli et al. 2014; Pavesi et al. 2016). This quantity is itself a probe of the physical conditions of the gas which is directly exposed to recent star formation, and may be a probe of the radiation intensity, hardness and hence, indirectly, of the gas-phase metallicity. Metallicity directly affects our interpretation of CO observations (since it is one of the main drivers of the variation in ), and it offers unique insights into the balance between fresh gas inflow and ISM enrichment through previous star formation. The analysis in this section expands on previous analysis presented by Pavesi et al. (2016).
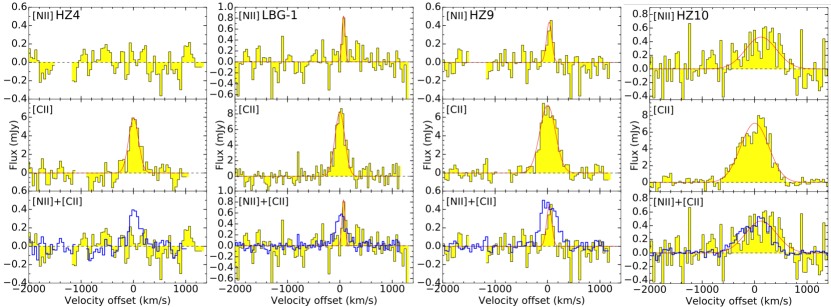
We tentatively detect [Nii] m emission toward LBG-1 (at ), and HZ9 (at ), we confidently detect it from HZ10 (at ), and we provide a constraining upper limit for HZ4 (Figures 1 & 2). We confirm previous results on LBG-1 and HZ10 (Pavesi et al., 2016) by achieving a higher signal-to-noise ratio. We measure [Nii] and [Cii] line properties using aperture spectra consistently for the whole sample (Table 1, see footnote 1). The [Nii] emission from HZ10 appears extended, at limited significance (, Figure 1). In order to measure the [Nii] emission size, we fit a circular Gaussian model to the integrated [Nii] line visibilities from HZ10, using casa uvmodelfit. We estimate a deconvolved [Nii] spatial FWHM size of for HZ10, formally corresponding to kpc. We use the same technique to measure an effective circular [Cii] size of , corresponding to kpc, which is compatible with our more sophisticated uv plane modeling (Appendix B). The [Nii] line emission could be marginally more extended than the [Cii] emission, but higher resolution and higher signal to noise [Nii] observations are necessary to confirm this tentative finding. In particular, a manual inspection of the uv-radial profile of the [Nii] line visibilities appears compatible with the size of the [Cii] emission within the relative uncertainties.
We do not detect spatial offsets between the [Nii] and [Cii] line emission in LBG-1, HZ9 and HZ10. Although we now confirm that the [Nii] line emission in HZ10 comes from the full [Cii] velocity range, the comparison of the [Nii] and [Cii] spectra (Figure 2) suggests a possible differential intensity ratio, with stronger [Nii] intensity coming from the red part of the emission which dominated the lower signal-to-noise detection found by Pavesi et al. 2016. The [Nii] line velocity width appears narrower than [Cii] toward LBG-1 and HZ9 at the current sensitivity of our measurements, although the limited signal-to-noise does not allow for a reliable measurement of the line widths .
To enable a more comprehensive study, we here update our measurement of the [Cii]/[Nii] line ratio for HZ10 and LBG-1 (Pavesi et al., 2016), and we expand the sample to include HZ9 and HZ4 (Table 1, Figure 6). We confirm the relatively low line ratio for HZ10, which is compatible with most local and high redshift active star-forming galaxies (Pavesi et al., 2016). On the other hand, we find substantially higher ratios for HZ9, LBG-1 and HZ4, which are only compatible with the ratio observed in local dwarf galaxies (Figure 6) and provides further evidence for the diversity of conditions at already present in this small sample.
As previously described by Pavesi et al. (2016), a high [Cii]/[Nii] line ratio may be expected in the case of very high gas density, or of high intensity and hardness of the radiation field. The latter explanation appears consistent with observations of a high line ratio in local dwarf galaxies by Cormier et al. (2015), which may be interpreted as the consequence of high radiation intensity and hardness due to low metallicity conditions. A high intensity and hardness radiation field is expected to induce higher ionization states in the ionized gas. This implies weak [Nii] and [Cii] emission from ionized gas because nitrogen, carbon and oxygen are expected to be in a higher ionization state. This prediction is testable by observing strong [Niii] m and [Oiii] m or m emission lines. Croxall et al. (2017) recently confirmed this interpretation using observations of local star-forming galaxies from the KINGFISH sample. They conclusively reported a strong correlation of the [Cii]/[Nii] line ratio with gas-phase metallicity, concluding that metallicity appears to be the main driver of this line ratio. Therefore, in analogy to the case of local dwarf galaxies, we interpret our high line ratio measurements and limits for HZ9, LBG-1 and HZ4 as indicative of low gas (and stellar) metallicity, relative to galaxies of comparable masses (). On the other hand, the lower line ratio observed in HZ10 suggests higher metallicity in this galaxy, confirming the inference based on high dust and CO emission, and suggesting a particularly “mature, normal” galaxy at the same epoch (see also discussion by Faisst et al. 2017). We note that an alternative interpretation for the low [Nii] luminosity in our high redshift sample may invoke lower nitrogen abundance, relative to carbon. While this abundance ratio change may also be a consequence of low metallicity conditions due to the secondary nature of nitrogen, the carbon abundance dependence on gas phase metallicity is not well constrained. We follow Díaz-Santos et al. (2017) and assume a line ratio of in the ionized gas to infer fractions of [Cii] coming from PDRs of for HZ10, for HZ9, for LBG-1 and % for HZ4.
4. Discussion
The detection of bright CO emission from HZ10 represents the highest redshift CO detection from a “normal”, Main Sequence galaxy to date (the next highest redshift CO line from an unlensed Main Sequence galaxy was serendipitously detected by Gowardhan et al. 2017, 2019 at ). We note that HZ10 appears to have a very high gas fraction based on the measured CO luminosity ( with high confidence and likely , Figure 4). Such high gas fractions may be expected at based on the extrapolation of observed trends (e.g., Magdis et al. 2012; Genzel et al. 2015; Tacconi et al. 2018). A high gas fraction may also potentially be connected with the possibility of a galaxy merger in HZ10 since merging galaxies have been found to potentially show enhanced gas fractions (e.g., Pavesi et al. 2018a). Assuming would imply a times lower gas fraction for LBG-1, potentially suggesting significant scatter within the general population. However, the low CO luminosity in LBG-1 is likely to be due to low metallicity, as suggested by the faint [Nii] emission, and the gas fraction may therefore be substantially higher in practice.
Zavala et al. (2018) recently reported observations of CO and [Cii] emission lines from the strongly lensed galaxy G09 83808 at , presenting analogies with HZ10. Although the inferred CO(1–0) luminosity of G09 83808 is approximately three times lower than HZ10, the dust continuum emission is at least twice as bright at rest-frame 158 m, indicating a significantly higher star formation efficiency than found in HZ10. Therefore, while G09 83808 appears to have only few times higher star formation rate than HZ10, its star formation properties resemble starbursts such as CRLE and AzTEC-3, while HZ10 is more gas rich and exhibits star forming conditions compatible with lower redshift Main Sequence, disk galaxies. This finding is in agreement with the ten times higher [Cii]/FIR ratio in HZ10 relative to G09 83808. This ratio is a probe of the local physical density of star formation and is inversely proportional to the starburst intensity. Based on PDR models, a fixed PDR gas density implies that the far UV (FUV) field intensity (G0) scales inversely with [Cii]/FIR (to a power of ) (Wolfire et al., 1990; Kaufman et al., 1999; Stacey et al., 2010). This scaling implies that the FUV intensity in G09 83808 may be times higher than in HZ10, confirming that HZ10 may be forming stars in a much less intense environment.
The finding of significant dust and, especially, CO emission from HZ10 suggests that a fraction of “normal” galaxies (not extreme starbursts) at may be rich in molecular gas and significantly metal-enriched, in contrast to some previous indications (e.g., Tan et al. 2013, 2014). This finding is in agreement with the recent measurement of a high volume density of CO-selected galaxies at by the CO Luminosity Density at High-z (COLDz) project (Pavesi et al., 2018a; Riechers et al., 2019). Although the galaxies selected by COLDz at are bright starbursts, their volume density is significantly higher than predicted by current models (Riechers et al., 2019). If HZ10 had been located within the COLDz field of view it would have been selected by the blind line search based on the survey detection limit (Pavesi et al., 2018a), therefore placing an upper limit to the volume density of evolved, gas-rich “normal” galaxies at with CO luminosity greater than HZ10 of Mpc-3 (Riechers et al., 2019).
HZ10 is believed to reside in a galaxy overdensity at , potentially indicating a protocluster environment (Pavesi et al., 2018b). In particular, the presence of the bright hyper-starburst CRLE only kpc away constitutes evidence for a possible physical association. This association with the massive, dusty galaxy CRLE and the protocluster may be related to the advanced evolutionary stage of HZ10. If this connection were confirmed, it would point to a more rapid evolution for galaxies in higher density environments (e.g., Chiang et al. 2017).
The PHIBBS survey has measured star formation efficiency and gas fractions for lower redshift Main Sequence galaxies (up to ; Tacconi et al. 2013; Genzel et al. 2015; Tacconi et al. 2018). Based on the extrapolation of the latest measured trends reported by Tacconi et al. (2018), combining the PHIBBS CO measurements with the dust-based estimates by Scoville et al. (2016, 2017) we can estimate the average gas fractions and depletion times expected for Main Sequence galaxies such as HZ10 at . We derive an approximate gas depletion timescale of Myr, which is compatible with our estimate for HZ10 within . The molecular gas fraction predicted by the fitting formula suggested by Tacconi et al. (2018) is 111111The quadratic fitting formula predicts, perhaps artificially, a turnover of the trend at , which is lower than observed in HZ10. Our observations therefore suggest that the increase in molecular gas fraction with redshift may continue beyond , although with limited statistical power due to the small sample size. In summary, HZ10 shows the characteristic properties of lower redshift Main Sequence galaxies, all the way back to the first billion years of cosmic time.
Vallini et al. (2018) presented some of the latest models of the CO line emission from “normal” galaxies at . They modeled the radiative transfer affecting CO emission from a clumpy molecular medium in a Main Sequence galaxy at . Although their model galaxy is characterized by sub-solar (0.5) metallicity they predict a low effective CO conversion factor of due to the dominant effect of warmer gas, high turbulence and high gas surface density (Vallini et al., 2018). While such a low may be allowed for HZ10, it is ruled out for the more typical LBG-1 if the gas mass is predominantly molecular. In addition, the predicted CO luminosity for the “typical” model galaxy is times lower than observed in HZ10, suggesting that the molecular gas mass may be significantly underestimated. Therefore, HZ10 may be more mature and may therefore not be analogous to the model galaxy, but rather to the lower redshift Main Sequence galaxies observed at . Although our constraints for the CO luminosity in LBG-1 are compatible with the model predictions, the higher dynamical mass estimates suggest higher gas masses for LBG-1 than the molecular mass predicted by the models. A possible interpretation of this result may invoke a significant fraction of gas in the atomic phase, which may dominate the total gas mass in such “typical”, massive galaxies. Based on the [Cii] luminosity in LBG-1 we can derive an estimate of the atomic PDR mass of (following Stacey et al. 1991), which may be comparable to the molecular gas mass for low , but it is unlikely to provide the total gas mass inferred from our dynamical mass estimate.
The measurement of [Cii] and dust continuum emission from the first sample of “normal”, rest-UV selected galaxies revealed a variety of star-forming conditions (Capak et al., 2015). The finding of bright CO line emission from HZ10 and faint emission from LBG-1 is in agreement with the interpretation of a range of metallicities and dust-to-gas ratios being the main contributors to the variation within the sample (Capak et al., 2015). This interpretation is strongly supported by the significant difference in [Cii]/[Nii] ratios between HZ10 and LBG-1 already noted by Pavesi et al. (2016). Faint [Nii] emission relative to [Cii] directly implies (with the possible caveat of differences in the C/N abundance ratio) low contribution of the ionized gas to the [Cii] emission, which may therefore be predominantly due to emission from neutral PDRs. The simplest interpretation for faint [Nii] emission suggests higher ionization conditions in the ionized gas, predicting bright [Niii] and [Oiii] emission, instead. This interpretation would suggest that intensity and, especially, hardness of the radiation field may be the most relevant physical parameter affecting this line ratio. Recent detections of bright [Oiii] 88 m line emission at high redshift support this interpretation and suggest that [Oiii] may be even brighter than [Cii] in “normal” galaxies at very high redshift (e.g., Inoue et al. 2016; Laporte et al. 2017; Carniani et al. 2017; Marrone et al. 2018; Hashimoto et al. 2018b, c, a; Tamura et al. 2018), as typically observed in local dwarfs (Cormier et al., 2015). Furthermore, recent optical studies of LBGs and LAEs have also found increasing [Oiii] brightness at high redshift together with high sSFR and low metallicity (e.g., Strom et al. 2017a, b). The metallicity dependence may also be responsible for the downturn due to reduced oxygen abundance at even lower metallicity (Harikane et al., 2018).
Faisst et al. (2017) explore the level of maturity, stellar population properties and dust attenuation in “normal” galaxies through the IRX/ diagnostic plane. While IRX, defined as the ratio , represents the prevalence of dust-obscured star-formation, is the power-law slope of the UV emission, which bears the imprint of dust reddening. A correlation between these quantities was observed to hold for local starburst galaxies, and approximately holding up to high redshift (e.g., Meurer et al. 1999; Reddy et al. 2006, 2010, 2018; Bouwens et al. 2016), however variations may be expected due to varying dust properties, star-formation geometry and stellar population ages (e.g., Faisst et al. 2017; Narayanan et al. 2018). These diagnostics suggest that HZ10 may resemble dusty star-forming galaxies, with elevated IR to UV luminosity ratio, intriguingly sharing similarities to lower redshift IR-selected galaxies (e.g., Casey et al. 2014). However, HZ10 was selected through the LBG and LAE techniques at and appears “typical” based on its UV emission. In particular, HZ10 lies within the scatter of the Main Sequence at this redshift (e.g., Speagle et al. 2014; Capak et al. 2015; Barišić et al. 2017; Faisst et al. 2017). Faisst et al. (2017) also interpret the observed properties of LBG-1 as being consistent with lower dust and metal abundances, likely connected to young stellar populations. The IRX/ diagnostic, however, would suggest that HZ4, and especially HZ9, may be more dusty than LBG-1 since they lie on or above the local Meurer et al. (1999) relation (Faisst et al., 2017). However, the measured [Cii]/[Nii] ratios for HZ4 and HZ9 are compatible with that in LBG-1 and significantly higher than the ratio in HZ10 (Figure 6). The intriguing finding of faint [Nii] emission together with relatively bright dust continuum in HZ9 therefore suggests the presence of additional variables controlling the relationship between the level of dust obscuration and the metallicity (or age of the most recent stellar population) which may be critical to diagnose the interplay between gas inflows, outflows and star formation. An important next step would require measuring the CO line luminosity from HZ9 as well as achieving a detection in LBG-1. In case of relatively bright CO emission (e.g., in relation to its FIR luminosity) from HZ9, the high [Cii]/[Nii] line ratio would not be explained by the analogy to local dwarf galaxies and would point to previously unexplored star formation conditions. However, faint CO line emission from HZ9 would either suggest variations in the dust SED shape or would intriguingly suggest the possibility of significant dust-obscured star formation even in more “typical”, lower metallicity, younger high redshift galaxies. The ratio of our continuum measurements tentatively suggests higher dust temperatures in HZ9 than in HZ10. If correct, this might imply that the moderate IR luminosity in HZ9 may be due to higher temperatures, perhaps associated with higher radiation intensity, rather than a high dust content (Faisst et al., 2017). Béthermin et al. (2015) already presented evidence in favor of such rising radiation field intensity and dust temperatures toward higher redshift, and showed that these may be a direct consequence of decreasing metallicity. Ferrara et al. (2017) suggested that galaxies at may be FIR-faint due to colder dust than “normal” due to the very high molecular gas fraction. Their prediction of bright CO emission, specifically from galaxies with low IRX, may be in conflict with our deep upper limits on the CO luminosity from LBG-1. However, this effect may link the high molecular gas mass fraction in HZ10 to the tentatively lower dust temperature we observe in this galaxy relative to the rest of the sample (Ferrara et al., 2017).
The faint [Nii] emission from HZ4 and HZ9, together with significant dust-obscured star formation, may be analogous to the properties observed in the eastern component of SPT0311-58 (Marrone et al., 2018). This galaxy at was shown to display high [Oiii] 88m luminosity ( its [Cii] luminosity) while being characterized by very high dust-obscured star formation (at the level observed in HZ9 and HZ10). Similarly, the bright [Oiii] emitters studied by Hashimoto et al. (2018b) and Tamura et al. (2018) at which also show significant dust emission may be somewhat analogous to the case we observe in HZ9, i.e., high intensity and hardness of the radiation causing a higher ionization state in the ionized ISM while showing significant dust-obscured star formation. Furthermore, a comparison of the [Oiii]/[Cii] luminosity in two quasars at suggests that this line ratio may strongly correlate with dust temperatures (Hashimoto et al., 2018a), supporting our interpretation of higher dust temperatures in [Nii]-faint galaxies. We therefore suggest that a higher dust temperature may drive the observed FIR luminosity in such galaxies, perhaps due to a significant contribution from dust in the ionized regions (Faisst et al., 2017).
In order to assess how common the different star forming conditions observed in LBG-1, HZ9 and HZ10 are, larger samples of “normal” galaxies at need to be studied. The ALMA Large Program to Investigate [Cii] at Early Times (ALPINE)121212https://cesam.lam.fr/a2c2s/index.php, is now observing the [Cii] and dust emission from large samples of typical galaxies at over a wide range of stellar mass and star formation rate. While the brightness of [Cii] and dust continuum, and their relation to the ultra-violet flux, provide a wealth of information (e.g., distinguishing LBG-1 from HZ10-type conditions), our analysis shows that relevant residual degrees of freedom are unconstrained unless either CO or a tracer of the ionized gas (such as [Nii], [Niii] or [Oiii]) is measured in addition to [Cii] (to distinguish HZ10 from HZ9-type conditions) possibly due to metallicity, and/or dust temperature variations. Furthermore, resolved observations for larger samples of galaxies are necessary because accurate dynamical masses may be the best way to constrain the gas mass and, hence, to directly infer the conversion factor.
5. Conclusions
We have presented measurements of CO(2–1) line emission from two “normal” Lyman Break Galaxies galaxies, at the end of the “Epoch of Reionization”, achieving the highest redshift low-J CO detection from a Main Sequence galaxy to date. We have found large variation in the CO line luminosity between the two targeted sources which may not be completely accounted for by SFR differences (the CO luminosity ratio is 6.5 while the SFR ratio is ). While this difference in CO luminosity may suggest variations in star formation efficiency, it appears consistent with our expectation of lower gas metallicity and dust abundance strongly affecting the CO abundance. We infer a large molecular gas reservoir in at least one of the sources, suggesting low efficiency star formation with gas depletion time 1 Gyr already at , analogous to what is commonly observed in lower redshift disk galaxies. This low efficiency contrasts to what is typically observed in starbursts and provides the first evidence of such “Main sequence” star-forming conditions at . We also find evidence for a continuously rising gas fraction up to , although our sample may suggest either significant scatter or systematic variations in the conversion factor.
By observing the largest sample of “normal” galaxies at in [Nii] 205m emission to date, we find a general trend of increasing [Cii]/[Nii] ratios with lower IR luminosity; consistent with what was previously reported by Pavesi et al. (2016). Our findings support an interpretation where low gas and stellar metallicity raise the ionization state of carbon and nitrogen in the ionized gas. This interpretation suggest that the large majority of [Cii] emission from most “normal” galaxies at may emerge from the neutral gas phase. We also find a high [Cii]/[Nii] ratio in our sample with moderate IR luminosity, suggesting either significant dust temperature variations affecting the IR luminosity estimate, or the possibility of a young starburst with high radiation intensity and hardness (and potentially low metallicity) together with substantial dust obscuration. Our findings imply that a significant fraction of Main Sequence star formation taking place up to may resemble the conditions observed in “normal” galaxies at lower redshift, suggesting that the efficiency of star formation may only weakly depend on those physical properties which are affected by redshift evolution. In particular, the high inferred gas fractions and the higher merger rates do not appear to significantly affect Main Sequence star formation. Although low metallicity may be common in the Main Sequence galaxy population at , we do not find conclusive evidence for an effect on the star forming conditions, although larger samples and more sensitive observations are needed to study this fainter population.
Acknowledgments We thank Chelsea Sharon and Avani Gowardhan for useful discussion. R.P. and D.R. acknowledge support from the National Science Foundation under grant number AST-1614213 to Cornell University. R.P. acknowledges support through award SOSPA3-008 from the NRAO. The National Radio Astronomy Observatory is a facility of the National Science Foundation operated under cooperative agreement by Associated Universities, Inc. This paper makes use of the following ALMA data: ADS/JAO.ALMA#2015.1.00928.S, 2015.1.00388.S, 2012.1.00523.S, 2011.0.00064.S. ALMA is a partnership of ESO (representing its member states), NSF (USA) and NINS (Japan), together with NRC (Canada), NSC and ASIAA (Taiwan), and KASI (Republic of Korea), in cooperation with the Republic of Chile. The Joint ALMA Observatory is operated by ESO, AUI/NRAO and NAOJ.
Appendix A A. Spectral energy distribution
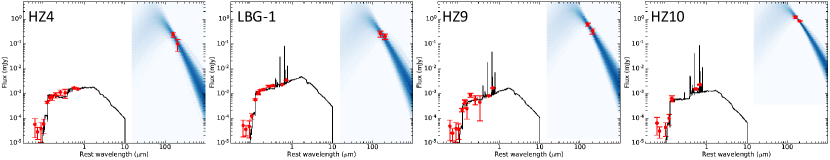
Here we present the results of modified blackbody fitting to the available dust continuum observations in the full galaxy sample. The limited sampling of the dust emission is responsible for the high uncertainties on the predicted FIR peak. We illustrate the results of our probabilistic analysis by a gradient of color shading, derived using the results of the MCMC samples, showing the fitting results and higher confidence regions in darker shading (Figure 7). We also present best fit stellar emission models to the archival optical and NIR observations as templates, previously described by Capak et al. (2015).
Appendix B B. Dynamical Modeling
We have carried out a dynamical modeling analysis directly on the visibilities for the [Cii] observations in HZ9 and HZ10 using GALARIO (Tazzari et al., 2018) and Multinest (Feroz et al., 2009), using the method131313 Python code available at https://github.com/pavesiriccardo/UVmodeldisk previously described by Pavesi et al. (2018b). While the [Cii] line in HZ9 and HZ10 shows a smooth velocity gradient, the line in LBG-1 shows a more complex morphology and dynamics, with three components, and two separate velocity gradients (Riechers et al., 2014). Therefore we do not attempt modeling the emission from LBG-1, as the data are not sufficient to properly constrain such a high-complexity model. Although the [Cii] line in HZ10 shows a smooth velocity gradient, the HST NIR and dust continuum images from ALMA suggest the presence of two separate morphological components. These may be associated with either a galaxy merger, or with clumpy gas and stellar distributions, embedded in a rotating disk. The somewhat asymmetric [Cii] line profile may also be caused by massive gas clumps, as shown by the simulations of Daddi et al. (2010b); Bournaud et al. (2014, 2015).
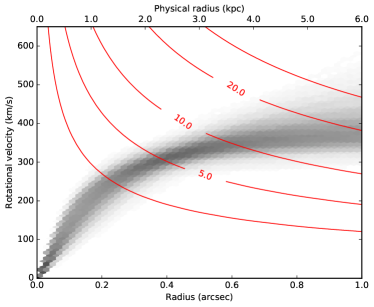
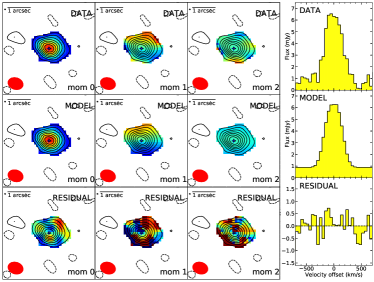
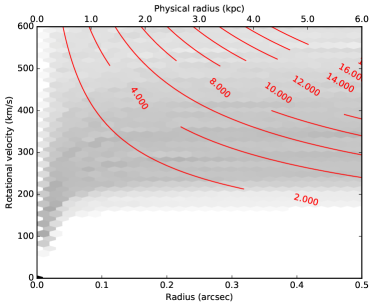
We simultaneously fit a rotating disk model generated by KinMS (Davis et al., 2013) to the line emission and a simple continuum model (one and two Gaussian components for HZ9 and HZ10, respectively). We model the line emission intensity as a Gaussian profile and the rotation curve as a “tangent” function parametrised by the maximum velocity and the half-maximum radius (Table 3). We fit a total of 18 parameters for HZ10 (also including line flux, disk center along each coordinate and continuum sizes, fluxes and position for both components) and 12 parameters for HZ9 (also including line flux, disk center along each coordinate and continuum size and flux) as afforded by the available signal-to-noise ratio. The data, median parameter model (indistinguishable from the best-fit model) and residuals are shown in Figures 8 and 9, together with the derived probabilistic constraints to the rotation curve as a function of radius and the implied dynamical masses enclosed within that radius.
Because of the limitation of assuming a single disk model, we note that substantial uncertainties regarding the detailed dynamics of HZ10 affect our inference as evidenced by the non-negligible residual structure after model fitting. We use the disk model scale-length and rotation curve to derive dynamical mass estimates within the half-light radius, by adopting the measured rotational velocity. We do not apply corrections for velocity dispersion because the physical origin of the apparent dispersion is uncertain (particularly in the case of HZ10, for which two distinct components may be partly responsible for the line broadening). We estimate that these systematic corrections may be as large as , toward increasing the dynamical masses inferred by fitting a rotating disk, based on the measured gas dispersion (km s-1 and km s-1 for HZ9 and HZ10, respectively). We obtain for HZ10 and only an approximate estimate of for HZ9, within the half light radius of the [Cii] emission. Our results agree within the uncertainties with previous estimates based on tilted-ring modeling in the image plane by Jones et al. (2017), although our uncertainty estimates are significantly more conservative due to the larger number of fitted parameters.
| HZ10 | HZ9 | |||||
| Parameter (Units) | 16th perc. | 50th perc. | 84th perc. | 16th perc. | 50th perc. | 84th perc. |
| Gas dispersion (km s-1) | 210 | 218 | 226 | 80 | 89 | 100 |
| Emission FWHM (arcsec) | 0.84 | 0.88 | 0.91 | 0.47 | 0.51 | 0.55 |
| Maximum velocity (km s-1) | 380 | 430 | 510 | 300 | 445 | 750 |
| Velocity scale length (arcsec) | 0.12 | 0.18 | 0.28 | 0.014 | 0.03 | 0.08 |
| Inclination (degrees) | 59 | 61 | 63 | 13 | 21 | 31 |
| Position angle (degrees) | 71 | 77 | 83 |

References
- Barišić et al. (2017) Barišić, I., Faisst, A. L., Capak, P. L., et al. 2017, ApJ, 845, 41
- Behroozi et al. (2018) Behroozi, P., Wechsler, R., Hearin, A., & Conroy, C. 2018, ArXiv e-prints, arXiv:1806.07893
- Béthermin et al. (2015) Béthermin, M., Daddi, E., Magdis, G., et al. 2015, A&A, 573, A113
- Béthermin et al. (2016) Béthermin, M., De Breuck, C., Gullberg, B., et al. 2016, A&A, 586, L7
- Bigiel et al. (2008) Bigiel, F., Leroy, A., Walter, F., et al. 2008, AJ, 136, 2846
- Bigiel et al. (2011) Bigiel, F., Leroy, A. K., Walter, F., et al. 2011, ApJ, 730, L13
- Bolatto et al. (2013) Bolatto, A. D., Wolfire, M., & Leroy, A. K. 2013, ARA&A, 51, 207
- Bothwell et al. (2010) Bothwell, M. S., Chapman, S. C., Tacconi, L., et al. 2010, MNRAS, 405, 219
- Bouché et al. (2007) Bouché, N., Cresci, G., Davies, R., et al. 2007, ApJ, 671, 303
- Bournaud et al. (2015) Bournaud, F., Daddi, E., Weiß, A., et al. 2015, A&A, 575, A56
- Bournaud et al. (2014) Bournaud, F., Perret, V., Renaud, F., et al. 2014, ApJ, 780, 57
- Bourne et al. (2013) Bourne, N., Dunne, L., Bendo, G. J., et al. 2013, MNRAS, 436, 479
- Bouwens et al. (2015) Bouwens, R. J., Illingworth, G. D., Oesch, P. A., et al. 2015, ApJ, 803, 34
- Bouwens et al. (2016) Bouwens, R. J., Aravena, M., Decarli, R., et al. 2016, ApJ, 833, 72
- Buckley & Peter (2017) Buckley, M. R., & Peter, A. H. G. 2017, ArXiv e-prints, arXiv:1712.06615
- Calistro Rivera et al. (2018) Calistro Rivera, G., Hodge, J. A., Smail, I., et al. 2018, ApJ, 863, 56
- Capak et al. (2015) Capak, P. L., Carilli, C., Jones, G., et al. 2015, Nature, 522, 455
- Carilli et al. (2013) Carilli, C. L., Riechers, D., Walter, F., et al. 2013, ApJ, 763, 120
- Carilli & Walter (2013) Carilli, C. L., & Walter, F. 2013, ARA&A, 51, 105
- Carniani et al. (2017) Carniani, S., Maiolino, R., Pallottini, A., et al. 2017, A&A, 605, A42
- Casey (2012) Casey, C. M. 2012, MNRAS, 425, 3094
- Casey et al. (2014) Casey, C. M., Scoville, N. Z., Sanders, D. B., et al. 2014, ApJ, 796, 95
- Castellano et al. (2018) Castellano, M., Pentericci, L., Vanzella, E., et al. 2018, ApJ, 863, L3
- Chiang et al. (2017) Chiang, Y.-K., Overzier, R. A., Gebhardt, K., & Henriques, B. 2017, ApJ, 844, L23
- Combes et al. (2012) Combes, F., Rex, M., Rawle, T. D., et al. 2012, A&A, 538, L4
- Coppin et al. (2007) Coppin, K. E. K., Swinbank, A. M., Neri, R., et al. 2007, ApJ, 665, 936
- Cormier et al. (2014) Cormier, D., Madden, S. C., Lebouteiller, V., et al. 2014, A&A, 564, A121
- Cormier et al. (2015) —. 2015, A&A, 578, A53
- Croxall et al. (2017) Croxall, K. V., Smith, J. D., Pellegrini, E., et al. 2017, ApJ, 845, 96
- da Cunha et al. (2013) da Cunha, E., Groves, B., Walter, F., et al. 2013, ApJ, 766, 13
- Daddi et al. (2010a) Daddi, E., Elbaz, D., Walter, F., et al. 2010a, ApJ, 714, L118
- Daddi et al. (2010b) Daddi, E., Bournaud, F., Walter, F., et al. 2010b, ApJ, 713, 686
- Daddi et al. (2015) Daddi, E., Dannerbauer, H., Liu, D., et al. 2015, A&A, 577, A46
- Davé et al. (2011) Davé, R., Finlator, K., & Oppenheimer, B. D. 2011, MNRAS, 416, 1354
- Davé et al. (2012) —. 2012, MNRAS, 421, 98
- Davis et al. (2013) Davis, T. A., Alatalo, K., Bureau, M., et al. 2013, MNRAS, 429, 534
- De Breuck et al. (2014) De Breuck, C., Williams, R. J., Swinbank, M., et al. 2014, A&A, 565, A59
- Decarli et al. (2014) Decarli, R., Walter, F., Carilli, C., et al. 2014, ApJ, 782, L17
- Decarli et al. (2016) Decarli, R., Walter, F., Aravena, M., et al. 2016, ApJ, 833, 70
- Decarli et al. (2017) Decarli, R., Walter, F., Venemans, B. P., et al. 2017, Nature, 545, 457
- Dessauges-Zavadsky et al. (2015) Dessauges-Zavadsky, M., Zamojski, M., Schaerer, D., et al. 2015, A&A, 577, A50
- Dessauges-Zavadsky et al. (2017) Dessauges-Zavadsky, M., Zamojski, M., Rujopakarn, W., et al. 2017, A&A, 605, A81
- Díaz-Santos et al. (2013) Díaz-Santos, T., Armus, L., Charmandaris, V., et al. 2013, ApJ, 774, 68
- Díaz-Santos et al. (2017) —. 2017, ApJ, 846, 32
- Eales et al. (2012) Eales, S., Smith, M. W. L., Auld, R., et al. 2012, ApJ, 761, 168
- Engel et al. (2010) Engel, H., Tacconi, L. J., Davies, R. I., et al. 2010, ApJ, 724, 233
- Faisst et al. (2016a) Faisst, A. L., Capak, P., Hsieh, B. C., et al. 2016a, ApJ, 821, 122
- Faisst et al. (2016b) Faisst, A. L., Capak, P. L., Davidzon, I., et al. 2016b, ApJ, 822, 29
- Faisst et al. (2017) Faisst, A. L., Capak, P. L., Yan, L., et al. 2017, ApJ, 847, 21
- Farrah et al. (2013) Farrah, D., Lebouteiller, V., Spoon, H. W. W., et al. 2013, ApJ, 776, 38
- Feroz et al. (2009) Feroz, F., Hobson, M. P., & Bridges, M. 2009, MNRAS, 398, 1601
- Ferrara (2016) Ferrara, A. 2016, in Understanding the Epoch of Cosmic Reionization: Challenges and Progress, ed. A. Mesinger, Vol. 423, 163
- Ferrara et al. (2017) Ferrara, A., Hirashita, H., Ouchi, M., & Fujimoto, S. 2017, MNRAS, 471, 5018
- Förster Schreiber et al. (2009) Förster Schreiber, N. M., Genzel, R., Bouché, N., et al. 2009, ApJ, 706, 1364
- Geach et al. (2011) Geach, J. E., Smail, I., Moran, S. M., et al. 2011, ApJ, 730, L19
- Genzel et al. (2010) Genzel, R., Tacconi, L. J., Gracia-Carpio, J., et al. 2010, MNRAS, 407, 2091
- Genzel et al. (2012) Genzel, R., Tacconi, L. J., Combes, F., et al. 2012, ApJ, 746, 69
- Genzel et al. (2015) Genzel, R., Tacconi, L. J., Lutz, D., et al. 2015, ApJ, 800, 20
- Gowardhan et al. (2019) Gowardhan, A., Riechers, D., Pavesi, R., et al. 2019, ApJ, 875, 6
- Gowardhan et al. (2017) Gowardhan, A., Riechers, D. A., Daddi, E., et al. 2017, ApJ, 838, 136
- Groves et al. (2015) Groves, B. A., Schinnerer, E., Leroy, A., et al. 2015, ApJ, 799, 96
- Gullberg et al. (2015) Gullberg, B., De Breuck, C., Vieira, J. D., et al. 2015, MNRAS, 449, 2883
- Harikane et al. (2018) Harikane, Y., Ouchi, M., Shibuya, T., et al. 2018, ApJ, 859, 84
- Hashimoto et al. (2018a) Hashimoto, T., Inoue, A. K., Tamura, Y., et al. 2018a, ArXiv e-prints, arXiv:1811.00030
- Hashimoto et al. (2018b) Hashimoto, T., Inoue, A. K., Mawatari, K., et al. 2018b, ArXiv e-prints, arXiv:1806.00486
- Hashimoto et al. (2018c) Hashimoto, T., Laporte, N., Mawatari, K., et al. 2018c, Nature, 557, 392
- Herrera-Camus et al. (2016) Herrera-Camus, R., Bolatto, A., Smith, J. D., et al. 2016, ApJ, 826, 175
- Hildebrand (1983) Hildebrand, R. H. 1983, Quarterly Journal of the Royal Astronomical Society, 24, 267
- Hodge et al. (2016) Hodge, J. A., Swinbank, A. M., Simpson, J. M., et al. 2016, ApJ, 833, 103
- Hollenbach & Tielens (1997) Hollenbach, D. J., & Tielens, A. G. G. M. 1997, Annual Review of Astronomy and Astrophysics, 35, 179
- Hopkins et al. (2014) Hopkins, P. F., Kereš, D., Oñorbe, J., et al. 2014, MNRAS, 445, 581
- Inoue et al. (2016) Inoue, A. K., Tamura, Y., Matsuo, H., et al. 2016, Science, 352, 1559
- Jameson et al. (2018) Jameson, K. E., Bolatto, A. D., Wolfire, M., et al. 2018, ApJ, 853, 111
- Jones et al. (2017) Jones, G. C., Carilli, C. L., Shao, Y., et al. 2017, ApJ, 850, 180
- Kaufman et al. (1999) Kaufman, M. J., Wolfire, M. G., Hollenbach, D. J., & Luhman, M. L. 1999, ApJ, 527, 795
- Kennicutt & Evans (2012) Kennicutt, R. C., & Evans, N. J. 2012, ARA&A, 50, 531
- Kennicutt (1998) Kennicutt, Jr., R. C. 1998, ApJ, 498, 541
- Krumholz et al. (2018) Krumholz, M. R., Burkhart, B., Forbes, J. C., & Crocker, R. M. 2018, MNRAS, 477, 2716
- Laigle et al. (2016) Laigle, C., McCracken, H. J., Ilbert, O., et al. 2016, ApJS, 224, 24
- Laporte et al. (2017) Laporte, N., Ellis, R. S., Boone, F., et al. 2017, ApJ, 837, L21
- Leroy et al. (2008) Leroy, A. K., Walter, F., Brinks, E., et al. 2008, AJ, 136, 2782
- Leroy et al. (2009) Leroy, A. K., Walter, F., Bigiel, F., et al. 2009, AJ, 137, 4670
- Leroy et al. (2011) Leroy, A. K., Bolatto, A., Gordon, K., et al. 2011, ApJ, 737, 12
- Leroy et al. (2013) Leroy, A. K., Walter, F., Sandstrom, K., et al. 2013, AJ, 146, 19
- Liang et al. (2018) Liang, L., Feldmann, R., Faucher-Giguère, C.-A., et al. 2018, MNRAS, 478, L83
- Lilly et al. (2013) Lilly, S. J., Carollo, C. M., Pipino, A., Renzini, A., & Peng, Y. 2013, ApJ, 772, 119
- Litke et al. (2019) Litke, K. C., Marrone, D. P., Spilker, J. S., et al. 2019, ApJ, 870, 80
- Lu et al. (2018) Lu, N., Cao, T., Díaz-Santos, T., et al. 2018, ApJ, 864, 38
- Luhman et al. (1998) Luhman, M. L., Satyapal, S., Fischer, J., et al. 1998, ApJ, 504, L11
- Ma et al. (2018) Ma, X., Hopkins, P. F., Garrison-Kimmel, S., et al. 2018, MNRAS, 478, 1694
- Madden et al. (1997) Madden, S. C., Poglitsch, A., Geis, N., Stacey, G. J., & Townes, C. H. 1997, ApJ, 483, 200
- Magdis et al. (2011) Magdis, G. E., Daddi, E., Elbaz, D., et al. 2011, ApJ, 740, L15
- Magdis et al. (2012) Magdis, G. E., Daddi, E., Béthermin, M., et al. 2012, ApJ, 760, 6
- Magnelli et al. (2012) Magnelli, B., Saintonge, A., Lutz, D., et al. 2012, A&A, 548, A22
- Maiolino et al. (2009) Maiolino, R., Caselli, P., Nagao, T., et al. 2009, A&A, 500, L1
- Maiolino et al. (2005) Maiolino, R., Cox, P., Caselli, P., et al. 2005, A&A, 440, L51
- Malhotra et al. (2001) Malhotra, S., Kaufman, M. J., Hollenbach, D., et al. 2001, ApJ, 561, 766
- Maloney & Black (1988) Maloney, P., & Black, J. H. 1988, ApJ, 325, 389
- Marrone et al. (2018) Marrone, D. P., Spilker, J. S., Hayward, C. C., et al. 2018, Nature, 553, 51
- Masters et al. (2016) Masters, D., Faisst, A., & Capak, P. 2016, ApJ, 828, 18
- Meurer et al. (1999) Meurer, G. R., Heckman, T. M., & Calzetti, D. 1999, ApJ, 521, 64
- Moster et al. (2018) Moster, B. P., Naab, T., & White, S. D. M. 2018, MNRAS, 477, 1822
- Nagao et al. (2012) Nagao, T., Maiolino, R., De Breuck, C., et al. 2012, A&A, 542, L34
- Nagao et al. (2011) Nagao, T., Maiolino, R., Marconi, A., & Matsuhara, H. 2011, A&A, 526, A149
- Narayanan et al. (2018) Narayanan, D., Davé, R., Johnson, B. D., et al. 2018, MNRAS, 474, 1718
- Oberst et al. (2006) Oberst, T. E., Parshley, S. C., Stacey, G. J., et al. 2006, ApJ, 652, L125
- Orr et al. (2018) Orr, M. E., Hayward, C. C., Hopkins, P. F., et al. 2018, MNRAS, 478, 3653
- Oteo et al. (2016) Oteo, I., Ivison, R. J., Dunne, L., et al. 2016, ApJ, 827, 34
- Pavesi et al. (2016) Pavesi, R., Riechers, D. A., Capak, P. L., et al. 2016, ApJ, 832, 151
- Pavesi et al. (2018a) Pavesi, R., Sharon, C. E., Riechers, D. A., et al. 2018a, ApJ, 864, 49
- Pavesi et al. (2018b) Pavesi, R., Riechers, D. A., Sharon, C. E., et al. 2018b, ApJ, 861, 43
- Privon et al. (2018) Privon, G. C., Narayanan, D., & Davé, R. 2018, ApJ, 867, 102
- Rawle et al. (2014) Rawle, T. D., Egami, E., Bussmann, R. S., et al. 2014, ApJ, 783, 59
- Reddy et al. (2010) Reddy, N. A., Erb, D. K., Pettini, M., Steidel, C. C., & Shapley, A. E. 2010, ApJ, 712, 1070
- Reddy et al. (2006) Reddy, N. A., Steidel, C. C., Fadda, D., et al. 2006, ApJ, 644, 792
- Reddy et al. (2018) Reddy, N. A., Oesch, P. A., Bouwens, R. J., et al. 2018, ApJ, 853, 56
- Riechers et al. (2010a) Riechers, D. A., Carilli, C. L., Walter, F., & Momjian, E. 2010a, ApJ, 724, L153
- Riechers et al. (2010b) Riechers, D. A., Capak, P. L., Carilli, C. L., et al. 2010b, ApJ, 720, L131
- Riechers et al. (2013) Riechers, D. A., Bradford, C. M., Clements, D. L., et al. 2013, Nature, 496, 329
- Riechers et al. (2014) Riechers, D. A., Carilli, C. L., Capak, P. L., et al. 2014, ApJ, 796, 84
- Riechers et al. (2019) Riechers, D. A., Pavesi, R., Sharon, C. E., et al. 2019, ApJ, 872, 7
- Sandstrom et al. (2013) Sandstrom, K. M., Leroy, A. K., Walter, F., et al. 2013, ApJ, 777, 5
- Schruba et al. (2011) Schruba, A., Leroy, A. K., Walter, F., et al. 2011, AJ, 142, 37
- Scoville et al. (2013) Scoville, N., Arnouts, S., Aussel, H., et al. 2013, ApJS, 206, 3
- Scoville et al. (2016) Scoville, N., Sheth, K., Aussel, H., et al. 2016, ApJ, 820, 83
- Scoville et al. (2017) Scoville, N., Lee, N., Vanden Bout, P., et al. 2017, ApJ, 837, 150
- Scoville (2013) Scoville, N. Z. 2013, Evolution of star formation and gas, ed. J. Falcón-Barroso & J. H. Knapen, 491
- Sharda et al. (2018) Sharda, P., Federrath, C., da Cunha, E., Swinbank, A. M., & Dye, S. 2018, MNRAS, 477, 4380
- Silverman et al. (2015) Silverman, J. D., Daddi, E., Rodighiero, G., et al. 2015, ApJ, 812, L23
- Silverman et al. (2018) Silverman, J. D., Rujopakarn, W., Daddi, E., et al. 2018, ApJ, 867, 92
- Smith et al. (2017) Smith, J. D. T., Croxall, K., Draine, B., et al. 2017, ApJ, 834, 5
- Speagle et al. (2014) Speagle, J. S., Steinhardt, C. L., Capak, P. L., & Silverman, J. D. 2014, ApJS, 214, 15
- Spilker et al. (2016) Spilker, J. S., Bezanson, R., Marrone, D. P., et al. 2016, ApJ, 832, 19
- Stacey et al. (1991) Stacey, G. J., Geis, N., Genzel, R., et al. 1991, ApJ, 373, 423
- Stacey et al. (2010) Stacey, G. J., Hailey-Dunsheath, S., Ferkinhoff, C., et al. 2010, ApJ, 724, 957
- Steinhardt et al. (2014) Steinhardt, C. L., Speagle, J. S., Capak, P., et al. 2014, ApJ, 791, L25
- Strandet et al. (2017) Strandet, M. L., Weiss, A., De Breuck, C., et al. 2017, ApJ, 842, L15
- Strom et al. (2017a) Strom, A. L., Steidel, C. C., Rudie, G. C., Trainor, R. F., & Pettini, M. 2017a, ArXiv e-prints, arXiv:1711.08820
- Strom et al. (2017b) Strom, A. L., Steidel, C. C., Rudie, G. C., et al. 2017b, ApJ, 836, 164
- Tacchella et al. (2018) Tacchella, S., Bose, S., Conroy, C., Eisenstein, D. J., & Johnson, B. D. 2018, ArXiv e-prints, arXiv:1806.03299
- Tacconi et al. (2008) Tacconi, L. J., Genzel, R., Smail, I., et al. 2008, ApJ, 680, 246
- Tacconi et al. (2013) Tacconi, L. J., Neri, R., Genzel, R., et al. 2013, ApJ, 768, 74
- Tacconi et al. (2018) Tacconi, L. J., Genzel, R., Saintonge, A., et al. 2018, ApJ, 853, 179
- Tamura et al. (2018) Tamura, Y., Mawatari, K., Hashimoto, T., et al. 2018, ArXiv e-prints, arXiv:1806.04132
- Tan et al. (2013) Tan, Q., Daddi, E., Sargent, M., et al. 2013, ApJ, 776, L24
- Tan et al. (2014) Tan, Q., Daddi, E., Magdis, G., et al. 2014, A&A, 569, A98
- Tazzari et al. (2018) Tazzari, M., Beaujean, F., & Testi, L. 2018, MNRAS, 476, 4527
- Tremonti et al. (2004) Tremonti, C. A., Heckman, T. M., Kauffmann, G., et al. 2004, ApJ, 613, 898
- Umehata et al. (2017) Umehata, H., Matsuda, Y., Tamura, Y., et al. 2017, ApJ, 834, L16
- Vallini et al. (2018) Vallini, L., Pallottini, A., Ferrara, A., et al. 2018, MNRAS, 473, 271
- Venemans et al. (2016) Venemans, B. P., Walter, F., Zschaechner, L., et al. 2016, ApJ, 816, 37
- Vincenzo et al. (2016) Vincenzo, F., Belfiore, F., Maiolino, R., Matteucci, F., & Ventura, P. 2016, MNRAS, 458, 3466
- Wagg et al. (2010) Wagg, J., Carilli, C. L., Wilner, D. J., et al. 2010, A&A, 519, L1
- Walter et al. (2009) Walter, F., Riechers, D., Cox, P., et al. 2009, Nature, 457, 699
- Walter et al. (2012) Walter, F., Decarli, R., Carilli, C., et al. 2012, Nature, 486, 233
- Wolfire et al. (1989) Wolfire, M. G., Hollenbach, D., & Tielens, A. G. G. M. 1989, ApJ, 344, 770
- Wolfire et al. (1990) Wolfire, M. G., Tielens, A. G. G. M., & Hollenbach, D. 1990, ApJ, 358, 116
- Zavala et al. (2018) Zavala, J. A., Montaña, A., Hughes, D. H., et al. 2018, Nature Astronomy, 2, 56
- Zhao et al. (2016) Zhao, Y., Lu, N., Xu, C. K., et al. 2016, ApJ, 819, 69