Two circumstellar nebulae discovered with the Wide-field Infrared Survey Explorer and their massive central stars
Abstract
We report the discovery of two mid-infrared nebulae in the northern hemisphere with the Wide-field Infrared Survey Explorer and the results of optical spectroscopy of their central stars, BD+60 2668 (composed of two components, separated from each other by 3 arcsec) and ALS 19653, with the Calar Alto 3.5-m telescope and the Southern African Large Telescope (SALT), respectively. We classify the components of BD+60 2668 as stars of spectral types B0.5 II and B1.5 III. ALS 19653 is indicated in the SIMBAD data base as a planetary nebula, while our observations show that it is a massive B0.5 Ib star, possibly in a binary system. Using the stellar atmosphere code fastwind, we derived fundamental parameters of the three stars as well as their surface element abundances, implying that all of them are either on the main sequence or only recently left it. This provides further evidence that massive stars can produce circumstellar nebulae while they are still relatively unevolved. We also report the detection of optical counterparts to the mid-infrared nebulae and a second, more extended optical nebula around ALS 19653, and present the results of SALT spectroscopy of both nebulae associated with this star. The possible origin of the nebulae is discussed.
1 Introduction
Mid-infrared (IR) surveys of the inner regions of the Galactic plane and several other sites of massive star formation in the Milky Way carried out by the Spitzer Space Telescope led to the discovery of many dozens of nebulae reminiscent of circumstellar nebulae around evolved massive stars (Gvaramadze, Kniazev & Fabrika 2010b; Wachter et al. 2010; Mizuno et al. 2010). Follow-up spectroscopic observations of central sources of these nebulae showed that many of them are massive stars at different evolutionary stages (e.g. Gvaramadze et al. 2009, 2010b; Wachter et al. 2010; Stringfellow et al. 2012a, 2012b; Flagey et al. 2014; Kniazev & Gvaramadze 2015; Silva et al. 2017). Although Spitzer has covered the areas of the sky where most IR nebulae produced by massive stars are expected to reside, a significant number of yet undetected nebulae might remain to be uncovered. With the advent of the Wide-field Infrared Survey Explorer (WISE; Wright et al. 2010) and its all-sky survey it became possible to search for mid-IR nebulae in regions not observed by Spitzer, which allowed us to discover several dozens of new nebulae (e.g. Gvaramadze et al. 2012).
The origin of circumstellar nebulae around massive stars is primarily due to copious mass loss inherent to these stars at different stages of their life. For example, the compact (pc-scale) nebulae around Wolf-Rayet stars of late nitrogen sequence are produced in the course of interactions between the fast Wolf-Rayet wind and the slow, dense material lost during the preceding red supergiant phase (e.g. Brighenti & D’Ercole 1995; Garcia-Segura, Langer & Mac Low 1996). The red supergiants themselves can also produce compact circumstellar nebulae, provided that their wind is confined by some external factors (e.g. Morris & Jura 1983; Mackey et al. 2014). Most often, the circumstellar nebulae are found around (candidate) luminous blue variables (LBVs) (Nota et al. 1995; Clark, Larionov & Arkharov 2005), and it is believed that they are produced by either instant mass ejections or by brief (maybe recurrent) episodes of enhanced mass loss (Humphreys & Davidson 1994). Currently more than 70 per cent of stars of this type are known to be associated with nebulae of various shapes (Kniazev, Gvaramadze & Berdnikov 2015).
The bipolar morphology of some nebulae associated with massive stars suggests that their formation is somehow related to the (nearly critical) rotation of their underlying stars (Langer 1998). The high rotational velocity of massive stars could be intrinsic to some of them from birth or could be achieved in the course of stellar evolution, e.g. because of contraction of a single star during the transition from core-H to core-He burning or because of mass transfer in a close binary system. Since the majority of massive stars form in binary or multiple systems (e.g. Chini et al. 2012; Sana et al. 2012), the binarity may actually be the most important factor responsible for the origin of circumstellar nebulae. Indeed, the presence of a second star may not only spin-up its companion, but also may trigger various modes of mass loss from the system, as it was proposed to explain a variety of shapes of planetary nebulae (e.g. Morris 1981; Livio, Salzman & Shaviv 1979; Fabian & Hansen 1979; Corradi & Schwarz 1993; Mastrodemos & Morris 1999; De Marco 1999). Moreover, a significant fraction of massive stars are subject to binary interaction processes (including mergers) already during the main sequence stage (Sana et al. 2012; de Mink et al. 2014), implying that circumstellar nebulae could be produced by relatively unevolved stars.
The stellar material ejected in the course of binary interaction, e.g. during the common envelope evolution or merger of the binary components, is expected to be concentrated close to the orbital plane of the system. The resulting flattened (disc-like) circumstellar structure can, in principle, collimate the fast wind of the post-interaction binary or the merger product of two stars in the polar directions. A strong magnetic field generated during the common envelope stage (Regös & Tout 1995; Tout & Regös 2003) or a merger of the binary components (Langer 2012; Wickramasinghe, Tout & Ferrario 2014) could affect the geometry of the resulting circumstellar nebulae as well (cf. Chevalier & Luo 1994; Różyczka & Franco 1996; Garcia-Segura et al. 1999; Nordhaus & Blackman 2006).
Another potentially important mechanism for the origin of circumstellar nebulae around single (or apparently single) massive stars is connected to the bi-stability jump (Pauldrach & Puls 1990; Lamers & Pauldrach 1991) — an abrupt (a factor of 10) increase in the wind mass-loss rate (Vink 2018), , when the stellar effective temperature, , decreases below the critical value of kK (Lamers, Snow & Lindholm 1995), which corresponds to a spectral type of around B1. The increase in is accompanied (Lamers et al. 1995) by a factor of 2 decrease in the terminal wind velocity, , leading to a factor of increase in the density of the stellar wind. In fast-rotating stars the bi-stability jump may occur preferentially at low stellar latitudes because of the effect of gravity darkening, which could result in an equatorial outflow (Lamers & Pauldrach 1991; Lamers et al. 1995).
Lamers et al. (2001) analysed the chemical composition of nebulae around several LBVs and came to the conclusion that they were ejected soon after their central stars left the main sequence and that the observed chemical enhancements are due to rotationally induced mixing during the main sequence stage. Subsequent studies of blue supergiants with LBV-like circumstellar nebulae (Smartt et al. 2002; Hendry et al. 2008; Smith et al. 2013; Gvaramadze et al. 2014, 2015, 2018; Mahy et al. 2016) lent further support to the idea that massive stars can form circumstellar nebulae during early phases of their evolution. Two more such stars are presented in this paper.
In Section 2, we show multi-wavelength images of two nebulae discovered with WISE and review the existing information on their central stars. Section 3 describes our optical spectroscopic observations (preliminary results of these observations were reported in Gvaramadze & Kniazev 2017). The spectral analysis of the stars is given in Section 4. In Section 5, we present and discuss spectra of an optical counterpart to one of the mid-IR nebulae. Our results are discussed in Section 6 and summarized in Section 7.
2 Two WISE nebulae and their central stars
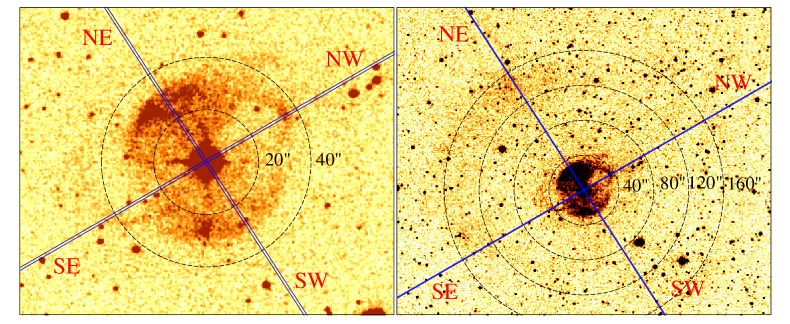
In a search for rare types of massive stars through the detection of their circumstellar nebulae with WISE, we discovered several dozens of nebulae in the regions not covered by Spitzer. Two of them, named WS3 and WS29 (where WS stands for “WISE shell”; cf. Gvaramadze et al. 2012), are presented below. These nebulae positionally coincide with the Infrared Astronomical Satellite (IRAS) sources, respectively, IRAS 00033+6035 and IRAS 18454+0250. The latter source is indicated in the SIMBAD data base111http://simbad.harvard.edu/simbad/ as a planetary nebula. For both nebulae we found optical counterparts in the Isaac Newton Telescope (INT) Photometric H Survey of the Northern Galactic Plane (IPHAS; Drew et al. 2005), which are indicated as circumstellar matter in the Hong Kong/AAO/Strasbourg H (HASH) planetary nebula database (Parker, Bojičić & Frew 2016; see also Kronberger et al. 2016), and named there as PNG 117.401.5 (or Pa 58) and PNG 035.1+02.0, respectively. WS29 is also discernable in the Digitized Sky Survey II (DSS-II; McLean et al. 2000) red band image and is a known source of radio emission (Condon, Kaplan & Terzian 1999). Figs 1 and 2 present WISE 22 and 12 µm, Two Micron All Sky Survey (2MASS; Skrutskie et al. 2006) -band and IPHAS H images of the regions containing WS3 and WS29. Fig. 2 also gives the DSS-II and 1.4 GHz National Radio Astronomy Observatory (NRAO) Very Large Array (VLA) Sky Survey (NVSS; Condon et al. 1998) images of WS29.
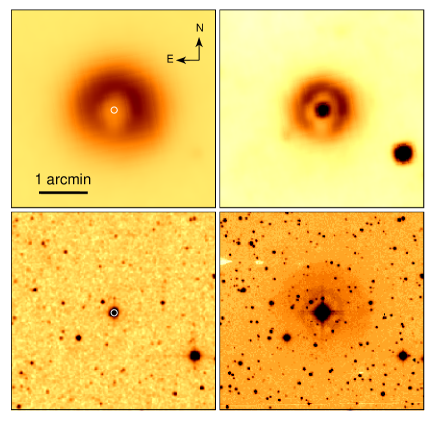
Fig. 1 shows that WS3 is visible in both WISE images: at 22 µm it appears as a thick, diffuse, almost circular shell with a radius of 1 arcmin, while at 12 µm it appears as a slightly elongated shell with a smaller radius of 35 arcsec and a point-like source in the centre. In both images, the brightness of the shell is reduced to the south. In the IPHAS H image WS3 appears as a slightly elongated shell (of similar angular size as the 12 µm shell) immersed in a diffuse halo of the same extent as the emission at 22 µm. The brightness of the halo also decreases to the south, while the inner shell appears to be more extended in this direction. The observed brightness asymmetry might be caused by a density gradient in the local interstellar medium or by motion of the local medium or the nebula itself.
Using the SIMBAD data base, we identified the central source of WS3 with the optical star BD+602668, known as a double or multiple system (Douglass et al. 1999). A literature search revealed that BD+602668 was recognized as an OB star by Nassau & Morgan (1951) and classified as B2 by Brodskaya (1953), as B1 III by Morgan, Code & Whitford (1955), and more recently as B1 by Radoslavova (1989). According to Douglass et al. (1999), BD+602668 is composed of two stars, hereafter BD+602668A and BD+602668B, separated from each other by 3 arcsec, and lying on a line with a position angle (PA) of 159 (measured from north to east). The second data release of Gaia (DR2; Gaia Collaboration 2018) provides for BD+60 2668A and BD+60 2668B accurate parallaxes of mas and mas, placing these stars at kpc and kpc, respectively. In what follows, we adopt a distance of 3.6 kpc to both stars as well as to WS3 (cf. Section 6.1). At this distance, 1 arcmin corresponds to pc. Some of the properties of BD+602668A and BD+602668B are summarized in Table 1.
| BD+60 2668A | BD+60 2668B | ALS 19653 | |
| (WS3) | (WS3) | (WS29) | |
| SpT | B0.5 II | B1.5 III | B0.5 Ib |
| (J2000) | |||
| (J2000) | |||
| 1174303 | 1174304 | 351279 | |
| 15185 | 15193 | 20859 | |
| (mag) | |||
| (mag) |
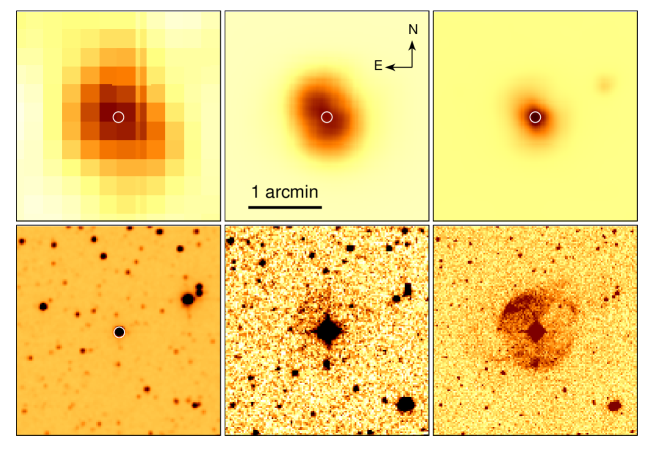
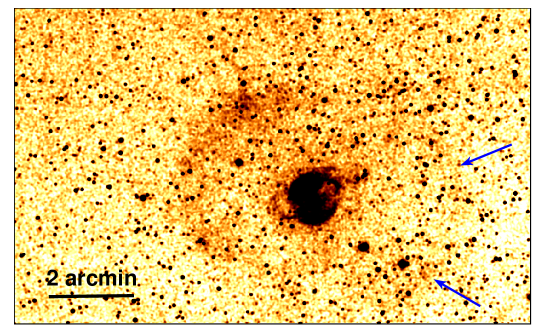
The IR morphology of WS29 differs completely from that of WS3 (see Fig. 2). At 22 µm WS29 has a dumbbell-like shape with the long axis oriented in the northeast-southwest direction (PA30). At 12 µm the nebula appears as a centrally-brightened source, slightly elongated in the same direction as the 22 µm nebula. In the H image WS29 appears as an almost circular shell of angular diameter of about 1 arcmin with enhanced brightness on the northeast and southwest sides, i.e. in the places where the IR nebula is in apparent contact with the optical shell. This image also shows several filaments extending in the northwest and southeast directions beyond the main shell, suggesting that there are protrusions in the shell along the line perpendicular to the IR nebula (PA). The IPHAS H image also shows that WS29 is surrounded by a more extended shell of angular radius of about 2.7 arcmin. This shell is more prominent to the east and northeast, but can also be discerned to the west and southwest of WS29 (see Fig. 3 and Sections 5 and 6.2).
Using the SIMBAD data base, we found that the central star of WS29, known as ALS 19653 (or PDS 543), was classified as a B1 star by Vieira et al. (2003). Condon et al. (1999) detected an elongated radio source at the position of WS29 in the 1.4 GHz NVSS image (see Fig. 2) with the major and minor axes of 77 and 47 arcsec, respectively. The PA of the major axis of is similar to that of the WISE 22 µm nebula. Moreover, polarimetric observations of ALS 19653 by Rodrigues et al. (2009) revealed an intrinsic polarization of the star of per cent with a polarization angle of 121. This implies the presence of a non-spherical structure around the star with the major axis at PA30 (i.e. parallel to the major axis of the 22 µm nebula). The Gaia DR2 parallax of ALS 19653 of mas (Gaia Collaboration 2018) places this star at kpc. At a distance of 1.57 kpc, 1 arcmin corresponds to pc. Some of the properties of ALS 19653 are summarized in Table 1. Note that ALS 19653 is much more reddened compared to BD+60 2668A&B ( mag versus mag) despite a factor of two shorter distance to the former star.
3 Spectroscopic observations
3.1 BD+60 2668A&B
Spectra of BD+60 2668A&B were obtained with the TWIN spectrograph attached to the Cassegrain focus of the 3.5-m telescope in the Observatory of Calar Alto (Spain) on 2012 July 12. Three exposures of 60 s were taken. The set-up used for TWIN consisted of the grating T08 in the first order for the blue arm (spectral range of 3500–5600 Å) and T04 in the first order for the red arm (spectral range of 5300–7600 Å), which provides a reciprocal dispersion of 72 Å for both arms. The resulting full width at half-maximum (FWHM) spectral resolution measured on strong lines of the night sky and reference spectra was 3.1–3.7 Å. The slit of arcsec2 was oriented at a PA selected in a way to observe both stars simultaneously. The seeing during the observations was not stable, arcsec. Spectra of He–Ar comparison arcs were obtained to calibrate the wavelength scale and spectrophotometric standard star BD+ 2642 (Bohlin 1996) was observed at the beginning of the night for the flux calibration.
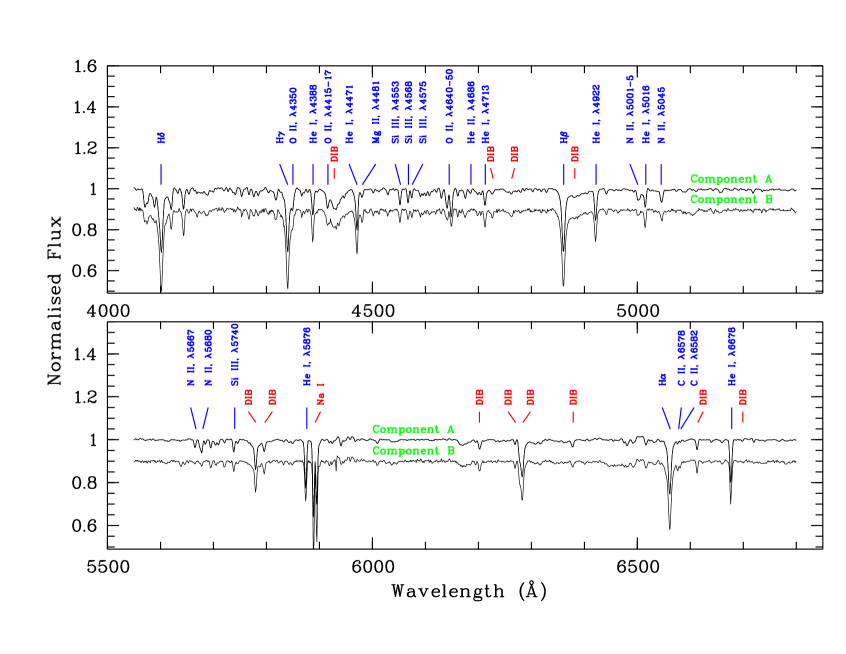
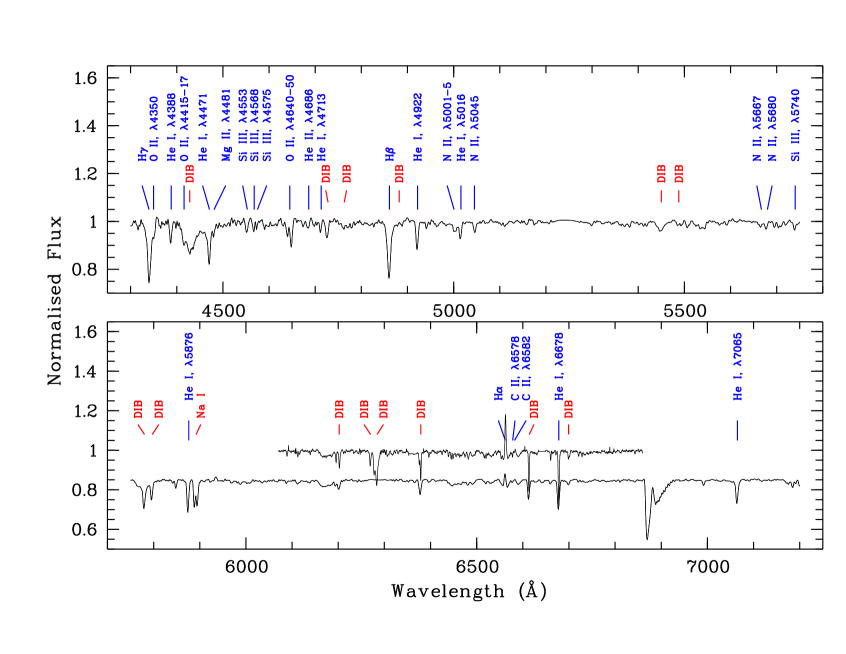
The primary data reduction was done using the iraf package. The data for each CCD detector were trimmed, bias subtracted, and flat corrected. The subsequent long-slit data reduction was carried out in the way described in Kniazev et al. (2008). The two-dimensional (2D) spectra were averaged and one-dimensional (1D) spectra for both components were then extracted using the iraf apall task. The resulting normalized 1D spectra are shown in Fig. 4.
Unfortunately, the optical counterpart to WS3 was discovered after the spectra of the central stars were obtained. The short total exposure used for spectroscopy of these bright stars did not allow us to detect signatures of the nebular emission in the 2D spectrum.
3.2 ALS 19653
| Instrument | Date | Exposure | Spectral scale | Slit | PA | Seeing | Spectral Range |
|---|---|---|---|---|---|---|---|
| (sec) | (Å pixel-1) | (arcsec) | () | (arcsec) | (Å) | ||
| RSS | 2016 April 25 | 240 | 0.97 | 1.25 | 0 | 1.6 | 42007300 |
| HRS | 2016 May 27 | 1500 | 0.04 | – | – | 3.0 | 37008900 |
| RSS | 2016 May 28 | 1200 | 0.26 | 2.00 | 33 | 2.1 | 60356870 |
| RSS | 2016 June 17 | 1800 | 0.26 | 2.00 | 120 | 2.1 | 60356870 |
| HRS | 2017 October 5 | 1500 | 0.04 | – | – | 3.0 | 37008900 |
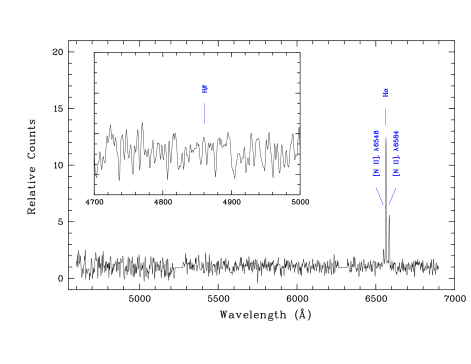
Spectra of ALS 19653 and the optical shells around it were taken with the Robert Stobie Spectrograph (RSS; Burgh et al. 2003; Kobulnicky et al. 2003) mounted on the Southern African Large Telescope (SALT; Buckley, Swart & Meiring 2006; O’Donoghue et al. 2006). Observations were carried out in the long-slit mode on three occasions during 2016 (logged in Table 2). The PG900 grating was used for the first observation (PA=0) to cover the spectral range of 42007300 Å with a final reciprocal dispersion of Å pixel-1. The spectral resolution FWHM was 0.18 Å. We call this spectrum low-resolution hereafter. An Xe lamp arc spectrum was taken immediately after the science frame. Spectrophotometric standard stars were observed during twilight time for the relative flux calibration. To study the radial velocity and H intensity distributions in WS29 and its surroundings, we obtained two additional spectra of higher resolution with the PG2300 grating and two different orientations of the slit. The slit was placed on ALS 19653 and oriented in such a way to cross the brightest sides of the shell (PA=33) and the protrusions in the shell (PA=120). The obtained spectra cover the spectral range of 60356870 Å with a final reciprocal dispersion of Å pixel-1 and the spectral resolution FWHM of 0.11 Å. We call these spectra high-resolution hereafter. A Ne lamp arc spectrum was taken immediately after science frames. The spatial scale of all three RSS spectra was 0.51 arcsec pixel-1.
Primary reduction of the RSS data was done in the standard way with the SALT science pipeline (Crawford et al. 2010). The subsequent long-slit data reduction was carried out in the way described in Kniazev et al. (2008). The resulting reduced RSS spectrum of ALS 19653 is shown in Fig. 5, while those of WS29 are presented and discussed in Section 5.
To study ALS 19653 in more detail and to search for possible radial velocity variations, we observed this star with the SALT High Resolution Spectrograph (HRS; Barnes et al. 2008; Bramall et al. 2010, 2012; Crause et al. 2014) on two occasions, 2016 May 27 and 2017 October 5, with single exposures of 1500 s and a seeing of about 3 arcsec (see Table 2). The HRS is a dual-beam, fibre-fed échelle spectrograph. It was used in the medium resolution mode (R=40 000–43 000 and 2.23 arcsec diameter for both the object and sky fibres) to obtain a spectrum in the blue and red arms over the total spectral range of 3700–8900 Å. Both the blue and red arm CCDs were read out by a single amplifier with a 11 binning. Three arc spectra of the ThAr lamp and three spectral flats were obtained for each observation in this mode during a weekly set of HRS calibrations.
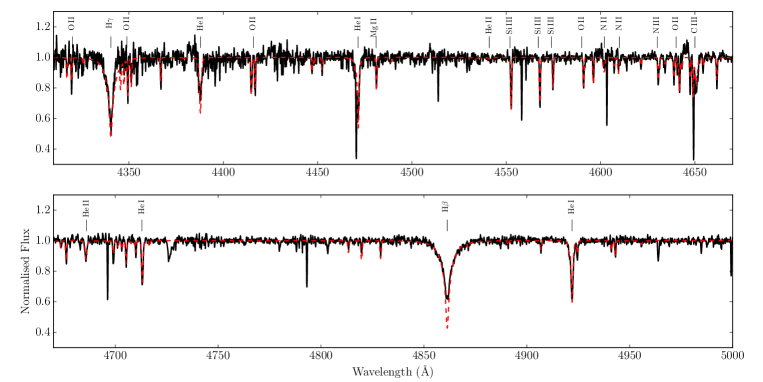
Primary reduction of the HRS spectra was performed with the SALT science pipeline (Crawford et al. 2010). The subsequent reduction steps, including background subtraction, order extraction, removal of the blaze function, identification of the arc lines and merging of the orders for the object spectra, were carried out using the midas HRS pipeline described in detail in Kniazev, Gvaramadze & Berdnikov (2016). Parts of the 2016’s HRS spectrum are shown in Fig. 7.
4 Spectral analysis and stellar parameters
4.1 Classification of BD+60 2668A&B and ALS 19653
The spectra of BD+60 2668A&B and ALS 19653 are dominated by the H i and He i absorption lines (see Figs 4 and 5). Two of these stars (BD+60 2668A and ALS 19653) show the He ii 4686 line, implying that they are B stars of spectral types earlier than B0.7 (Walborn & Fitzpatrick 1990). The HRS spectrum of ALS 19653 also shows the presence of weak He ii 4541 line. The only emission line detected is that of H in the spectrum of ALS 19653. We attribute the origin of this emission to the circumstellar material around the star (see next subsection). Note the presence of a prominent diffuse interstellar band (DIB) at 6379 Å in the spectra of BD+60 2668A&B, creating the illusion of asymmetry in the H line profile (cf. Figs 6 and 7).
Using the classification criteria from Evans et al. (2004), we classify BD+60° 2668A and ALS 19653 as B 0.5222Although the He ii 4541 line was detected in the HRS spectrum of ALS 19653, we do not take it into account because the classification criteria in Evans et al. (2004) are based on much lower resolution spectra., and BD+60° 2668B as B 1.5. The measured equivalent widths (EWs) of the H line in the spectra of BD+60 2668A, BD+60 2668B and ALS 19653 of , and Å, respectively, and the EW(H)-absolute magnitude calibration by Balona & Crampton (1974) suggest for these stars the luminosity classes of Ib, III and Ia. The luminosity classes derived for BD+60 2668A and ALS 19653, however, are inconsistent with the absolute visual magnitudes of these stars of mag and mag (see Section 6), which rather imply the luminosity classes of II and Ib, respectively (e.g. Humphreys & McElroy 1984). We therefore regard BD+60 2668A and ALS 19653 as B0.5 II and B0.5 Ib stars.
4.2 Spectral modelling
Stellar atmosphere analysis of the three stars is rooted on a large grid of synthetic stellar atmosphere models built using the atmosphere/line formation code fastwind (Santolaya-Rey, Puls & Herrero 1997; Puls et al. 2005; Rivero González et al. 2012). The fastwind stellar code takes into account non-local thermodynamic equilibrium effects in spherical symmetry with an explicit treatment of the stellar wind. The stellar grid was designed to accomplish the analysis of late O- and B-type stars with an effective temperature, , between 34 000 and 12 000 K in 1000 K steps, and a surface gravity, , between 4.4 and 2.0 dex in steps of 0.1 dex. The helium abundance was fixed at the solar value. Explicit atomic models for H i, He i,ii, N ii,iii, O ii,iii, C ii,iii, Si ii,iii,iv and Mg ii were included in the determination of the fundamental stellar parameters and chemical abundances. The rest of the chemical species were treated in an implicit way to account for blanketing/blocking effects. For further details see Puls et al. (2005).
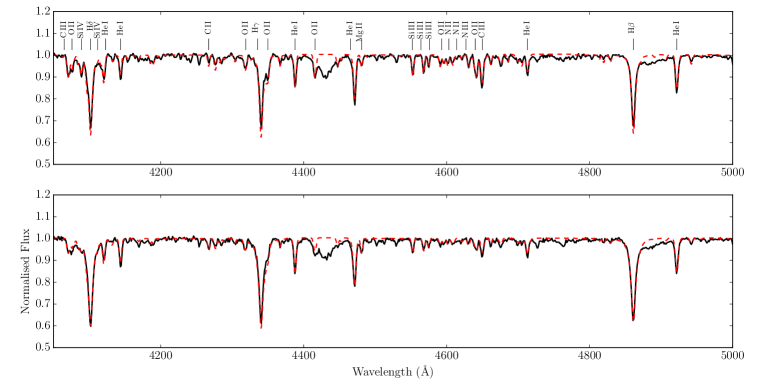
First, several key lines in the spectra333For spectral modelling of ALS 19653, we used the HRS spectrum obtained on 2016 May 25. were simultaneously compared with the grid looking for the set of stellar parameters that best reproduce the spectrum, following the routines and the line list described in Castro et al. (2012; see also Lefever et al. 2010). Subsequently, and based on the best predicted effective temperatures and gravities, new synthetic sub-grids were built for each star with chemical abundances varied around the cosmic abundance standard (CAS) in the solar neighbourhood (Nieva & Przybilla 2012) in steps of 0.2 dex, and microturbulence velocities, , spanning from 1 to 15 km s-1 in steps of 1 km s-1. The best combination of abundances and microturbulence that reproduce the observations were found through an optimized genetic algorithm. The main chemical transitions modelled in this study are labelled in Figs 6 and 7 (see also table 4 in Castro et al. 2012). The derived stellar parameters and chemical abundances are listed in Tables 3 and 4.
| BD+60 2668A | BD+60 2668B | ALS 19653 | |
| (kK) | |||
| km s-1 | |||
| (km s-1 | 130 | 150 | 28 |
| (km s-1) | see Table 5 |
| BD+60 2668A | BD+60 2668B | ALS 19653 | CAS | Brott et al. (2011) | |
|---|---|---|---|---|---|
| (C/H)+12 | 7.7 | 7.5 | 7.9 | 8.13 | |
| (N/H)+12 | 8.3 | 7.9 | 7.9 | 7.64 | |
| (O/H)+12 | 8.7 | 8.8 | 8.5 | 8.55 | |
| (Mg/H)+12 | 7.6 | 7.7 | 7.5 | 7.32 | |
| (Si/H)+12 | 7.6 | 7.5 | 7.5 | 7.41 |
The high resolution of the HRS spectrum of ALS 19653 allowed us to determine the projected rotational velocity, , through the Fourier transform of the Si iii 4552 line profile using the iacob-broad code (Simón-Diaz & Herrero 2007, 2014). The much lower spectral resolution of the TWIN spectra prevents us from applying the same technique for BD+60 2668A&B. For these stars, after a first guess of the best stellar parameters, we convolved the synthetic spectra until we reproduced the FWHM of the metallic lines. This procedure was repeated, updating , until it converged and we reached the best combination of stellar parameters and that fits the observations. The obtained values of are given in Table 3. We note that the actual values of derived for BD+60 2668A&B could be smaller because the measured velocities are around the limit imposed by the low spectral resolution.
We also estimated the heliocentric radial velocities, , of all three stars using the ulyss (University of Lyon Spectroscopic analysis Software) program (Koleva et al. 2009) with a medium spectral-resolution library (Prugniel, Vauglin & Koleva 2011). For BD+60 2668A&B we derived almost equal velocities (see Table 3). For ALS 19653 we used all five RSS and HRS spectra and found significant radial velocity variations ( km s-1; see Table 5). These changes suggest that ALS 19653 is a close binary system, which was in the periastron passage between 2016 April 25 and May 27.
| Date | km s-1 | Spectrograph |
|---|---|---|
| 2016 April 25 | RSS GR900 | |
| 2016 May 27 | HRS | |
| 2016 May 28 | RSS GR2300 | |
| 2016 June 17 | RSS GR2300 | |
| 2017 October 5 | HRS |
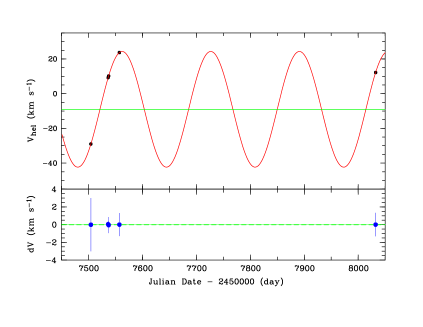
To get an idea on possible parameters of the binary system, we assume that its orbit is circular and fit the data points to a sine curve using the algorithm. The best-fitting result () is shown in Fig. 8 and implies an orbital period of d, an amplitude of km s-1 and a systemic velocity of km s-1. We realize that this solution is not unique because of the limited number of data points. Time-series spectroscopy and photometry of ALS 19653 are required to determine the actual parameters of the system.
Still, using the above parameters of the binary and the mass of ALS 19653 of (see Section 6.2), one can estimate the mass of the companion star to be . Assuming that this star is on the main sequence, one finds that its -band brightness should be a factor of lower than that of ALS 19653. This is consistent with the non-detection of double-lined structures in the HRS spectra of ALS 19653, although both spectra were obtained at the time favourable for their detection, i.e. when the difference of radial velocities of the binary components was close to maximum (cf. Fig. 8 and Table 5).
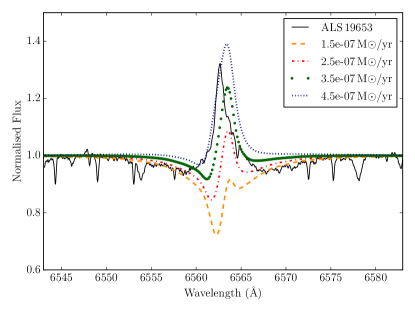
The presence of the H emission line in the spectrum of ALS 19653 (see Fig. 5) could indicate that this star possesses a strong wind. In Fig. 9, we compare the observed H line profile (from the HRS spectrum obtained on 2016 May 27) with synthetic ones obtained in fastwind models with four different mass-loss rates. In these models, we adopted a wind velocity law exponent =2 and a terminal wind velocity of 1500 km s-1, based on the effective temperature of ALS 19653 and the empirical calibration in Kudritzki & Puls (2000). The intensity of the observed line matches a mass-loss rate of . However, the synthetic lines have a P Cygni type profile (typical of lines formed in powerful winds or expanding gaseous shells), while in the observed line the intensity peak is shifted to the violet side with respect to the peaks of the model lines and the line itself has an asymmetric shape with an absorption dip on the red side (see also Fig. 10). This suggests that the H emission is rather formed in the circumstellar material around the star.
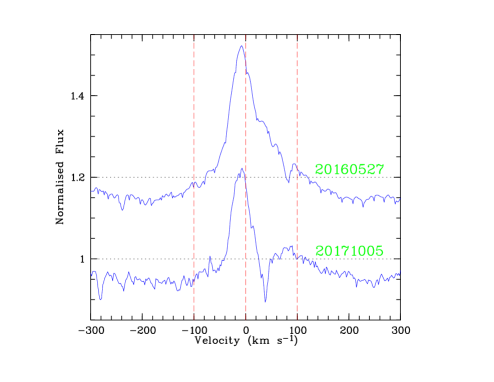
The circumstellar origin of the H line is also suggested by changes in the profile of this line. Fig. 10 shows that in 2016 the H line was dominated by a sharp asymmetric emission and shows also the presence of a second, much weaker emission component at km s-1, separated from the first one by a shallow absorption dip at km s-1. In 2017 the two-peak shape of the H line became more obvious after the absorption dip has extended below the continuum and shifted bluewards to km s-1. This change in the absorption was accompanied by per cent decrease of the intensity of the main emission component and a blueward shift of the second emission peak. Similar behaviour of the H emission line was detected in late B and early A supergiants (e.g. Kaufer et al. 1996; Verdugo, Talavera & Gómez de Castro 2000; Markova & Valchev 2000), where the shape of this line changes from blue- or red-shifted asymmetric emission to double-peaked or inverse P Cygni profile (see, e.g., fig. 1 in Markova & Valchev 2000 for a good example of these changes). This behaviour of the line profile was interpreted in terms of deviation of stellar wind from spherical symmetry or presence of a flattened (disc-like) circumstellar structure (e.g. Kaufer et al. 1996; Petrenz & Puls 1996; Fullerton et al. 1997). The presence of elongated (IR) nebula around ALS 19653 and the detection of intrinsic polarization of this star (with the polarization angle aligned with the elongated nebula) makes it natural to assume that the H line originates in a flattened circumstellar structure (viewed nearly edge-on) and that its variability is caused by a large-scale density asymmetry in this structure (cf. Section 6.2).
5 Spectroscopy of WS29
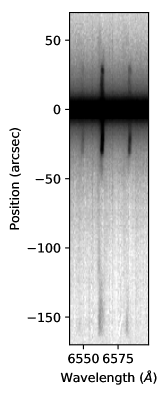
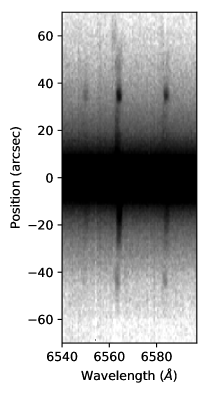
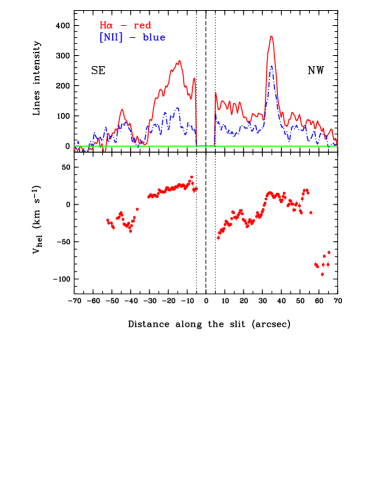
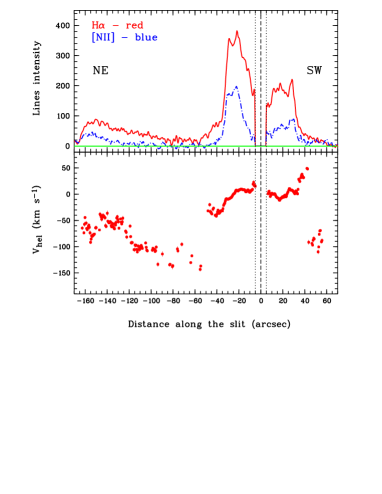
As noted in Section 3, we obtained two high-resolution RSS spectra of WS29 with the slit placed on ALS 19653 and oriented at PA=33 and 120. The 8 arcmin long slit allowed us also to obtain spectra of the second, more extended shell around ALS 19653 (see Fig. 3). The only lines detected in the spectra of WS29 and the second shell are those of H and [N ii] 6548, 6584. Portions of the 2D spectra showing these lines are presented in Fig. 11. The left-hand panel shows that the second shell extends in the north-east direction for arcsec from the star and that the emission lines from the shell are split in two components, indicating expansion of the shell. The splitting of the emission lines is also visible in the right-hand panel (at about 60 arcsec southwest of the star), indicating the presence of material with different radial velocities (cf. Fig. 12).
Using the 2D spectra, we plot the distributions of the H and [N ii] 6584 emission line intensities and the H heliocentric radial velocity, , along the slits (see the upper panels in Fig. 12, where the left- and right-hand panels correspond, respectively, to the slit orientation of PA=120 and 33). The plots show that the intensities of both lines correlate with bright details in WS29 and the second shell. In particular, the plots also show that WS29 is more extended in the southeast-northwest direction (PA=120) than in the orthogonal direction.
The position-velocity diagram obtained for the slit with PA=33 shows that the nearby side of the second shell approaches us with a velocity of km s-1. The velocity field in WS29 is more complex and shows different behaviour along the two slits. The velocity distribution along the slit with PA=33 (i.e. along the long axis of the IR nebula) shows that the northeast rim of the optical shell is approaching us with a velocity of about km s-1, while the rim of the opposite side of the shell is receding from us with about the same velocity. This suggests that the outer parts of WS29 might be rotating around an axis aligned with the slit at PA=120 (we discuss this possibility in Section 6.2). The velocity distribution along the slit with PA=120 indicates that we see an expanding bilobal structure, whose existence also follows from the presence of filaments protruding in the southeast and northwest directions beyond the main (almost circular) optical shell (the origin of these protrusions is discussed in Section 6.2 as well).
Fig. 13 shows the 1D low-resolution RSS spectrum of WS29 obtained by summing up, without any weighting, all rows from the area of an annulus with an outer radius of 40 arcsec centred on ALS 19653 and the central arcsec excluded. The emission lines (H, H and [N ii] 6548, 6584) detected in the resulting spectrum were measured using the programs described in Kniazev et al. (2004). Table 6 lists the observed intensities of these lines normalized to H, (H), the reddening-corrected line intensity ratios, (H), and the logarithmic extinction coefficient, (H), which corresponds to mag. This value of agrees within the error margins with the colour excess of ALS 19653 of mag based on the and magnitudes of this star (see Table 1) and the intrinsic colour of a B0.5 Ib star of mag (Fitzgerald 1970).
| (Å) Ion | F()/F(H) | I()/I(H) |
|---|---|---|
| 4861 H | ||
| 6548 [N ii] | ||
| 6563 H | ||
| 6584 [N ii] | ||
| (H) | ||
| mag | ||
6 Discussion
6.1 WS3 and BD+60 2668A&B
The similar distances to and radial velocities of BD+60 2668A&B, and the small angular (or projected linear) separation between these stars of arcsec (or pc) strongly suggest that they are members of the same stellar system. We note that both stars are located within the boundaries of the Cas OB5 association (Humphreys 1978) and that the Gaia DR2 parallaxes of a large part of stars listed in Humphreys (1978; see there table 8) as the association members are similar to those of BD+60 2668A&B. This implies that BD+60 2668A&B reside in Cas OB5 and justifies why we adopt the same distance to both stars (see Section 2).
Using the adopted distance of 3.6 kpc, the and photometry from Table 1, from Table 3, colours and bolometric corrections from Fitzgerald (1970), and assuming that the total-to-selective absorption ratio equals to 3.1, we calculate absolute visual and bolometric magnitudes: mag and mag for BD+60 2668A and mag and mag for BD+60 2668B. The derived values of translate into the bolometric luminosities of BD+60 2668A&B of and 4.6, which along with the effective temperatures of these stars imply that both of them are still on the main sequence or only recently left it, and that their initial (zero-age main-sequence) masses were, respectively, and (e.g. Brott et al. 2011).
The inference that both BD+60 2668A&B are relatively unevolved is supported by the surface elemental abundances measured for these stars. The comparison of the CNO abundances of BD+60 2668A given in Table 4 with those predicted for rotating main-sequence stars by the stellar evolutionary models of Brott et al. (2011) shows that they agree with each other well enough if the initial rotational velocity of BD+60 2668A was km s-1, meaning that the enhanced nitrogen abundance of this star could be caused by rotational mixing. The only difference is that the Brott et al.’s models predict a 0.2 dex lower O abundance, which could be due to the lower initial abundance for this element (as compared to the CAS) adopted in these models (cf. Table 4). The Brott et al.’s models also suggest that the age of BD+60 2668A is Myr. Similarly, we found that the CNO abundances of BD+60 2668B would reasonably agree with the model predictions if the initial rotational velocity of this star was km s-1. The models also suggest that the age of BD+60 2668B is Myr, i.e. a factor of higher than that of BD+60 2668A.
The age estimates for BD+60 2668A&B are in seeming contradiction with the possibility that the two stars are members of the same stellar system. The age discrepancy, however, could be understood if BD+60 2668A is a blue straggler, i.e. a rejuvenated product of binary mass transfer or merger, implying that this star is or was a binary system. This possibility appears reasonable because the majority of massive stars are formed in binary and multiple systems and because their evolution is dominated by various binary interaction processes (Sana et al. 2012). Moreover, the binary population synthesis modelling shows (de Mink et al. 2014) that about 30 per cent of massive stars undergo binary interaction (i.e. mass transfer, common envelope evolution and/or merger) during the main sequence stage. A factor of several enhancement of the nitrogen abundance on the surface of BD+60 2668A could be the result of binary interaction as well (cf. Langer 2012).
Figure 1 shows that the circumstellar nebula around BD+60 2668A&B is composed of two distinct components: a diffuse halo and an inner shell. Similar two-component nebulae were also detected around two candidate LBVs, GAL 079.29+00.46 (Gvaramadze et al. 2010b; see their fig. 2j) and [GKF2010] MN112 (Gvaramadze et al. 2010a; see their fig. 1). The morphology of these nebulae might be interpreted as indicating that their central stars experienced a brief episode of enhanced mass loss, leading to the formation of a compact region of dense material (visible in H as a density-bounded H ii region — the halo), and that afterwards the stellar wind increases its speed and sweeps up the material of the preceding slower wind, and thereby creates a shell within the halo.
In the life of a single massive star such changes in the mass-loss rate and wind velocity can occur if after the red supergiant stage the star becomes a Wolf-Rayet star or undergoes a blue loop evolution. The CNO abundances derived for BD+60 2668A&B, however, suggest that these stars have not yet gone through the red supergiant stage. Besides this, the episode of enhanced mass loss and subsequent increase of the wind velocity could be caused by the bi-stability jump (Pauldrach & Puls 1990; Lamers & Pauldrach 1991) if in the course of stellar evolution the effective temperature falls below some critical value ( kK) and then again raises above it. According to the stellar evolutionary models by Brott et al. (2011), for stars this situation takes place during the transition from core-H to core-He burning. The duration of this transition of yr, however, is too long and the wind velocity is too high ( km s-1) to result in the origin of a compact (parsec-size) circumstellar nebula.
On the other hand, as discussed above, BD+60 2668A might be the result of merger of two stars, which causes a temporal inflation of the resulting single star and a decrease of its below the temperature of the bi-stability jump. As a result of this, the stellar wind velocity drops by a factor of 2, while the mass-loss rate increases by a factor of 10 (Vink 2018), leading to a factor of 20 increase of the stellar wind density and formation of a halo around the star. Later on, after the thermal adjustment of the merger product on its Kelvin-Helmholtz time-scale ( yr), the effective temperature of the star increases above the temperature of the bi-stability jump and the stellar wind velocity increases to its initial value, which in turn leads to the formation of a shell within the halo. Since the (relaxed) merger product is expected to be a fast-rotating star, the temperature distribution across its surface could be inhomogeneous due to gravity darkening. Correspondingly, the wind velocity along the stellar rotational axis might be higher than in the equatorial region, which could be responsible for the observed elongated shape of the shell (see Fig. 1). We speculate also that the post-merger relaxation of the newly formed single star might be accompanied by photometric and spectroscopic variability typical of LBVs and that in the recent past BD+60 2668A probably looked like an LBV.
The possibility that the LBV activity (including giant, Car-like, eruptions) is triggered by the interaction between companion stars in binary or triple systems (e.g. through the merger of two stars, tidal interaction, or interchange of components) has been widely discussed in the last two decades (e.g. Justham, Podsiadlowski & Vink 2014; Portegies Zwart & van den Heuvel 2016, and references therein). Since this interaction can take place at both early and late stages of evolution of binary/triple systems, it is natural to expect that the LBV phenomenon (accompanied by the formation of circumstellar nebulae) can be found among massive stars at both early and advanced evolutionary stages. It should also be noted that the detection of possible companion stars in wide orbits around several (candidate) LBVs (e.g. Martayan et al. 2016) does not contradict the possibility that the LBV activity of these stars is caused by binary-interaction processes. In such cases, the (candidate) LBV stars might be unresolved binaries or merger products of two stars, while the nearby stars might represent the tertiary stars dynamically scattered in wide orbits (cf. Reipurth & Mikkola 2012) or former (unbound) members of dissolved triple systems (cf. Gvaramadze & Menten 2012). BD+60 2668B might be such a tertiary star.
In summary, the spectral analysis of BD+60 2668A&B indicates that both stars are either still on the main sequence or only recently left it, and that the surface nitrogen abundance of BD+60 2668A is enhanced by a factor of several. Also, it appears that BD+60 2668A is a factor of two younger than BD+60 2668B despite the strong indications that both stars are members of the same stellar system and, therefore, most likely were formed simultaneously. The age discrepancy could be naturally understood if BD+60 2668A is a rejuvenated product of binary interaction, in which case the enhanced nitrogen abundance on the surface of the star is a direct consequence of this interaction. The binary interaction scenario also provides a framework for understanding the origin of the circumstellar nebula, which hardly can be produced by a single unevolved star.
6.2 WS29 and ALS 19653
For ALS 19653 we derive mag and , which along with the effective temperature imply an initial mass and age of ALS 19653 of, respectively, and Myr, meaning that this star is either still on the main sequence or just left it (e.g. Brott et al. 2011).
The chemical abundances derived for ALS 19653 (see Table 4) support the inference that this star is relatively unevolved, and agree with the Brott et al.’s models if the initial rotational velocity of this star was km s-1. Note that the uncertainties in the measurements allow the possibility that the surface nitrogen abundance is enhanced by factors of 2 or 3 in comparison with the CAS or the initial N abundance adopted in Brott et al. (2011), respectively. This enhancement, if real, could be caused not only by rotationally-induced mixing, but also by binary interaction, e.g., because of accretion of CNO-processed material from the companion star or mixing caused by merger of the binary components (e.g. Langer 2012).
The detection of two nested shells around ALS 19653 indicates that this star has experienced at least two episodes of enhanced mass loss444Similar two-shell structure was also found around the O6.5f?p (Walborn et al. 2010) star HD 148937 (Leitherer & Chavarria-K. 1987). It is believed that the strong magnetic field of this star, its rapid rotation and the origin of the nitrogen-rich circumstellar nebula are the result of merger of two stars (Langer 2012).. At the adopted distance to ALS 19653, the characteristic radius of the second (outer) shell is 1.2 pc, which along with the expansion velocity of this shell of km s-1gives its kinematic age of yr. Similarly, assuming that the optical shell of WS29 is expanding with a velocity of km s-1(cf. Fig. 12) and given its characteristic radius of pc, one finds that this shell was formed shortly after the outer shell. WS29 is especially curious because it consists of an optical circular shell with protrusions in the northwest and southeast directions, and an inner elongated IR nebula, stretched in the direction perpendicular to the axis defined by the protrusions. Below we discuss the possible origin of WS29.
The changes in the H line profile suggest that ALS 19653 is surrounded by a disc-like structure viewed nearly edge-on (see Section 4.2), while the polarization angle of the stellar light of 121°(see Section 2) implies that this structure is oriented in the same direction as the IR nebula. We therefore interpret this nebula as a flattened outflow or ejecta from ALS 19653 viewed nearly edge-on. Since it is unlikely that a single unevolved star can produce a circumstellar nebula it is reasonable to assume that its formation is due to a binary interaction process, e.g., because of merger of two stars or common-envelope evolution. Correspondingly, the spin axis of the merger product or the angular momentum of the post-common-envelope binary orbit should coincide with the line connecting the protrusions in the optical shell of WS29 (PA120°). If ALS 19653 is indeed the result of merger of two stars, then the inclination angle of its rotational axis to our line of sight should be close to 90, while its equatorial rotational velocity should be almost equal to the projected rotational velocity of 28 km s-1. The H line variability in ALS 19653 could be understood if the density structure of the (inner) part of the flattened circumstellar nebula is non-axisymmetric, e.g. because of the tidal force from the companion star (cf. Okazaki et al. 2002; Oktariani & Okazaki 2009). The possible binary nature of ALS 19653 (see Section 4.2) makes this explanation plausible. It should be noted, however, that binarity of ALS 19653 does not exclude the possibility that this star is a merger product because originally it might have been a triple system (cf. Pasquali et al. 2000; Schneider et al. 2016).
The strong differential rotation originating in the course of merger of a binary system or common envelope evolution might be responsible for generation of a strong large-scale magnetic field in the newly formed single star (Langer 2012; Wickramasinghe, Tout & Ferrario 2014; Schneider et al. 2016) or in the ejected envelope (Regós & Tout 1995; Tout & Regös 2003), respectively. This magnetic field can in turn effectively spin down the merger product through dynamical mass-loss (e.g. Langer 2012) and may affect (or even determine) the geometry of the ejected material (Chevalier & Luo 1994; Różyczka & Franco 1996; Garcia-Segura et al. 1999; Nordhaus & Blackman 2006). Correspondingly, the low rotational velocity derived for ALS 19653 might be the direct result of magnetic braking of this star, while the origin of protrusions in the northwest and southeast directions might be caused by deflection of the ejected material towards the polar directions by the tension of the toroidal magnetic field. The gravity-darkening of the initially fast-rotating merger remnant may also contribute to the origin of the polar protrusions.
Finally, we note that the distribution of the H radial velocity along the slit with PA=33 (i.e. along the slit aligned with the IR nebula) suggests that the outer parts of the equatorial ejecta might be rotating around the axis defined by the orientation of the polar protrusions. If real, this rotation would imply very efficient transfer of angular momentum from the merger remnant (possibly rotating at break-up velocity at the equator) or from the shrinking binary system to a tiny fraction of the equatorial ejecta by means of magnetic torque. Follow-up study of the H velocity field in WS29 with the multi-unit spectroscopic explorer (MUSE; Bacon et al. 2010) could potentially clarify this issue.
7 Summary
We discovered two mid-infrared nebulae using data from the WISE survey, and identified their central stars with the early B stars BD+60 2668 and ALS 19653. Our spectroscopic observations of BD+60 2668 (composed of two components, A and B, separated by arcsec) and ALS 19653 confirmed that they are massive stars. We analysed spectra of these stars with the stellar atmosphere code fastwind and found that all three stars are either on the main sequence or just left it. The obtained results provide further support to claims that massive stars can produce circumstellar nebulae during the early stages of evolution. Since the origin of such nebulae hardly can be understood within the framework of single star evolution, and because the majority of massive stars form in binary or multiple systems and many of them undergo binary interaction during the main sequence stage, we suggested that the formation of both nebulae is related to the binary nature of their central stars. We found that the surface nitrogen abundance of BD+60 2668A is enhanced by a factor of several with respect to the solar value and that the apparent age of this star is a factor of 1.5 younger than that of BD+60 2668B. Proceeding from this, we suggested that component A is a rejuvenated product of binary merger and that the mass lose from just this star is responsible for the origin of the nebula around BD+60 2668. We also found that ALS 19653 shows significant radial velocity variations, meaning that it is a close binary system. This and the presence of a disc-like structure around ALS 19653 (as suggested by polarimetric, infrrared and radio observations, and variable profile of the H emission line in the spectrum of this star) suggest that the origin of the associated nebula might also be caused by binary interaction.
References
- Bacon et al. (2010) Bacon R. et al., 2010, Proc. SPIE, 7735, 773508
- Balona & Crampton (1974) Balona L., Crampton D., 1974, MNRAS, 166, 203
- Barnes et al. (2008) Barnes S. I. et al., 2008, in McLean I. S., Casali M. M., eds, Proc. SPIE Conf. Ser. Vol. 7014, Ground-based and Airborne Instrumentation for Astronomy II. SPIE, Bellingham, p. 70140K
- Bohlin (1996) Bohlin R. C., 1996, AJ, 111, 1743
- Bramall et al. (2010) Bramall D. G. et al., 2010, in McLean I. S., Ramsay S. K., Takami H., eds, Proc. SPIE Conf. Ser. Vol. 7735, Ground-based and Airborne Instrumentation for Astronomy III. SPIE, Bellingham, p. 77354F
- Bramall et al. (2012) Bramall D. G. et al., 2012, in McLean I. S., Ramsay S. K., Takami H., eds, Proc. SPIE Conf. Ser. Vol. 8446, Ground-based and Airborne Instrumentation for Astronomy IV. SPIE, Bellingham, p. 84460A
- Brighenti & D’Ercole (1995) Brighenti F., D’Ercole A., 1995, MNRAS, 277, 53
- Brodskaya (1953) Brodskaya E. S., 1953, Izv. Krym. Astrofiz. Obs., 10, 104
- Brott et al. (2011) Brott I. et al., 2011, A&A, 530, A115
- Buckley et al. (2006) Buckley D. A. H., Swart G. P., Meiring J. G., 2006, in Stepp L. M., ed., Proc. SPIEConf. Ser.Vol. 6267, Ground-based and Airborne Telescopes. SPIE, Bellingham, p. 62670Z
- Burgh et al. (2003) Burgh E. B., Nordsieck K. H., Kobulnicky H. A., Williams T. B., O’Donoghue D., Smith M. P., Percival J. W., 2003, in Iye M., Moorwood A. F. M., eds, Proc. SPIE Conf. Ser. Vol. 4841, Instrument Design and Performance for Optical/Infrared Ground-based Telescopes. SPIE, Bellingham, p. 1463
- Castro N. et al. (2012) Castro N. et al., 2012, A&A, 542, A79
- Chevalier & Luo (1994) Chevalier R. A., Luo D., 1994, ApJ, 421, 225
- Chini et al. (2012) Chini R., Hoffmeister V. H., Nasseri A., Stahl O., Zinnecker H., 2012, MNRAS, 424, 1925
- Clark et al. (2005) Clark J. S., Larionov V. M., Arkharov A., 2005, A&A, 435, 239
- Condon et al. (1998) Condon J. J., Cotton W. D., Greisen E. W., Yin Q. F., Perley R. A., Taylor G. B., Broderick J. J., 1998, AJ, 115, 1693
- Condon, Kaplan & Terzian (1999) Condon J. J., Kaplan D. L., Terzian Y., 1999, ApJS, 123, 219
- Conti & Alschuler (1971) Conti P. S., Alschuler W. R., 1971, ApJ, 170, 325
- Corradi & Schwarz (1993) Corradi R. L. M., Schwarz H. E., 1993, A&A, 268, 714
- Crause et al. (2014) Crause L. A. et al., 2014, in Ramsay S. K., McLean I. S., Takami H., eds, Proc. SPIE Conf. Ser. Vol. 9147, Ground-based and Airborne Instrumentation for Astronomy V. SPIE, Bellingham, p. 91476T
- Crawford et al. (2010) Crawford S. M. et al., 2010, in Silva D. R., Peck A. B., Soifer B. T., eds, Proc. SPIE Conf. Ser. Vol. 7737, Observatory Operations: Strategies, Processes, and Systems III. SPIE, Bellingham, p. 773725
- De Marco (1999) De Marco O., 2009, PASP, 121, 316
- de Mink et al. (2014) de Mink S. E., Sana H., Langer N., Izzard R. G., Schneider F. R. N., 2014, ApJ, 782, 7
- Douglass et al. (1999) Douglass G. G., Mason B. D., Germain M. E., Worley C. E., 1999, AJ, 118, 1395
- Drew et al. (2005) Drew J. et al., 2005, MNRAS, 362, 753
- Evans et al. (2004) Evans C. J., Howarth I. D., Irwin M. J., Burnley A. W., Harries T. J., 2004, MNRAS, 353, 601
- Fabian & Hansen (1979) Fabian A. C., Hansen C. J., 1979, MNRAS, 187, 283
- Fitzgerald (1970) Fitzgerald M. P., 1970, A&A, 4, 234
- Flagey et al. (2014) Flagey N., Noriega-Crespo A., Petric A. O., Geballe T. R., 2014, AJ, 148, 34
- Fullerton et al. (1997) Fullerton A. W., Massa D. L., Prinja R. K., Owocki S. P., Cranmer S. R., 1997, A&A, 327, 699
- Gaia Collaboration et al. (2018) Gaia Collaboration, Brown A. G. A., Vallenari A., Prusti T., de Bruijne J. H. J., Babusiaux C., Bailer-Jones C. A. L., 2018, A&A, 616, A1
- Garcia-Segura et al. (1996) Garcia-Segura G., Langer N., Mac Low M.-M., 1996, A&A, 316, 133
- Garcia-Segura et al. (1999) Garcia-Segura G., Langer N., Różyczka M., Franco J., 1999, ApJ, 517, 767
- Gvaramadze & Kniazev (2017) Gvaramadze V. V., Kniazev A. Y., 2017, in Miroshnichenko A.S., Zharikov S.V., Korcakova D., Wolf M., eds., ASP Conf. Ser. Vol. 508, The B[e] Phenomenon. Forty Years of Studies. Astron. Soc. Pac., San Francisco, p. 207
- Gvaramadze & Menten (2012) Gvaramadze V. V., Menten K. M., 2012, A&A, 541, A7
- Gvaramadze et al. (2009) Gvaramadze V. V. et al., 2009, MNRAS, 400, 524
- Gvaramadze et al. (2010a) Gvaramadze V. V., Kniazev A. Y., Fabrika S., Sholukhova O., Berdnikov L. N., Cherepashchuk A. M., Zharova A. V., 2010a, MNRAS, 405, 520
- Gvaramadze, Kniazev & Fabrika (2010b) Gvaramadze V. V., Kniazev A. Y., Fabrika S., 2010b, MNRAS, 405, 1047
- Gvaramadze et al. (2012) Gvaramadze V. V. et al., 2012, MNRAS, 421, 3325
- Gvaramadze et al. (2014) Gvaramadze V. V., Miroshnichenko A. S., Castro N., Langer N., Zharikov S. V., 2014, MNRAS, 437, 2761
- Gvaramadze et al. (2015) Gvaramadze V. V. et al., 2015, MNRAS, 454, 219
- Gvaramadze et al. (2018) Gvaramadze V. V., Kniazev A. Y., Maryeva O. V, Berdnikov L. N., 2018, MNRAS, 474, 1412
- Henden et al. (2016) Henden A. A, Templeton M., Smith T. C., Levine S., Welch D., 2016, VizieR Online Data Catalog, 2336, 0
- Hendry et al. (2008) Hendry M. A., Smartt S. J., Skillman E. D., Evans C. J., Trundle C., Lennon D. J., Crowther P. A., Hunter I., 2008, MNRAS, 388, 1127
- Humphreys (1978) Humphreys R. M., 1978, ApJS, 38, 309
- Humphreys et al. (1984) Humphreys R. M., McElroy D. B., 1984, ApJ, 284, 565
- Humphreys & Davidson (1994) Humphreys R. M., Davidson K., 1994, PASP, 106, 1025
- Justham et al. (2014) Justham S., Podsiadlowski P., Vink J. S., 2014, ApJ, 796, 121
- Kaufer et al. (1996) Kaufer A. et al., 1996, A&A, 305, 887
- Kharchenko (2001) Kharchenko N. V., 2001, Kinematika Fiz. Nebesnykh Tel, 17, 409
- Kniazev & Gvaramadze (2015) Kniazev A. Y., Gvaramadze V. V., 2015, in Proceedings of the SALT Science Conference 2015 (SSC2015). Stellenbosch Institute of Advanced Study, South Africa, id. 49
- Kniazev, Gvaramadze & Berdnikov (2015) Kniazev A. Y., Gvaramadze V. V., Berdnikov L. N., 2015, MNRAS, 449, L60
- Kniazev, Gvaramadze & Berdnikov (2016) Kniazev A. Y., Gvaramadze V. V., Berdnikov L. N., 2016, MNRAS, 459, 3068
- Kniazev et al. (2004) Kniazev A. Y., Pustilnik S. A., Grebel E. K., Lee H., Pramskij A. G., 2004, ApJS, 153, 429
- Kniazev et al. (2008) Kniazev A. Y. et al., 2008, MNRAS, 388, 1667
- Kobulnicky et al. (2003) Kobulnicky H. A., Nordsieck K. H., Burgh E. B., Smith M. P., Percival J. W., Williams T. B., O’Donoghue D., 2003, in Iye M., Moorwood A. F. M., eds, Proc. SPIE Conf. Ser. Vol. 4841, Instrument Design and Performance for Optical/Infrared Ground-based Telescopes. SPIE, Bellingham, p. 1634
- Koleva et al. (2009) Koleva M., Prugniel P., Bouchard A., Wu Y., 2009, A&A 501, 1269
- Kronberger et al. (2016) Kronberger M. et al., 2016, Journal of Physics: Conf. Ser., 728, 072012
- Kudritzki & Puls (2000) Kudritzki R.-P., Puls J., 2000, ARA&A, 38, 613
- Lamers & Pauldrach (1991) Lamers H. J. G. L. M., Pauldrach A. W. A., 1991, A&A, 244, L5
- Lamers, Snow & Lindholm (1995) Lamers H. J. G. L. M., Snow T. P., Lindholm D. M., 1995, ApJ, 455, 269
- Lamers et al. (2001) Lamers H. J. G. L. M., Nota A., Panagia N., Smith L. J., Langer N., 2001, ApJ, 551, 764
- Langer (1998) Langer N., 1998, A&A, 329, 551
- Langer (2012) Langer N., 2012, ARA&A, 50, 107
- Leitherer & Chavarria-K (1987) Leitherer C., Chavarria-K. C., 1987, A&A, 175, 208
- Lefever et al. (2010) Lefever K., Puls J., Morel T., Aerts C., Decin L., Briquet M., 2010, A&A, 515, A74
- Livio, Salzman & Shaviv (1979) Livio M., Salzman J., Shaviv G., 1979, MNRAS, 188, 1
- Mackey et al. (2014) Mackey J., Mohamed S., Gvaramadze V. V., Kotak R., Langer N., Meyer D. M.-A., Moriya T. J., Neilson H. R., 2014, Nature, 512, 282
- Mahy et al. (2016) Mahy L., Hutsemékers D., Royer P., Waelkens C., 2016, A&A, 594, A94
- Markova & Valchev (2000) Markova N., Valchev T., 2000, A&A, 363, 995
- Martayan et al. (2016) Martayan C. et al., 2016, A&A, 587, A115
- Mastrodemos & Morris (1999) Mastrodemos N., Morris M., 1999, ApJ, 523, 357
- McLean et al. (2000) McLean B. J., Greene G. R., Lattanzi M. G., Pirenne B., 2000, in Manset N., Veillet C., Crabtree D., eds, ASP Conf. Ser. Vol. 216, Astronomical Data Analysis Software and Systems IX. Astron. Soc. Pac., San Francisco, p. 145
- Mizuno et al. (2010) Mizuno D. R. et al., 2010, AJ, 139, 1542
- Morgan, Code & Whitford (1955) Morgan W. W., Code A. D., Whitford A. E., 1955, ApJS, 2, 41
- Morris (1981) Morris M., 1981, ApJ, 249, 572
- Morris & Jura (1983) Morris M., Jura M., 1983, ApJ, 267, 179
- Nassau & Morgan (1951) Nassau J. J., Morgan W. W., 1951, ApJ, 113, 141
- Nieva & Przybilla (2012) Nieva M.-F., Przybilla N., 2012, A&A, 539, A143
- Nordhaus & Blackman (2006) Nordhaus J., Blackman E. G., 2006, MNRAS, 370, 2004
- Nota et al. (1995) Nota A., Livio M., Clampin M., Schulte-Ladbeck R., 1995, ApJ, 448, 788
- O’Donoghue D. et al. (2006) O’Donoghue D. et al., 2006, MNRAS, 372, 151
- Okazaki et al. (2002) Okazaki A. T., Bate M. R., Ogilvie G. I., Pringle J. E., 2002, MNRAS, 337, 967
- Oktariani & Okazaki (2009) Oktariani F., Okazaki A. T., 2009, PASJ, 61, 57
- Parker et al. (2016) Parker Q. A., Bojičić I. S., Frew D. J., 2016, JPhCS, 728, 032008
- Pasquali et al. (2000) Pasquali A., Nota A., Langer N., Schulte-Ladbeck R. E., Clampin M., 2000, AJ, 119, 1352
- Pauldrach & Puls (1990) Pauldrach A. W. A., Puls J., 1990, A&A, 237, 409
- Petrenz & Puls (1996) Petrenz P., Puls J., 1996, A&A, 312, 195
- Portegies Zwart & van den Heuvel (2016) Portegies Zwart S. F., van den Heuvel E. P. J., 2016, MNRAS, 456, 3401
- Prugniel, Vauglin & Koleva (2011) Prugniel P., Vauglin I., Koleva M., 2011, A&A, 531, 165
- Puls et al. (2005) Puls J., Urbaneja M. A., Venero R., Repolust T., Springmann U., Jokuthy A., Mokiem M. R., 2005, A&A, 435, 669
- Radoslavova (1989) Radoslavova T., 1989, Bull. Abastumani Astrophys. Obs., 66, 33
- Regös & Tout (1995) Regös E., Tout C. A., 1995, MNRAS, 273, 146
- Reipurth & Mikkola (2012) Reipurth B., Mikkola S., 2012, Nature, 492, 221
- Rivero González et al. (2012) Rivero González J. G., Puls J., Massey P., Najarro F., 2012, A&A, 543, A95
- Rodrigues et al. (2009) Rodrigues C. V., Sartori M. J., Gregorio-Hetem J., Magalhães A. M., 2009, ApJ, 698, 2031
- Różyczka & Franco (1996) Różyczka M., Franco J., 1996, ApJ, 469, L127
- Sana et al. (2012) Sana H. et al., 2012, Science, 337, 444
- Santolaya-Rey, Puls & Herrero (1997) Santolaya-Rey A. E., Puls J., Herrero A., 1997, A&A, 323, 488
- Schneider et al. (2016) Schneider F. R. N., Podsiadlowski P., Langer N., Castro N., Fossati L., 2016, MNRAS, 457, 2355
- Silva et al. (2017) Silva K. M., Flagey N., Noriega-Crespo A., Carey S., Ingallinera A., 2017, AJ, 153, 115
- Simón-Diaz & Herrero (2007) Simón-Diaz S., Herrero A., 2007, A&A, 468, 1063
- Simón-Diaz & Herrero (2014) Simón-Diaz S., Herrero A., 2014, A&A, 562, A135
- Skrutskie et al. (2006) Skrutskie M. F. et al., 2006, AJ, 131, 1163
- Smartt et al. (2002) Smartt S. J., Lennon D. J., Kudritzki R. P., Rosales F., Ryans R. S. I., Wright N., 2002, A&A, 391, 979
- Smith et al. (2013) Smith N., Arnett W. D., Bally J., Ginsburg A., Filippenko A. V., 2013, MNRAS, 429, 1324
- Stringfellow et al. (2012a) Stringfellow G. S. et al. 2012a, in From Interacting Binaries to Exoplanets: Essential Modelling Tools. eds. M. T. Richards and I. Hubeny I., Proc. IAU Symp. 282, Cambridge Univ. Press, Cambridge, p. 267
- Stringfellow et al. (2012b) Stringfellow G. S. et al. 2012b, in Four Decades of Massive Star Research – A Scientific Meeting in Honor of Anthony J. Moffat. eds. L. Drissen, N. St-Louis, C. Robert, and A. F. J. Moffat, ASP Conf. Ser., 465, 514
- Tody (1986) Tody D., 1986, Proc. SPIE, 627, 733
- Tody (1993) Tody D., 1993, in ASP Conf. Ser. 52, Astronomical Data Analysis Software and Systems II, ed. R. J. Hanisch, R. J. V. Brissenden, & J. Barnes (San Francisco, CA: ASP), 173
- Tout & Regós (2003) Tout C. A., Regós E., 2003, in ASP Conf. Ser. 293, 3D Stellar Evolution, ed. S. Turcotte, S. C. Keller, & R. M. Cavallo (San Francisco, CA:ASP), 100
- Verdugo et al. (2000) Verdugo E., Talavera A, Gómez de Castro A. I., 2000, in ASP Conf. Ser. 214, The Be Phenomenon in Early-Type Stars, ed. M. A. Smith & H. F. Henrichs (San Francisco, CA: ASP), 91
- Vieira et al. (2003) Vieira S. L. A., Corradi W. J. B., Alencar S. H. P., Mendes L. T. S., Torres C. A. O., Quast G. R., Guimarães M. M., da Silva L., 2003, AJ, 126, 2971
- Vink (2018) Vink J. S., 2018, preprint (arXiv:1808.06612)
- Wachter et al. (2010) Wachter S., Mauerhan J.C., van Dyk S.D., Hoard D.W., Kafka S., Morris P.W., 2010, AJ, 139, 2330
- Walborn & Fitzpatrick (1990) Walborn N. R., Fitzpatrick E. L., 1990, PASP, 102, 379
- Walborn et al. (2010) Walborn N. R., Sota A., Maiz Apellániz J., Alfaro E. J., Morrell N. I., Barbá R. H., Arias J. I., Gamen R. C., 2010, ApJ, 711, L143
- Wickramasinghe, Tout & Ferrario (2014) Wickramasinghe D. T., Tout C. A., Ferrario L., 2014, MNRAS, 437, 675
- Wright et al. (2010) Wright E. L. et al., 2010, AJ, 140, 1868