Void galaxies in the nearby Universe. I. Sample description
Abstract
The main goal of this work is to form a large, deep and representative sample of dwarf galaxies residing in voids of the nearby Universe. The formed sample is the basement for the comprehensive mass study of the galaxy content, their evolutionary status, clustering and dynamics with respect to their counterparts residing in more typical, denser regions and for study of void small-scale substructures. We present 25 voids over the entire sky within 25 Mpc from the Local Group. They are defined as groups of lumped empty spheres bounded by ‘luminous’ galaxies with the absolute K-band magnitudes brighter than –22.0. The identified void regions include the Local Void and other known nearby voids. The nearest nine voids occupy a substantial part of the Local Volume. Of the total number of 6792 cataloged galaxies in the considered volume, 1354 objects fall into 25 nearby voids. Of this general void galaxy sample, we separate the sub-sample of ‘inner’ void galaxies, residing deeper in voids, with distances to the nearest luminous galaxy Mpc. The ‘inner’ galaxy sample includes 1088 objects, mostly dwarfs with distribution peaked near –15.0 and extending down to –7.5 mag. Of them, 195 fall in the Local Volume (space within R=11 Mpc). We present the general statistical properties of this Nearby Void Galaxy sample and discuss the issues related to the sample content and the prospects of its use.
keywords:
cosmology: large-scale structure of Universe – galaxies: dwarf – galaxies: evolution – galaxies: formation – galaxies: general – catalogues1 Introduction
Voids as elements of the large scale structure fill 70 per cent of the modern Universe volume and represent its the lowest density regions. While the void galaxies comprise only a small fraction (15 per cent) of the whole galaxy population, their properties can give the important indications on the processes at the earlier epochs in the Universe. The study of voids and properties of galaxies residing in them remains one of the actual and important field of extragalactic and cosmological research (van de Weygaert, 2016; Aragon-Calvo & Szalay, 2013).
Massive observational studies of voids are mainly based on the modern surveys such as SDSS and ALFALFA (Grogin, Geller, 1999; Rojas et al., 2004, 2005; Hoyle et al., 2005, 2015; Patiri et al., 2006; Kreckel et al., 2011, 2012; Pan et al, 2012) as well on the earlier surveys (Las Campanas, 2dFGRS, 6dF, CfA). As a matter of fact, the great majority of the previous works dealt with distant large voids ( 80–200 Mpc). The common limit of used spectroscopic redshift surveys (, or ) and the applied requirements of statistical completeness resulted in the strong bias of the studied void galaxies to the upper part of the luminosity function (LF), e.i., to . The comparison of these most luminous void galaxies reveals only relatively weak differences of properties with similar galaxies in the adjacent walls (or denser environments).
In the recent series of papers we suggested a complementary approach aimed to study galaxy properties in a nearby Lynx-Cancer void, with the emphasis on the least massive void representatives (Pustilnik & Tepliakova, 2011; Pustilnik, Tepliakova & Kniazev, 2011a; Pustilnik et al., 2011b; Perepelitsyna et al., 2014; Pustilnik & Martin, 2016; Pustilnik et al., 2016; Pustilnik et al., 2005). These studies resulted in the firm conclusions on a systematically lower metallicity of gas and a higher H i-mass fraction of the void galaxy population in comparison to the similar galaxies in denser environments. These results imply that void galaxies in average evolve significantly slower than their counterparts in typical groups. Besides, it appeared that the substantial fraction of the faintest LSB dwarfs in the Lynx-Cancer void (mostly those with mag) show the very low O/H, extremely high gas mass fraction and blue colour of stars at the galaxy periphery. These properties indicate the atypical young evolutionary status of such LSB dwarfs (Pustilnik et al., 2010; Chengalur, Pustilnik, 2013; Pustilnik et al., 2013, 2016; Chengalur, Pustilnik, Egorova, 2017).
To study the fainter part of void galaxies, one needs first of all, to use the samples of sufficiently close objects. Since the available wide-field spectral surveys of galaxies have the limiting apparent magnitudes no fainter than (or close to) 18.5 – 19 mag, in order to deal with dwarfs as faint as mag, we need in a galaxy sample with the distance moduli less than mag, which implies the distances of Mpc.
Unlike the most of the last decade studies of voids and their galaxies, we limit our task by the separation of large ‘simply connected’ ‘empty’ volumes devoid of galaxies brighter than . Here = -24.0 is the characteristic absolute magnitude of the -band luminosity function.
It is worth to mention that several nearest voids were identified by Fairall (1998) and shown in his Atlas. However, over the past 20 years, the number of known nearby galaxies increased substantially. Therefore it is necessary to fulfill a new analysis of distribution and galaxy population of nearby voids. Recently, Elyiv et al. (2013) studied the properties of voids in the local Universe ( Mpc). They found many empty spheres interconnected into elongated structures (tunnels). While this work allowed the authors to probe the most rarefied space regions, their original selection causes significant limitations for void parameters and void galaxy sample. Namely, their voids were constructed with the sample of galaxies delineating voids to be of low luminosity: mag. This limit is 5.6 magnitudes fainter than the characteristic absolute magnitude of galaxy Luminosity Function mag (Hill et al., 2010).
Galaxies with somewhat lower than the luminosity are commonly used to define void boundaries. In numerical cosmological simulations, the masses of Dark Matter (DM) halos, delineating voids, usually correspond to objects with the luminosity 2–3 times smaller than the characteristic one. For example, in simulations by Aragon-Calvo & Szalay (2013), voids are determined by Cold DM halos corresponding to mag, what is mag (or a factor of 2) fainter than mag (Montero-Dorta, Prada, 2009; Hill et al., 2010). The galaxies with the intermediate luminosities, of define smaller subvoids in void substructures. Respectively, CDM halos of galaxies with define even smaller subsubvoids in those subvoids. In this context, the voids of Elyiv et al. (2013) delineated by galaxies of 170 times less luminous than , appear systematically smaller with respect of the previous studies. Majority of them should represent the fine structure of the rarefied regions or ’small’ cavities in much larger regions with the density above the mean one.
In the recent paper by Hidding et al. (2016) several voids in the nearby Universe were identified via a sophisticated analysis of the density field and galaxy peculiar velocities. However, they are shown only as illustrations in the significantly larger cell than considered here (namely, the cube with the side of 120 Mpc).
The goal of this work is to select large voids in the vicinity of the Local Volume (namely, within Mpc). The relative proximity of galaxy population in these nearby voids allows us with the use of the deep wide-field redshift surveys (like SDSS, 2dFGRS, ALFALFA) to find and study many intrinsically faint dwarfs with down to –12 mag and even to –10 mag. Despite the lack of the statistical completeness, the understanding of properties of the least massive void dwarfs can provide us with the important clues on the origin and evolution of the majority of galaxy population within the major part of the Universe volume occupied by voids.
Apart the void galaxy evolution issues (e.g. Hoeft et al., 2006; Hahn et al., 2006, 2007, 2009), the nearby void sample should be useful for the study of voids themselves. According to Aragon-Calvo & Szalay (2013), the internal filaments of voids with scales of 2 Mpc are still in the linear regime of mass assembly and therefore reflect the initial mass distribution. This, in less extent can relate to the low mass DM halos and their dwarfs. We can probe the small-scale structure of voids and study its properties only with a denser filling of a void volume with the test particles. Due to the known rise of the galaxy LF for lower luminosities (masses), to reach a larger galaxy number density, one needs to go deeper for void galaxy selection in their luminosity or mass.
Another interesting implication of the study of the least massive objects and their structures in voids is the expected sensitivity of filaments, DM halos and their galaxies to the admixture of Warm Dark Matter (WDM), since the presence of the WDM component can wash out the small-scale disturbances and thus limit the existence of the smallest galaxies and their structures (e.g., Angulo, Hahn, Abel, 2013).
The rest of the paper is designed as follows. In Section 2 we describe in detail all main procedures to construct ‘empty’ regions as defined by the ‘luminous’ galaxy sample. In Section 3 we describe the selection of void galaxies. Section 4 presents the list with the main geometrical parameters of the separated Nearby Voids and parameters of void galaxies taken from HyperLEDA and/or NED. In Section 5 we briefly discuss statistical properties of the Nearby Voids’ galaxies, compare them with the previous results and draw the prospects of the galaxy sample study. We finally summarize the results of this work and conclude in Section 6. For all distance dependent parameters, we adopt the Hubble constant of km s-1 Mpc-1. Due to their large volume for the printed version, the major part of tables and illustrative materials like the finding charts of the Nearby Voids’ galaxies and the 3D presentations of the individual nearby voids, are grouped in Appendix and presented in On-line materials.
2 Void sample
2.1 Overview
There are many void-finding methods described in the literature, ranging from those looking for maximal empty spheres in point distibutions, either of DM halos in simulations, or galaxies in volume-limited samples [e.g., Gottlöber et al. (2003) and references therein] to various ’advanced’ schemes looking for density minima in the DM or smoothed galaxy density distributions [e.g., Colberg et al. (2005); Hahn et al. (2006); Hidding et al. (2016)]. The majority of the modern methods were compared in Colberg et al. (2008). This comparison shows that despite the similarity of the most empty regions found by different methods, the basic parameters of voids can differ significantly from one method to another. One of implications of the above conclusion is the difficulty in the attempts to confront voids and their population separated on the distribution of real galaxies and those found on simulations with known distribution of DM.
In our approach we approximate nearby voids by the groups of lumped empty spheres bounded by the spatial distribution of luminous (massive) galaxies and galaxy groups to which they belong. This void selection is similar to the work of Patiri et al. (2006), but our method allows the found empty spheres to lump and thus, to form non-spherical voids, consisting of several close empty spheres.
The selection of the empty spheres, in turn, is based on Voronoi tessellation of cells around luminous galaxies (see, e.g., Matsuda, Shima, 1984; Icke, van de Weygaert, 1987, 1991; van de Weygaert, Icke, 1989). Voronoi tessellation divides the 3D space into cells in such a way that for each luminous galaxy there is corresponding region consisting of all points closer to that galaxy than to any other. Thus, the wall between the two cells consists of the points equally distant from the two neighbouring galaxies. The nodes of the grid delineating the cells are the local maxima of distances to the nearest galaxies, and they are centres of the maximal empty spheres which can be inscribed in this region of space. The algorithm of the void selection was implemented using the MATLAB package.
Before the use of the sample of luminous galaxies, we apply the algorithm of group selection described by Karachentsev et al. (2008); Makarov & Karachentsev (2009, 2011). The final sample of massive objects which delineate the empty spheres, includes both lonely luminous galaxies and groups of galaxies with the total luminosity exceeding the specific limit. The smaller galaxies identified as the members of these ‘luminous groups’ are excluded from the further analysis as by definition representing non-void galaxies.
To construct voids in the considered volume, we combine several empty spheres which obey the condition of a sufficiently small distance between the centres of two adjacent spheres (see details below).
2.2 Procedures of void construction
We created the list of galaxies with the radial velocities km s-1 relative to the Local Group (LG) rest frame (Karachentsev et al., 1996) using the HyperLEDA111http://leda.univ-lyon1.fr/ database (Makarov et al., 2014).
To minimize the effect of dust extinction in the Milky Way, we use -band magnitudes for luminous galaxies, for which the attenuation of light, even in the Zone of Avoidance (ZOA), is a modest. Thus, the luminous galaxies with Mpc are not lost. The absolute total magnitudes, , of galaxies are based on the photometry from the Two-micron All Sky Survey (2MASS) (Skrutskie et al., 2006) and the distances from the model of peculiar velocity field in the vicinity of the Local Volume (Tully et al., 2008). In cases when the distances are known from the accurate velocity-independent methods, we use the latter distances (see below). The -band characteristic value of the luminosity function is mag as adopted from Hill et al. (2010). This is well consistent with other estimates cited in their Table 5. We define ’luminous’ galaxies as those with mag or brighter. This threshold is 2.0 mag fainter than . These galaxies and groups around them determine void borders.
The adopted threshold in at 2 mag fainter than looks consistent with the -band absolute magnitude for the most luminous galaxies in the nearby Lynx-Cancer void (Pustilnik & Tepliakova, 2011). The latter is 2.1 mag fainter than according to Hill et al. (2010) and the earlier estimates. In fact, however, we identify in the separated voids of 3 per cent subluminous galaxies with –18.4 to –19.5 mag. So, the current Nearby Void galaxy sample differs from the studied in the Lynx-Cancer void by the presence of the small fraction of brighter subluminous objects.
Another important correction is related to the distance estimation from the redshift measurements. As shown by Tully et al. (2008), the apparent radial velocities of galaxies in the Local Volume and the adjacent regions are affected by the influence of the Local Supercluster and the large Local Void.
We applied the zero order peculiar velocity correction from Tully et al. (2008) related to the combination of motions of the Local Sheet (LS) of galaxies in the directions from the Local Void () and to the Local Supercluster centre (close to the Virgo Cluster) (), which in sum is km s-1 in the direction with the equatorial coordinates , .
According to Tully et al. (2008), the LG moves with respect of the LS coordinate system with the velocity of km s-1 in the direction of , . Then, to apply this peculiar velocity correction to a commonly used velocities , we transform vector to the LG coordinate system. This results in the motion with 357 km s-1 in the direction , . Thus, we adopt at zero approximation the velocity correction which accounts the motion of the LG with respect of the LS and of the LS as combination of the Local Void repulsion and the Local Supercluster attraction, . The correction to the galaxy radial velocity km s-1. Here is the angle between the vector and the direction to a galaxy. We did not apply the described above correction to the galaxies residing within the LS, those with km s-1 and Mpc.
We used the known velocity-independent distance estimates in cases when they came from the high precision methods based on the resolved stellar photometry (the tip of the red giant branch ’TRGB’, Cepheids, supernova type Ia) or via surface brightness fluctuations (SBF), which in general give the accuracy of distances at 10 per cent level (e.g. Tully et al., 2009). When galaxies have several independent estimates with these methods, we combine them to derive the most robust value.
We select all galaxies within Mpc from us. This gave us initially the sample of 7150 objects. This number includes all LEDA’s ‘galaxies’ satisfying the above distance limit. As one can see below, 358 of them (among residing in voids) appear different kinds of wrong objects (see details in Sec. 5.12), which were cleaned from the final sample. The total number of galaxies with the distance limit of Mpc, as resulted from the search with HyperLEDA, appeared after additional cleaning for wrong objects and parts of galaxies to be 6792.
| # | Void name | RAc | Decc | Distc | Max.ext. | Nu. | Nu. | Tot. | Inner | Notes |
| hours | degr | Mpc | ,, | orig. | joined | void | void | |||
| Mpc | sphere | sphere | gals | gals | ||||||
| (1) | (2) | (3) | (4) | (5) | (6) | (7) | (8) | (9) | (10) | |
| 1 | Cas-And | 00.7 | +53 | 19.0 | 19,19,23 | 13 | 5 | 19 | 15 | |
| 2 | Tuc | 00.9 | –64 | 11.2 | 14,14,14 | 5 | 1 | 56 | 44 | close |
| 3 | Cet-Scu-Psc | 01.3 | –02 | 15.2 | 33,17,29 | 40 | 14 | 108 | 85 | |
| 4 | Pho | 01.4 | –54 | 18.0 | 17,19,18 | 31 | 6 | 80 | 66 | |
| 5 | Tau | 03.8 | +17 | 18.8 | 24,27,21 | 17 | 7 | 53 | 46 | part at large extin. |
| 6 | Per | 04.0 | +52 | 19.7 | 14,14,13 | 2 | 1 | 4 | 3 | large extin. |
| 7 | Eri-Ori | 05.1 | –07 | 18.5 | 20,18,17 | 5 | 2 | 41 | 30 | |
| 8 | Ori-Tau | 05.4 | +15.2 | 07.5 | 18,14,14 | 11 | 3 | 46 | 36 | close, part at large extin. |
| 9 | Aur | 05.8 | +38 | 13.5 | 23,22,21 | 14 | 4 | 36 | 34 | close, part at large extin. |
| 10 | Lep | 05.85 | –17 | 06.3 | 13,13,13 | 3 | 1 | 43 | 32 | close |
| 11 | Mon | 06.4 | –07 | 20.2 | 19,15,16 | 9 | 3 | 7 | 2 | large extin. |
| 12 | Cnr-CMi-Hyd | 08.5 | +10 | 17.5 | 29,25,23 | 40 | 14 | 129 | 106 | |
| 13 | Vel | 09.5 | –50 | 19.0 | 20,27,21 | 29 | 7 | 76 | 59 | half at large extin. |
| 14 | Hyd | 09.8 | –15.2 | 19.2 | 18,14,17 | 8 | 3 | 22 | 15 | |
| 15 | Cen-Cir | 14.4 | –65 | 21.0 | 15,14,15 | 4 | 1 | 20 | 14 | at large extin. |
| 16 | UMa | 14.8 | +59 | 21.0 | 15,16,13 | 6 | 2 | 82 | 73 | |
| 17 | Vir-Boo | 14.8 | +07 | 10.2 | 14,14,15 | 5 | 2 | 20 | 12 | close |
| 18 | Boo | 15.3 | +27 | 19.4 | 20,24,26 | 11 | 4 | 49 | 33 | |
| 19 | Lib | 15.4 | –26.5 | 18.3 | 19,21,24 | 23 | 7 | 40 | 31 | |
| 20 | Her | 16.6 | +20 | 13.5 | 21,22,25 | 28 | 8 | 118 | 97 | close |
| 21 | Oph-Sgr-Cap | 18.5 | –18 | 13.0 | 37,30,35 | 68 | 23 | 121 | 89 | incl. LV, part at large extin. |
| 22 | Dra-Cep | 20.4 | +71.1 | 13.9 | 21,21,17 | 16 | 5 | 50 | 44 | close, part at large extin. |
| 23 | Cyg | 20.6 | +36.3 | 19.3 | 22,23,28 | 7 | 3 | 20 | 18 | part at large extin. |
| 24 | Pav-Oct | 20.7 | –73.1 | 15.7 | 23,20,18 | 19 | 5 | 36 | 30 | part at large extin. |
| 25 | Aqu | 22.7 | –02.5 | 15.5 | 20,22,24 | 33 | 9 | 80 | 72 |
The goal of the work is to construct an unbiased sample of voids on the scale of 25 Mpc. To avoid the edge effects on the properties of voids and its galaxy population, we extended the sample of ‘luminous’ galaxies up to the distance of Mpc. This allowed us to identify all empty spheres in the whole considered volume up to Mpc. The number of the ‘luminous’ objects in our sample is 464, of which 113 are the individual luminous galaxies and 351 are the known aggregates around luminous galaxies.
On the first step, we generated the set of maximal empty spheres inscribed into 3D distribution of the ‘luminous’ galaxies and its groups using Voronoi tessellation technique. The procedure for voids construction begins with the selection of the largest empty sphere, which is the core of a new void. This void consists of all spheres whose centres lie within the half radius from the centre of the main sphere. On the next step, we find the next maximal empty sphere and repeat the generation of a void around it.
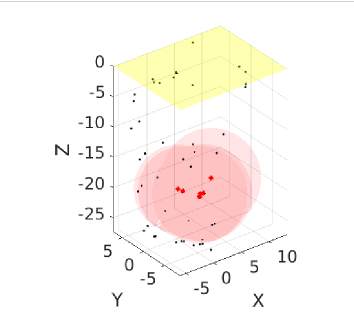
We played with various of empty spheres and the distances to the outer boundary. Our procedure selects at the first pass 445 empty spheres with radii from 11.0 to 6.0 Mpc gathered in 25 detached complexes. These complexes contain from 2 to 68 original empty spheres. However, all original empty spheres form clusters (in average of 3 spheres) of very close spheres with the distances between their centres less than 1–2 Mpc as compared with the radii of the spheres of 6–11 Mpc. If we join all empty sphere in clusters which we conditionally call the ’fat’ sphere, the total number of 445 empty spheres reduces to 140 ‘fat’ empty spheres. These ’fat’ spheres in turn are gathered in 25 detached complexes which we identify as separate voids. These voids and their more detailed description are presented in Table 1 and Sec. 4.1. In figure 1 we show 3D views of two voids (No. 11 and 19) along with all empty spheres of which they are constructed (in supegalactic coordinates SGX,SGY,SGZ). Small black dots show delineating luminous galaxies/groups, while the filled red circles show positions of the lumped empty sphere centers.
3 Sample of galaxies in nearby voids
When the nearby voids are defined as the aggregates of several/many large empty spheres, we separate all galaxies which fall into interiors of the individual empty spheres belonging to the defined voids. This preliminary selection resulted in the list of 2075 entries.
Each galaxy falling into voids was checked to possible membership of suits around ’luminous’ border galaxies. The procedure followed the methodology proposed by Pustilnik & Tepliakova (2011). Namely, we based on results of Prada et al. (2003) on the Dark Matter density profile and related velocities of companions of massive galaxies at various radial distances. For all separated ’void’ galaxies with the projected distance to the nearest luminous galaxy less than 1.2 Mpc, we examined the combination of the projected distance and the difference in radial velocities of a tentative host and a companion. If the difference was less than the expected value as predicted in the model of Prada et al. (2003), the galaxy was adopted as a companion and not a void sample representative. Otherwise, it was considered as a void galaxy. The threshold projected distance of 1.2 Mpc was selected close to the radius of zero velocity of typical groups in the Local Volume (Karachentsev, 2005), and smaller than the distance to the nearby dwarf group NGC 3109 (1.3 Mpc), considered as a detached aggregate not bound to the Local Group. For example, galaxy SDSSJ092036.5+494031 is situated at the projected distance of 0.33 Mpc from the luminous galaxy NGC2841 with and has the relative radial velocity of 118 km s-1. According to results of Prada et al. (2003), this is within the range found for bound companions.
The redshift space distortions near the massive aggregates such as galaxy clusters, lead to the well known fingers-of-god pattern. Thus, the cluster members can mimic the field object in the respective sky areas. We took this effect into account using the clusterization algorithm by Makarov & Karachentsev (2011). Thereby, a void border object contains not only the bright galaxy itself, but also all its satellites. After this step, we also examined the remaining galaxies for their possible membership of periphery in large known galaxy aggregates using the most recent information, namely, for the Virgo Cluster from Karachentsev & Nasonova (2010); Karachentsev et al. (2018), for UMa cluster complex (Karachentsev, Nasonova & Courtois, 2013), for Leo Clouds (Stierwalt et al., 2009) and for Fornax cluster (Nasonova, de Freitas Pacheco, & Karachentsev, 2010). However, in case of complicated structures, a few interlopers could remain in the sample.
These steps led to the exclusion of 361 galaxies from the initial void sample. Also, during various verifications, we excluded 312 various wrong entrees and 48 objects with poor quality of redshifts. This issue is discussed in more detail in Sec. 5.12.
After the cleaning, the resulting sample of 1354 objects represents the ’expanded’ void galaxy sample. It includes both galaxies: a) situated substantially deep inside the voids (1088), and b) those falling into transition outer zones of voids (266). The representatives of this expanded sample are suitable for some of related studies, including clustering of void galaxies and finding filaments and small scale structures inside the studied voids.
| # | Name | Coordinates (J2000) | Void | Notes | ||||||||
| (1) | (2) | (3) | (4) | (5) | (6) | (7) | (8) | (9) | (10) | (11) | (12) | |
| 1 | AGC102728 | J000021.4+310119 | 566 5 | 836 | 685 | 19.40 | 0.20 | -10.66 | - | 4.17 | 25 | |
| 2 | PGC000083 | J000106.5+322241 | 542 8 | 815 | 667 | 18.04 | 0.22 | -11.99 | -14.72 | 4.09 | 25 | |
| 3 | ESO149-013 | J000246.7-524618 | 1498 12 | 1418 | 1259 | 15.71 | 0.07 | -15.55 | -17.90 | 4.70 | 04 | |
| 4 | PGC000285 | J000406.3-572333 | 1889 64 | 1786 | 1640 | 16.55 | 0.08 | -15.29 | -17.63 | 2.42 | 04 | |
| 5 | PGC000389 | J000535.9-412856 | 1500 57 | 1475 | 1278 | 18.23 | 0.07 | -13.06 | - | 3.26 | 03 | ++ |
| 6 | ESO293-034 | J000619.9-413000 | 1512 6 | 1487 | 1279 | 13.62 | 0.07 | -17.67 | -21.80 | 3.28 | 03 | ++ |
| 7 | PGC000482 | J000625.4-413024 | 1428 62 | 1402 | 1279 | 15.10 | 0.07 | -16.11 | -18.57 | 3.28 | 03 | ++ |
| 8 | AGC748778 | J000634.3+153039 | 258 5 | 486 | 463 | 18.91 | 0.28 | -10.38 | - | 4.38 | 25 | |
| 9 | ESO293-035 | J000651.6-415023 | 1552 7 | 1525 | 1280 | 16.77 | 0.06 | -14.51 | -16.86 | 3.29 | 03 | |
| 10 | AGC239031 | J000652.8-412530 | 1435 81 | 1410 | 1279 | 17.92 | 0.07 | -13.37 | -15.97 | 3.30 | 03 | |
| Small part of Table A1 is shown as an example. The entire Table A1 is available in electronic form of the paper in the Appendix (On-line data). | ||||||||||||
In the context of the analysis of void galaxy evolution, by analogy with our previous study of the galaxy sample in the nearby Lynx-Cancer void, we introduce a more strict definition for an ’inner’ void galaxy. The ’inner’ sample galaxies should be well isolated from their nearby luminous neighbours that would warrant their secular evolution without significant disturbing interaction from the luminous/massive neighbours. This, of course, does not exclude possible interactions with smaller void galaxies. However, since the number density of void galaxies is reduced in average by factor of 5–10, the latter effect should be also much reduced with respect of similar galaxies in more typical environments. For these ’inner’ void sample galaxies, we adopt the condition to be separated by no less than 2.0 Mpc from the nearest ’luminous’ galaxy, that is 2.0 Mpc.
The remaining part of void galaxies with 2.0 Mpc we call the ’outer’ void subsample. Their fall in the range of 0.5–1.99 Mpc, with the median 1.64 Mpc. In the future study of possible evolutionary differences of void galaxies with respect to their counterparts in denser environments, we need to exclude an uncontrolled effect of the bordering luminous galaxies and/or an ambigious origin of ’outer’ void galaxies due to peculiar velocities and factor of uncertainty in their distances. Therefore we do not use this subsample for galaxy evolution study similar to our work on the Lynx-Cancer void sample.
The ’outer’ void subsample can be important for more general studies, not related to their evolution issues. In particular, in the study of void substructures, one uses all void population since we expect the continuity of void filaments all the way from the central parts to its boundary. One should also understand that the threshold value of 2.0 Mpc is a somewhat conditional choice. Due to the distance uncertainties, some galaxies with a little smaller than 2.0 Mpc may be in fact the representatives of ’inner’ sample and thus, can (and do) share properties of this sample galaxies.
4 RESULTS
4.1 Identified nearby voids and their properties
In this section we present the identified nearby voids, their main parameters, regions of the sky, and relation to the nearby voids described in earlier studies. The main information on nearby voids is summarized in Table 1. Besides the number of each void in our ’Nearby Void Sample’, we also present: in Col. 1 - a void name related to the respective constellation where the main part of void is projected. Columns 2, 3 and 4 present the approximate positions of void centres (respectively, RA, Declination and the distance in Mpc). In Col. 5 we give the approximate maximum extent of each void along the supergalactic X, Y, Z. Col. 6 and 7 give the numbers of original empty spheres and the number of lumped ’fat’ spheres in each void. Col. 8 gives the total number of galaxies in a void, while in Col. 9 we present the respective number of ’inner’ void galaxy subsample. In Col. 10 additional notes are given.
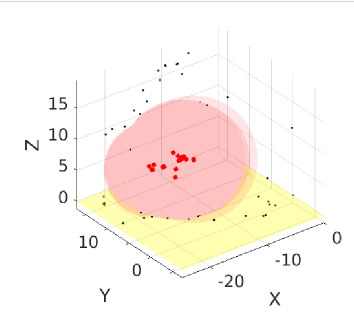
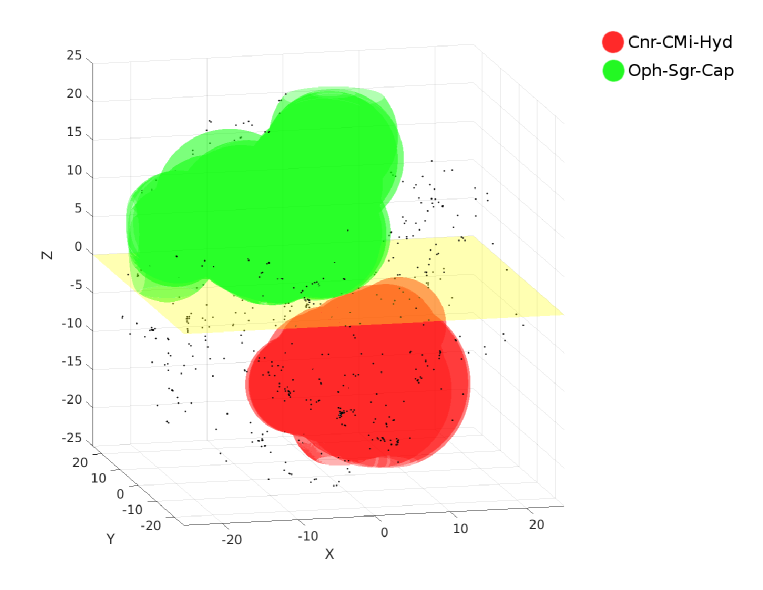
The largest void complex, as one could expect, is associated with the region of the Local Void and its surroundings. In our notation this is the complex of empty spheres No. 21 in Ophiuchus - Sagittarius - Capricornus. Its original 68 empty spheres with radii –10 Mpc are clustered near and , with distances to their centres of 12–17 Mpc. Approximately at the opposite side with respect of the Local Sheet there is another large void, No 12, in Cancer - Canis Minoris - Hydra. As mentioned in Introduction, we already studied a part of this void under the name Lynx-Cancer void.
As one can see in Table 1, the median diameters of nearby voids are 19 Mpc, with the full range of 13 to more than 30 Mpc. From this, the typical volume of separated voids is of 3500 Mpc3, with the full range from 1000 Mpc3 to 19000 Mpc3. It is interesting to compare the selected nearby voids with the minivoids found by Tikhonov, Karachentsev (2006) within the volume of Mpc. Their largest voids completely devoid of known (at that time) galaxies have volume of 60–440 Mpc3 and probably comprise the fine substructure of larger voids defined in this paper. Possible examples of such fine structure are the fragments of void filaments suggested in Beigu et al. (2013) and Chengalur, Pustilnik, Egorova (2017).
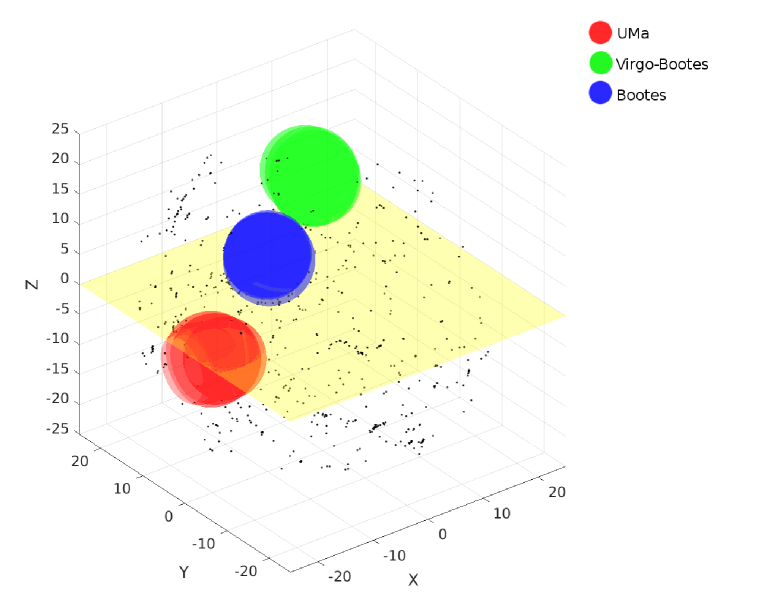
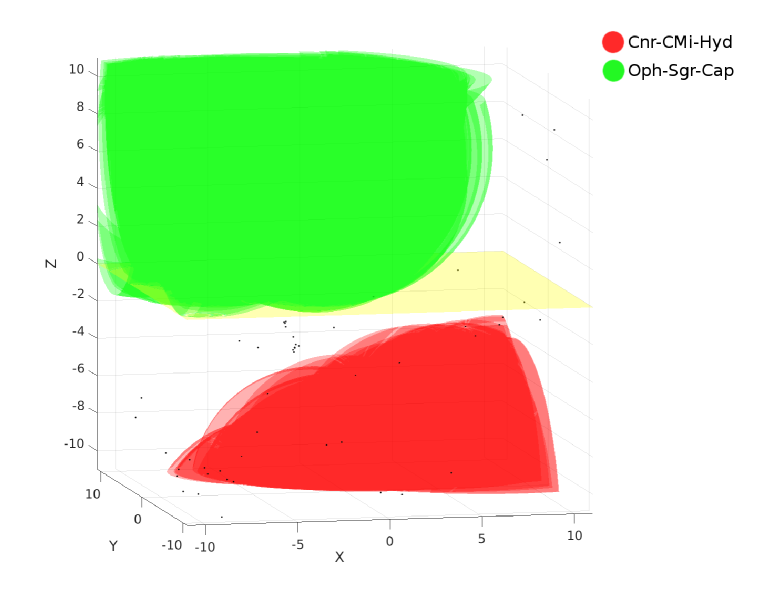
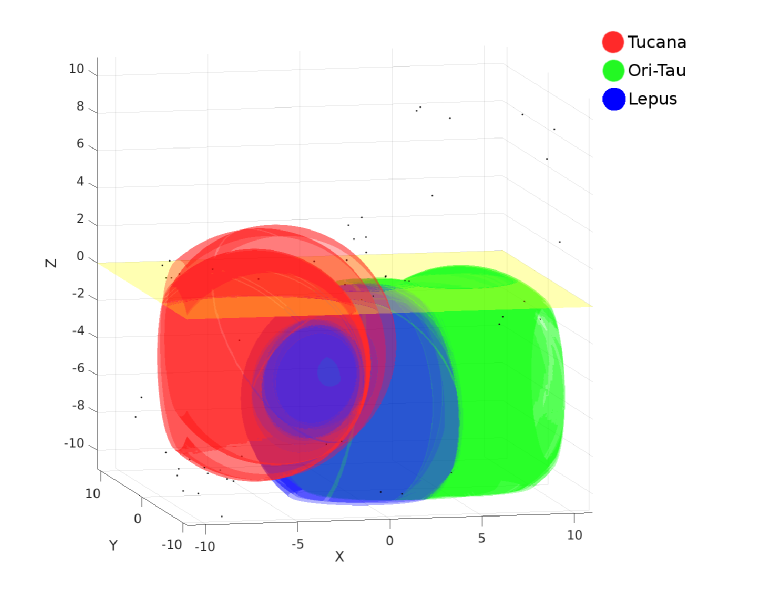
In Appendix we present 3D figures for all individual voids as positioned with respect of the Local Sheet. As an example, in the top panel of Fig. 2, we show the 3D view of two the largest voids while in the bottom panel the similar 3D view of several more typical nearby voids is presented (see Figure legends).
4.2 Nearby voids galaxy sample
In this section we present the lists of galaxies which reside in the nearby voids. Altogether the general sample includes 1354 objects. As was explained above, we divide them into two subsamples and present them in separate tables. The main ’inner’ sample with the distances to the nearest luminous bording galaxy of Mpc includes 1088 galaxies. The remaining subsample of ’outer’ (periphery) void galaxies with Mpc includes 266 objects.
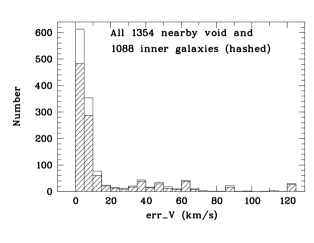
The main known global parameters of void galaxies are adopted from LEDA and NED. If some of the database parameters were found to be wrong, we used a corrected/improved value estimated by us or taken from the recent papers. In Table 2 we give the first 12 strings of Table A1 from Appendix (On-line materials) in order to show its structure. Table A1 presents the list of all 1088 ’inner’ void galaxies with their main observational parameters. It includes the columns. 1. Name (as in LEDA). 2. Coordinates on the epoch J2000. 3. and its error (in km s-1). The mean = 17 km s-1, with only a few per cent data with above 70 km s-1 (see histogram in Fig. 3). 4. Corresponding velocity in the Local Group system, , 5. Adopted velocity , which is defined as , where 73 km s-1 Mpc-1 is the adopted Hubble constant, and is distance in Mpc. For galaxies with known independent distance estimates via the high accuracy methods (TRGB, Cepheids, SNIa, etc), we adopt the respective value. For galaxies without such data residing in the Local Sheet (where the peciliar velocity correction is not applicable), is adopted to be . For the remaining galaxies outside the Local Sheet, we use for the model of Tully et al. (2008), with , where the peculiar velocity is a correction depending on galaxy position. It takes into account the overall motion of the Local Sheet and the Local Group from the Local Void and to the direction of Virgo Cluster. Its maximal value is 357 km s-1. See more detailes in Sec. 2.2. In column 6 we present the total magnitude, taken either from LEDA, or, if absent, in NED. For part of the sample galaxies within the SDSS footprint, without in LEDA and NED databases, we produced our own estimate of based on the SDSS model galaxy magnitudes via their transform to -band according to formula from Lupton et al. (2005). 7. Adopted the Milky Way extinction in -band, (in magnitudes), according to Schlafly & Finkbeiner (2011). 8. Absolute blue magnitude derived from the galaxy distance (/73), and in columns 5, 6 and 7. In column 9 we give the absolute magnitude in -band as presented in LEDA. The latter is mostly based on the Two-micron survey data for brighter objects, and on and the mean colour for the respective morphological type as found by Karachentsev et al. (2013) for fainter galaxies. 10. The distance (in Mpc) from a void galaxy to the nearest luminous neighbour. 11. Number of a Nearby Void (in terms of Table 1) to which a void galaxy belongs.
The similar Table A2 in Appendix presents 266 nearby void galaxies residing in ’outer’ parts of voids.
5 DISCUSSION
5.1 Statistical data on void galaxies
In total, within the sphere with Mpc we identify 1354 galaxies falling to the empty spheres belonging to 25 nearby voids presented in Sect. 4.1. Of them, 266 objects have distances to the nearest luminous neighbours delineating the voids () less than 2.0 Mpc, that is they populate the outer void regions. We call these galaxies, residing at the void periphery, the ’outer’ void objects. Due to various cosmological time-scale processes, on the one hand, and due to the observational uncertainties in their distances, on the other hand, a larger or smaller part of them can appear the objects from the denser surroundings of voids. Therefore, if for the study of void galaxy evolution we include this group, this can increase the scatter and shift the mean and median of the clean sample parameters. Their median = 1.65 Mpc, and only 18 of these 266 galaxies have in the range 0.46–1.0 Mpc.
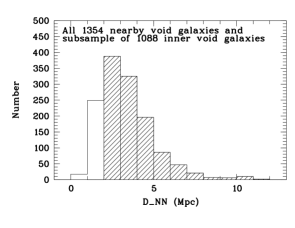
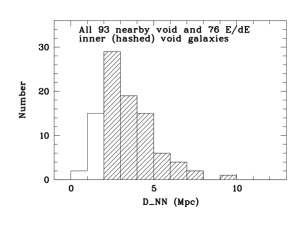
The remaining part of 1088 galaxies with 2.0 Mpc we call conditionally the ’inner’ void galaxies. They can be considered as genuine/native void objects which formed and/or evolved within the low density environments. The adopted threshold value of is an arbitrary, but according to our previous work on the nearby Lynx-Cancer void, this allows us to exclude efficiently various ’interloper’ objects while adressing the issue of possible peculiarities in the void galaxy evolution. The median value of for the inner subsample is 3.43 Mpc, with the full range of 2.0–11.5 Mpc. As one can see in Fig. 4 (bottom panel), the distribution of inner subsample is skewed to smaller distances, with 393 objects falling within the range of 2.0–3.0 Mpc. Of them, 204 inner galaxies have between 2.0 and 2.5 Mpc. This is a reflection of the known concentration of void population to their borders, derived both observationally and in simulations (see, e.g., Lindner et al. (1996) and Gottlöber et al. (2003)).
When we study the spatial distribution and clustering of void galaxies, the whole sample of void galaxies can be examined, since substructures of the void galaxy distribution should be more or less smoothly connected to those in the surrounding denser environments.
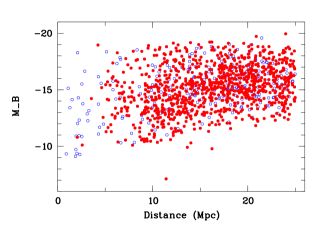
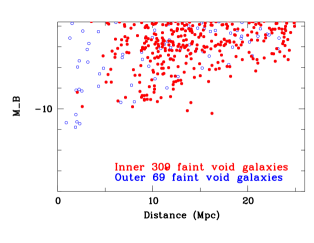
It is of interest, how much the effect of observational selection defines the content of intrinsically faint dwarfs in the nearby voids. In Fig. 5 we plot the relation of the void galaxies versus their distances. In the left panel all 1246 nearby void galaxies are shown with known , of which red filled octogons show 1004 ’inner’ void galaxies, while blue open octogons - 242 ’outer’ void galaxies. In the right panel we show the similar plot, but with close-up of the region for the faintest 378 void galaxies (conditionally, ) with known . Similary, 309 inner void faint galaxies are shown by red filled octogons, while 69 outer void faint galaxies - by blue open octogons.
The lower boundary on these plots roughly corresponds (with a few fainter exceptions) to the limiting apparent mag. The latter value is fainter than the typical limit for the main SDSS spectroscopic survey mag, as derived for typical dIs colours and the adopted SDSS spectroscopic survey threshold of mag. This partly is caused by the use of H i radial velocities of the ALFALFA faint sources identified with the faint optical galaxies with unknown redshifts and also by the dedicated search for fainter companions of the known void dwarfs. For the Southern hemisphere, the majority of the faintest galaxies come from the 2dF Galaxy Redshift Survey (2dFGRS) (Colless et al., 2003), where the limiting apparent is close to 19.5 mag.
5.2 Preliminary morphology classification of void galaxies
The great majority of void galaxies comprise late-type objects of Sd-Sdm at bright part of the luminosity function to various dIs at the faint end (e.g., Pustilnik & Tepliakova (2011); Hoyle et al. (2015); Beigu et al. (2017)). Below we attempt to summarize the available information on morphological types of galaxies in the Nearby Voids. There is no data for 271 objects, in HyperLEDA, NED or in the literature. For 241 of these galaxies, we performed our own coarse morphological classification based on the available CCD images of the SDSS and PanSTARRS1 (PS1) surveys (Abazajian et al., 2009; Dawson et al., 2016; Flewelling et al., 2016). In the sky regions outside the footprints of the above surveys, we used the scanned digitized photographic images from the DSS. We can not classify the remaining 30 objects, mainly due to the large extinction in the Milky Way. These objects are discovered via the blind H i-line surveys of ZOA and as such most probably belong to the late-type low mass galaxies. In the further statistics we count them conditionally as late spirals.
With this reservation, the whole sample of 1354 nearby void galaxies includes 95 objects (7.0 per cent) Early Type Galaxies (ETGs): E/dE or E-S0; 46 (3.4 per cent) lenticulars (S0-S0a); 371 objects (27.4 per cent) massive spirals (Sa-Sc and their subtypes); 192 (14.2 per cent) late spirals (Sd-Sm), including the mentioned above 30 obscured objects; 585 (43.2 per cent) various irregular and dwarf irregular galaxies (I/dI). Finally, we identify 16 blue compact galaxies (BCG) or BCG-like objects (1.2 per cent), which we count separately. Disc and irregular type galaxy population in voids is well known and is studied in many papers cited above during at least the last decade.
The existence in voids of 95 ETGs is very exciting since this gives us an opportunity to study their formation and evolution in the low density environment. Their real proportion still needs in careful checks since a part of them can represent unrecognized cases of projection of a Milky Way foreground star (with the radial velocity of hundreds to a thousand km s-1) onto the central part of a faint distant galaxy. In the current version of the void galaxy sample, based on the unbiased selection among all HyperLEDA objects classified as galaxies, the fraction of ETGs does not exceed 0.07. This amount is consistent with that found for the Void Galaxy Survey (VGS), namely, 3 ETGs of 60 galaxies in the whole void sample (Kreckel et al., 2012).
Similary, the fraction of ETGs of 0.05 among a half thousand nearby isolated galaxies (LOG sample) was found by Karachentsev et al. (2011). These numbers hint that the fraction of ETGs outside groups and clusters weakly depends on the degree of isolation. It will be the task of the dedicated study to clear up the true nature of this type void galaxy sample members and their origin in the void environment.
We mention that the very rare cases of field isolated dE/dSph (like the galaxy KKs 3) are found recently by Karachentsev et al. (2015a, b) at 2.1 Mpc from the Local Group. Their Tip of RGB (TRGB) distances are based on the HST images. Probably dEs from the presented Nearby Void galaxy sample have the common origin and evolutionary paths with KKs 3. About 25 per cent of the early-type galaxies from the current Nearby Void sample are detected in H i-line in the frame of several known H i-surveys. This indicates their atypical evolutionary properties. In this context, it is worth to mention the recent results of H i survey of a small group of isolated early-type galaxies (ETG) by Ashley, Marcum, & Fanelli (2017), who indicate their unusual properties with respect of the similar ETGs in dense (groups and cluster) environments. The earlier work on H i properties of ETGs was presented by Grossi et al. (2009) based on the ALFALFA data. Some of them also reside in voids and show differences in their properties in comparison to the typical ETGs.
5.3 Void galaxies in and near the Zone of Avoidance
As was mentioned in the Introduction and in Sec. 2.2, thanks to the definition of luminous galaxy sample delineating voids via their -band luminosity, we probe the low-density regions through the whole sky, without the artificial break of structures near the Milky Way equator. Parts of the identified voids, hence, cover the Zone of Avoidance (ZOA), the sky region near the galactic equator (roughly, °). The related amount of dust extinction in -band, , varies for void galaxies roughly from one to several (and in a few cases ten and more) magnitudes. Specifically, we identify for the inner void galaxy sample 126 galaxies with mag.
The luminous galaxies till the distance of 28 Mpc, used to define the nearby voids, all are visible within the ZOA. However, the optical detection of smaller galaxies and dwarfs is affected by both the above substantial extinction and by the crowded stellar environments. Therefore, the major part of galaxies in this region (80 per cent) are found via the 21-cm H i radio-line (blind) surveys (HIPASS, ALFALFA) or the dedicated H i surveys to probe the content of ZOA (Staveley-Smith et al., 2016; McIntyre, 2015). Also, the part of ZOA galaxies were identified via the redshift measurements of extended NIR sources (2MASX) from the Two-micron survey (Skrutskie et al., 2006). Therefore, the subsample of void galaxies in this region is biased to more or less gas-rich objects.
It is naturally that the completeness of void galaxies in ZOA is much reduced with respect of that in the other sky regions. Only for a part of them, the optical counterparts are found. The main numbers for void galaxies in the ZOA are as follows. Of the total 1354 void objects, 160 fall in ZOA. Of these 160 galaxies, 69 objects have no optical photometry. The majority of them are either invisible in the common optical surveys, or are bearly detectable. The absolute magnitude distribution for the remaining 91 galaxies is clearly shifted to the larger luminosities. Only 5 galaxies (5.5 per cent) of these 91 have mag, with the median of mag, in comparison to the median of the whole void 1246 galaxies with known , mag. Of them, 373 (28 per cent) are fainter than mag, conditionally selected as a border between the least luminous dwarfs.
5.4 Notes on Nearby Void galaxy clustering
As far as we aware, the issue of void galaxy clustering was little addressed earlier. There was a paragraph in our description of galaxy sample in the nearby Lynx-Cancer void (Pustilnik & Tepliakova, 2011), where it was noticed that around 18 per cent of them form pairs. A more advanced study of this issue was performed with H i mapping of about 60 void galaxies from the Void Galaxy Survey (VGS) (Kreckel et al., 2012). With the newly H i detected mostly less massive companions of the main sample void galaxies, the authors found that 40 per cent of VGS galaxies (including the new detections) are members of pairs or triplets.
In the current sample, thanks to a much larger statistics, we can give an independent and more general estimate of clustering frequency of void galaxies. We marked in the last columns of the Appendix Tables A1 and A2 by ’++’ all galaxies which either certainly or with the large probability to be in pairs, triplets, quartets or in a void group NGC428. For the ’inner’ subsample (Table A1) of 1088 galaxies, 190 (17.5 per cent) objects form small aggregates. For 266 objects from the ’outer’ galaxy subsample, presented in Table A2, the situation is similar. 46 (17.2 per cent) of them form pairs or triplets. Overall, 236 of 1354 Nearby Void galaxies (17.4 per cent) appear in the bound aggregates.
It is interesting to compare this number with that for the general galaxy sample in the nearby Universe derived in Karachentsev et al. (2008); Makarov & Karachentsev (2009, 2011). According to those studies, the fraction of galaxies within the bound aggregates in the Local Supercluster comprises of 54 per cent. Thus, the coarse comparison of void galaxy sample and the whole galaxy sample in nearby Universe reveals the drastic difference in their local environment. To estimate more accurate differences in the local clustering of galaxies from both samples, one needs to form galaxy samples with similar selection criteria. This will be a task for a more careful study of the discussed void galaxy sample.
As for the comparison with the clustering results for void galaxies from VGS, one needs in a sensitive H i mapping of representative subsamples from the current Nearby Void Galaxy sample. This should bring many new low-mass void objects, probe void galaxy mass function at the lowest limits, will probe the galaxy aggregates elongation and probable connection with void filaments and substructures. The whole sky sensitive H i mapping with the next generation radio astronomy facilities - SKA and ngVLA, and their pathfinders Apertif, ASCAP and MeerKAT will greatly advance our understanding of the low-mass galaxy population in the nearby Universe.
5.5 Preliminary summary of H i data
For 980 galaxies from the Nearby Voids, we found data on H i fluxes in LEDA and in the literature. Most of them come from two blind H i surveys: HIPASS and ALFALFA. One of the important related questions is how much gas the void galaxies have in comparison to similar galaxies in denser environments. There are direct observational indications on the enhanced gas mass fraction in void galaxies. But, on the one hand, they are not numerous due to small statistics for nearby voids (Pustilnik & Martin, 2016). On the other hand, for more luminous galaxies in more distant voids (e.g., VGS, Kreckel et al. (2011, 2012)), the situation with the gas mass fraction with respect of the control ALFALFA sample is less certain despite a substantial number of found the lower luminosity gas-rich objects.
The recently published final ALFALFA release (Haynes et al., 2018) of about 31500 H i-bearing galaxies should significantly advance our understanding of this issue in both the lowest mass void galaxies and the more distant and more massive void objects.
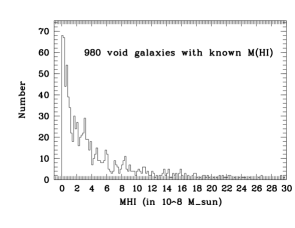
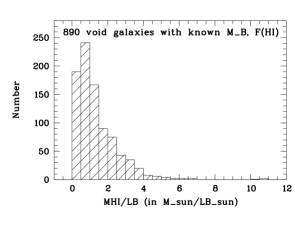
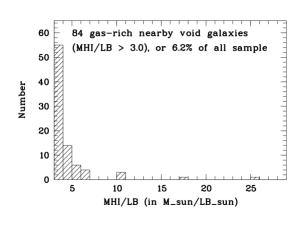
In Fig. 7 we present the distribution of all 980 nearby void galaxies with the available H i-flux detections. In the top panel the histogram of the sample M(H i) is shown, in units of 108 M⊙. It is very broad, from 0.003 to 52, with the median of 2.85. 34 galaxies have M(H i)/( M⊙) 0.1, and 35 more have M(H i) in the range (0.1–0.2) 108 M⊙. In the middle panel we show the distribution of parameter M(H i)/ (in solar units) for all 890 void galaxies with known and M(H i). It also is very broad, from 0.03 to 26, with the median of 1.03. In the bottom panel we show the closed-up part of this histogram for 84 the most gas-rich void galaxies. One can notice that this distribution steeply falls for M(H i)/ 4–5. Only a handful of void galaxies are found with this parameter to be more than 5. Most of them were already found in the recent publications. They include, in particular, J0723+3622 and J0723+3624 with M(H i)/ = 10.7 and 25.6 respectively (Chengalur, Pustilnik, 2013), J0706+3020 with M(H i)/ = 17.1 (Chengalur, Pustilnik, Egorova, 2017), AGC198691 (M(H i)/7 (Hirschauer et al., 2016), J0110-0000 (M(H i)/6.5), J2104-0035 (M(H i)/4.4 (Ekta et al., 2008).
We should comment at this place on caution to use the LEDA parameters to separate the most gas-rich galaxies without the careful additional checks of the adopted database values. In particular, in the first pass to build this distribution, we found substantially larger number of very gas-rich objects than it is shown here. To check their reality, we examined the subsample of 56 void galaxies with the highest M(H i)/ 3. 15 of them, mainly the most gas-rich, appeared faulse due to unproperly adopted magnitudes in LEDA database. In particular, when there are multiple measurements, the adopted magnitudes are often the old ones, with the low accuracy and typically are underestimated. In cases of the only magnitude estimates, obtained from photoplates, there exist new data in the literature with CCD photometry which differ substantially in the direction of brighter magnitudes. Correction can be as high as 1 – 2.5 mag, or a factor of 2.5–10 in reduction of the automatically derived parameter M(H i)/. We also checked for two dozen of this group void galaxies, the model magnitudes presented in the SDSS database, performing own aperture photometry. For the great majority of the examined galaxies, the total magnitudes from aperture photometry appeared systematically brighter, with the typical difference of 0.5 mag.
We have checked only the most obvious cases which resulted in the artificially elevated M(H i)/. This allowed to fix the largest deviations in LEDA database. It is not clear, how often the smaller underestimates of occur which can somewhat affect more numerous galaxies with more typical values of M(H i)/. This can take a special massive study. However, for goals of statistical analysis of various samples, one should keep in mind that real in LEDA for samples of nearby galaxies can be partly biased to the fainter luminosities.
5.6 Nearest voids within the Local Volume
The issue of the nearest void galaxies, and in particular of those belonging to the Local Volume, is worth to briefly discuss since their proximity gives them an additional advantage to be studied in a more detail. As can be seen in Fig. 8, a part of the nearest voids falls into the sphere with Mpc. This is the definition of the updated version of the Local Volume related to the sample of the Updated Nearby Galaxy Catalog (UNGC) (Karachentsev et al., 2013). The most updated version of this catalog includes 1153 galaxies.222https://www.sao.ru/lv/lvgdb
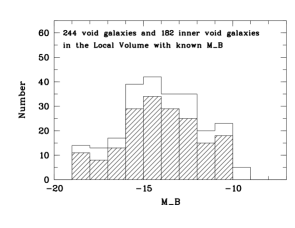
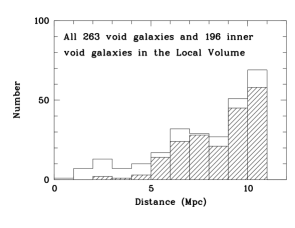
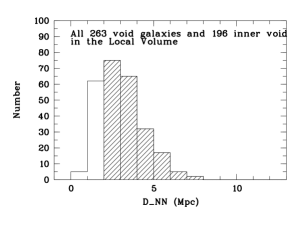
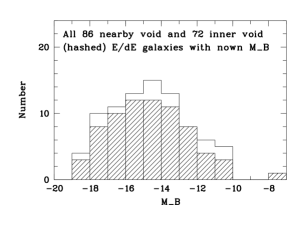
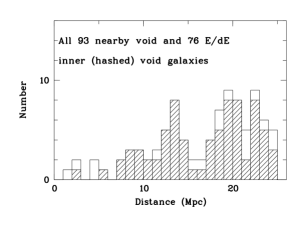
The distributions of void galaxies residing in the Local Volume on , distances and are shown in Fig. 9 (hashed part marks ’inner’ void subsample). The number of void galaxies falling within the Local Volume (LV) is currently 263. That is, the nearby void galaxy population comprises 23 per cent of all known galaxies in the LV. Of them, 195 belong to the ’inner’ void galaxy population, while the remaining ’outer’ 68 galaxies are situated closer to the void boundaries. The fraction of the LV void galaxies in the regions with the large Milky Way extinction (adopted here as 1.0 mag) is a substantial: 12 per cent (29 objects, of them 23 galaxies of the ’inner’ subsample and 6 - of the ’outer’ subsample). In summary, the sample of the inner void galaxies counts 160 unobscured objects, or 14 per cent of the whole number in this volume. This gives us the good prospects of their deep studies, including the possible peculiarities of their evolution via the resolved stellar populations with the HST and the future space telescope JWST.
In particular, it is interesting to compare the number of void galaxies within the Local Void region (in our scheme, this is No. 21, Oph-Sgt-Cap). It approaches the Local Sheet and comes close to the Local Group. Sixteen Local Void galaxies were identified recently by Nasonova & Karachentsev (2011). Our subsample includes 89 ’inner’ galaxies in comparison to the above 16 galaxies in their work. Of them, 82 galaxies are new Local Void objects. Of these 82, 26 galaxies have Mpc, that is reside in the Local Volume.
Additional 32 galaxies from the ’outer’ subsample also fall within the Local Void. Of them, 28 are new Local Void galaxies. 17 of these galaxies have 11 Mpc. A half of these 32 objects have Mpc, and thus, they also can be studied as residing rather deep in the Local Void. In total, 36 galaxies in the Local Void fall in ZOA ( mag). However, only 14 of them fall in regions with mag.
One of the important advantages in the study of the nearest voids is the opportunity to measure the peculiar velocities of void galaxies due to void expansion via taking their independent good accuracy distance estimates with, e.g. TRGB method based on the HST images. The potential of this direction was recently successfully demonstrated by Rizzi et al. (2017) for two dwarfs within the Local Void at distances of 8.4 and 7 Mpc, with the estimated galaxy velocities away from the void center to be 270 and 370 km s-1. The advancement in the nearest future of TRGB distance measurements with the new JWST 6-m space telescope and in the close perspective with such ground-based giants as E-ELT and TMT will allow to extend such study to the outer border of the Nearby Void Galaxy sample.
5.7 Some unusual galaxies residing in the nearby voids
As noticed in Introduction, the deep unbiased study of faint LSBDs in the Lynx-Cancer void resulted in the discovery of about ten blue very gas-rich and extremely metal-poor dwarfs. They represent 10 per cent of the total void galaxy sample. However, their fraction increases till 30 per cent for the lowest luminosity void LSB dwarfs. Their observational properties are consistent with the hypothesis that such unusual void dwarfs represent the youngest local galaxies. In particular, they can be among the local very young galaxies (VYGs) defined by Tweed et al. (2018) as galaxies which formed more than a half of their stellar mass during the last 1 Gyr. In particular, they may be more quiscent analogs of extreme metal-poor star-forming galaxies such as J0811+4730 with ⊙/50 (Izotov et al., 2018).
One of the tasks of formation of the Nearby Void Galaxy sample was its potential to search for new unusual least evolved objects and to increase the sample of such galaxies several fold. This will allow us to study their properties statistically and to address their origin and nature. At this stage, having for the cataloged void galaxies only the general parameters from the public databases, we can only make a preliminary selection of candidates to such unusual galaxies for the subsequent checks of their crucial properties. The subsample of about three dozen such candidates selected for the additional observations will be presented in the accompaning paper. Just as examples, we mention a couple of such new objects.
The first one, J0110-0000 (AGC411446) is a very blue faint ( mag) and gas-rich [(H i)/] dwarf at 17 Mpc, with the preliminary estimate of 12+(O/H) = 7.01 dex. Its stellar mass, estimated with the commonly used light-to-mass ratio from Zibetti, Charlot, Rix (2009), comprises less than 1 per cent of the whole baryon mass (Pustilnik et al., 2018, in preparation). From the sum of its properties, this object is a good representative of the similar objects found in the Lynx-Cancer void sample, a candidate VYG and the record low-metallicity galaxy in the nearby Universe. Its O/H is very close to that of the similar void dwarf AGC198691 (Leoncino) (Hirschauer et al., 2016).
The second galaxy, J1349+3544 (AGC239144) at 20 Mpc, is also very blue, gas-rich [(H i)/] and faint (). From the intermediate quality spectrum of its faint H ii region, obtained recently with the SAO 6-m telescope, we estimate its tentative O/H at the level of (O/H)⊙/50. When this preliminary value of O/H is confirmed, this galaxy will appear one more candidate to void VYGs.
5.8 SDSS Stripe 82
The SDSS Stripe 82 covers 275 sq.deg within the RA range of 310° to 59 ° (or ) and Dec = –1.25° to +1.25°. Its apparent magnitude limit is deeper by than the standard SDSS limit (Fliri & Trujillio, 2016). Of our total void galaxy list, 22 objects fall inside the region of the Stripe 82. This presents us an opportunity to study nearby void galaxies to a much fainter surface brightness level. Besides, this database allows us to search for fainter companions near already known void dwarfs. This is a way to extend the census of void galaxies to the lowest mass objects. This approach we already tested successfully on the Lynx-Cancer void sample.
In particular, in this region we identify near the center of Void No.3 the unusual group with the dominant spiral NGC428 with . It includes seven fainter galaxies with in the range of –11.3m to –15m. At least three of them are galaxies with very low O/H. These are UGC 772 with 12+(O/H) = 7.15–7.32 (Izotov et al., 2012), IC 88 with 12+(O/H)=7.56 (Kniazev, Egorova, Pustilnik, 2018) and the mentioned above J0110-0000 with 12+(O/H)7.0. The group represents a clear density peak within a void, and according to the models of void substructure by Sheth & van de Weygaert (2004); Goldberg & Vogeley (2004); Aragon-Calvo & Szalay (2013); Rieder et al. (2013, 2016), it may be a node of several void filaments. Thus, its very deep mapping in H i, similar to suggested in the project MHONGOOSE (Sorgho et al., 2018), may be a mean to probe a tenuous gas in the related filaments.
5.9 Void small-scale structures
One of the important issues of the modern cosmology paradigm is the nature of the ubiquitous dark matter component. As a complementary to the widely adopted models with only Cold Dark Matter (CDM), several groups elaborate the effect of various kinds of Warm Dark Matter (WDM) mixed at different proportions with the CDM component. The main difference of WDM models with the standard CDM models appears at ’small’ scales, on which the streaming of WDM particles should wash out structures (Tikhonov et al., 2009; Angulo, Hahn, Abel, 2013). To date, the firm predictions of void structure at small scales for various fractions of WDM are absent. However, the progress in the N-body simulations with the increasing mass resolution allows us to hope to nearby future advancement in the theoretical predictions of void properties at the smallest scales comparable to 1–2 Mpc, e.g. Aragon-Calvo & Szalay (2013).
To date the issue of small scale filaments in voids based on observations is studied very little. Only a couple of examples mentioned in Sect. 4.1 was addressed. To be able to compare different predictions of DM scenarios including various fractions of WDM (e.g. Yang et al. (2015)), observers need to deal with the void small-scale structures, which in turn can be probed only with a sufficiently large number density of lower mass halos (galaxies). This situation dictates the need to pay attention to the deeper probes of the void environment in the nearby Universe, and in particular to the space of the Local Supecluster adjacent the Local Volume. With the presented Nearby Void Galaxy sample, we pursue the first steps in creating this cosmologically important benchmark galaxy collection. We expect the further substantial increase of this sample thanks to results of the future wide area deep H i surveys with the SKA and its pathfinders Apertif, ASKAP and MeerKAT as well as the New Generation VLA.
5.10 Limitations of the void galaxy catalog
As described in Sec. 2.2, in the process of selection of empty spheres, we adopted the lower limit for their radii of 6.0 Mpc. This decision was motivated, on the one hand by the goal to limit the voids’ sizes by more or less commonly used sizes. On the other hand, this allows one to prevent the effect of ’percolation’ which joins many larger voids into connected regions via the tunnels of smaller voids. This arbitrary limit is somewhat artificial, reflecting the authors’ intention to describe the nearby lowest density regions as a collection of more or less individual voids.
The smaller voids, and in particular, some smaller ’pockets’, adjacent the larger ones, occupy the significant fraction of the volume not included into presented void sample. Their void dwarf population certainly can be similar to the population of larger voids. We mention two known galaxies falling into the volume under consideration which are very gas-rich, low-metallicity objects, and, hence, are similar to many void galaxies. The first one is And IV (Karachentsev et al., 2016; Pustilnik et al., 2008) at 7 Mpc falling in a minivoid with the total size of 7 Mpc. The second example is a very gas-rich pair of a metal-poor LSBD and an H i-cloud without visible optical counterpart, HI 1225+01 (Salzer et al., 1991). This unusual pair resides at the distant periphery of the Virgo Cluster, at 3–6 Mpc (Salzer, 1992), depending on its real distance (10–20 Mpc), which is poorly determined due to the object falls in the ’triple-valued region’ of the Virgo Cluster velocity field. However, its more ’local’ environment on the scale of 1–2 Mpc is devoid of luminous galaxies (Salzer, 1992) and forms a kind of a low-density pocket.
The real void-intervoid web structure of matter distribution is of course much more complex than we approximate it in this paper. The future work aimed in a more precise description of the structure of the nearby region of the Universe will extend our approximate description and will allow us to follow better finer details and their possible effects on galaxies within these low-density regions.
It is worth to mention on the substantial inhomogeniety of the current nearby void galaxy sample on the depth along the celectial sphere. This is related to both the North-South asymmetry of the redshift data and the substantial loss of depth in voids falling to the sky regions at low galactic latitidues. The North-South asymmetry is caused by the substantial contribution to the northern hemisphere of void galaxy sample from both the SDSS redshifts and ALFALFA redshifts which allow us to identify the fainter galaxies with respect of those in the Southern hemisphere.
5.11 Comparison with similar works
It is worth to compare our ’Nearby Void Galaxy’ sample with several similar published samples with the emphasis on the main differences of our approach. As already was mentioned above, the main idea was to extend to a much larger volume the galaxy sample formed by us earlier in the nearby void in Lynx-Cancer (Pustilnik & Tepliakova, 2011). That sample has the very important advantage over several other known samples thanks to its significantly deeper probe of the faintest and the least massive void galaxy population. The similar work was recently performed for a somewhat more distant void by Kniazev, Egorova, Pustilnik (2018). The study of galaxies in both voids resulted in the similar conclusion on the slower void galaxy evolution.
Other studies of more or less similar samples which were published recently, include papers by Elyiv et al. (2013) (voids within 50 Mpc and their dwarfs) and Bradford et al. (2015) (isolated dwarf galaxy sample based on the SDSS database). The papers by Moorman et al. (2015, 2016) deal with the ALFALFA-SDSS galaxies in voids determined by Pan et al (2012) on the SDSS DR7 galaxy sample. Since their nearest voids are situated at 50 Mpc, the study of Moorman et al. (2015) is limited by the more luminous dwarfs. The Void Galaxy Survey (VGS) by van der Weygaert et al. (2009), Kreckel et al. (2012) is devoted to the detailed study of 60 galaxies situated in the centers of large voids of the SDSS footprint. Similary, it deals mostly with more distant voids (average distance of 80 Mpc) and therefore only a few their sample galaxies have .
Elyiv et al. (2013) find only about 70 dwarf galaxies residing in their voids with up to 50 Mpc. About 1/3 of them fall within 25 Mpc. Most of those 24 galaxies reside in our voids. They contribute only a few per cent to the number of our void galaxies with what roughly corresponds to their .
One of the closest samples of isolated galaxies is the so called Catalog of Local Orphan Galaxies (LOG, 500 galaxies with ) by Karachentsev et al. (2011). Due to their local isolation criteria, the number of common objects of LOG and nearby void sample is relatively small. It can be examined by the statistical study of evolutionary parameters for both samples, which of factors: local or global isolation, are more important. As an example indicating the probable prevalence of the global low density (aka void type population), we refer to several the least evolved void LSB dwarfs mentioned in Introduction, which enter to physical pairs and triplets. This membership and the related tidal interactions can be an appearance of the recent (time-scale of 1–2 Gyr) an aggregate assembly. This, in turn, acts as a trigger of a relatively short time-scale recent episode of star formation in void protogalaxies with the globally delayed evolution.
Bradford et al. (2015) also deal with the sample of isolated galaxies selected from the SDSS database but in a much larger volume with up to 250 Mpc. Their criterion of isolation of 1.5 Mpc from luminous galaxies with is weaker than our ( 2.0 Mpc for galaxies with ) and ignores the large-scale environment. Of their sample of 1715 isolated galaxies, only 50 fall into the volume with 25.0 Mpc, which is the subject of our study. It will be interesting, after accumulation of the sufficient data for our Nearby Void Galaxy sample (including H i-data), to compare its properties with those of Bradford et al. (2015) sample. This probably will help to disentangle the effect of low-density environment and that of the local isolation.
5.12 Issue of wrong objects in the initial catalog
As described in Sec. 3, from the sample of 2075 initially selected objects, we removed 361 satellites of luminous galaxies or members of the related groups as well as probable representatives of several large galaxy concentrations. Of the remaining 1714 selected in LEDA objects, which fall in the interior of the found empty spheres, there was rather large amount of entries with either unknown photometry (in total 356), or with the adopted very faint magnitudes which resulted in the absolute -magnitudes of to for galaxies outside the Local Group or nearby groups (in total 177). We performed the careful checks of these 533 as well as other doubtful objects to find possible errors in the original catalog data. Indeed, we identified 312 entries with various kind mistakes which we excluded from the final void galaxy sample presented in Tables A1 and A2 of Appendix.
The excluded 312 objects fall in the next categories, with the respective numbers in parentheses. a). Galactic stars with the radial velocities of several hundred up to about a thousand km s-1 (91). A part or all of them can be non-recognized runaway and hypervelocity stars which are expected to be rather numerous in the Milky Way (e.g, Brown et al., 2015; Marchetti et al., 2018). b). Stars with the same range of radial velocities, projected near the central parts of background distant galaxies (40). c). Galaxies with the SDSS spectra which in the latest versions of SDSS database have red-shifts much larger than the adopted in LEDA, or marked in LEDA as uncertain ones (81). d). Small parts of galaxies (usually H ii-regions), identified as independent extragalactic objects (42). e). Quasars (7). f). Various artifacts, like strays from bright stars (10), g) PNe and GC (4), h) doubtful H i sources (6). Around 30 more of the original LEDA entries were excluded on various additional reasons. One of particular cases, the object with the unusual morphlogy, PGC3097159 (SDSS J061431.3+073424), appeared in HyperLEDA with km s-1. According to our BTA 6m telescope spectrum, this is the Milky Way planetary nebula with the real km s-1 as derived from the observed wavelengths of H and the strong line [NII]6583.
Besides, when the preliminary version of the Nearby Void galaxy sample was formed, we realized that for part of them the cited errors of are too large, what hampers the real placement of an object within voids. We excluded additionally from the void sample 48 galaxies with the cited 150 km s-1.
These findings indicate that in catalogs created mostly via automated procedures, there exists a sizeable fraction of garbage. As for the formation of clean samples of galaxies in the nearest regions adjacent the Local Volume, the contamination with the Milky Way stars and parts of galaxies with multiple H ii-regions can be the main factors of incorrect identification.
6 Summary and conclusions
In this paper we use the most updated version of HyperLEDA galaxy collection in the nearby Universe to form the large and representative sample of galaxies residing in the Nearby Voids, namely, the voids which we identified within the sphere of 25 Mpc. We made several important improvements with respect of the previous works. They include the following.
-
•
The use of the definition of luminous galaxies delineating the voids based on their absolute -band magnitude. This strongly eliminates the effect of the Milky Way extiction and, thus, allows us to expand the sample of delineating luminous objects to the whole sky. This allows us to look for nearby voids without the artificial break of the search areas by the Zone of Avoidance.
-
•
As it is known from the recent studies, there exists the global motion of the Local Group (within the Local Sheet), which combines both the attraction to the center of the Local Supercluster and the repulsion motion of the Local Sheet as an outer/border part of the giant Local Void, with the total velocity amplitude of 350 km s-1. We take this motion into account to correct distances of all galaxies in the volume under the question, for which we have no independent good accuracy distance estimates. This allows us, to first approximation to treat all used galaxy distances (velocity independent and the model-corrected) in a self-consistent manner, giving the confidence to the formed void galaxy sample.
However, for the future more accurate description of voids and galaxy distribution in the studied volume, one needs in more detailed models of peculiar velocities in the various subregions based on the TRGB-type distances. This step will require the substantial increase of mass TRGB distance determinations to the typical distances of 25–30 Mpc with the help of JWST and the ground-based giants E-ELT and TNT.
-
•
The HyperLEDA database for the subset of objects with the radial velocities of below a thousand km s-1 appeared to contain a substantial fraction of ’wrong’ entries (stars, stars projected close to a distant galaxy center, galaxies with unreliable redshifts, faint parts of brighter galaxies, QSOs, various artifacts) which contaminate the void galaxy sample. We carefully checked all doubtful cases and cleaned 354 such wrong entries from the intermediate sample of 1708 objects. The latter number left of the original galaxy sample (2075) cleaned from 319 galaxies, identified as the (distant) satellites of the luminous galaxies delineating the Nearby Voids, and 48 objects with low velocity accuracy. We do not exclude, however, that for the current sample of 1354 nearby void galaxies, a few entries remain non-recognized as wrong.
We describe the procedures to form a sample of 25 nearby voids as a set of detached complexes of several lumped empty spheres (with the full size of individual voids of 13–35 Mpc) delineated by ’luminous’ objects (galaxies and typical groups). Altogether, within these 25 voids we find 1354 galaxies with the number of galaxies per void from 4 to 129. One of the important applications of this sample can be tracing of the internal small-scale structure of voids to test the basic assumptions on the Dark Matter nature. Of all nearby void galaxies, 1088 reside deeply in the voids that makes them suitable to study the effect of void environments on galaxy formation and evolution.
Summarising the results and discussion above, we draw the following conclusions:
-
1.
We present the results of the nearby void identification in the close part of the Local Supercluster (at 25 Mpc). Total 25 voids with the major size from 13 up to 35 Mpc are separated and discussed in relation to the previous works.
-
2.
The sample of galaxies residing in these nearby voids is presented in two variants. The larger sample which includes all galaxies falling within the void boundaries, consists of 1354 objects. The subsample of inner void galaxies, intended to study possible evolutionary peculiarities, includes galaxies situated in the void interiors, with the distances to the nearest luminous galaxy 2.0 Mpc. It consists of 1088 objects.
-
3.
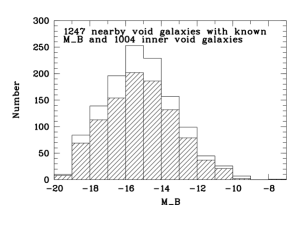
We present the preliminary statistical results for the Nearby Void Galaxy sample. The distribution of 1004 ’inner’ void sample with known -magnitudes has the median of and extends from down to . The absolute majority of void dwarfs are irregular galaxies and late-type spirals. However, per cent of the void sample are of early types: dE/E-S0 galaxies with the wide range of . Most of them are well isolated, and thus can represent an unusual sub-type of field/void early-type galaxies.
-
4.
The new large sample of galaxies residing in the nearest voids opens the good perspective of systematical studies of galaxy formation and evolution as well as of the properties of voids themselves. These include the following directions: 1) search for and study of the lowest mass void dwarfs, including candidates to the so-called Very Young Galaxies; 2) study the origin and evolution of early-type galaxies in voids; 3) search for appearance of cold accretion as a driving mechanism of galaxy evolution; 4) study of void small-scale structure as a probe of the possible role of Warm Dark Matter in its formation, 5) study the void galaxy motions from their void centers, as a mean to determine void global properties, and several others.
Acknowledgements
The authors are pleased to acknowledge the support of this work through the Russian Science Foundation grant No. 14-12-00965. We thank I.D. Karachentsev who read the manuscript and made valuable suggestions. The authors are grateful to the anonimous referee for useful questions and suggestions which helped to improve the paper content. The usage of the HyperLEDA database 333http://leda.univ-lyon1.fr as the main source of the initial sample selection and an instrument for data checks is greatly acknowledged. This research has made use of the NASA/IPAC Extragalactic Database (NED) which is operated by the Jet Propulsion Laboratory, California Institute of Technology, under contract with the National Aeronautics and Space Administration. We also acknowledge the use of both the spectral and photomenric data from the SDSS. Funding for the Sloan Digital Sky Survey IV has been provided by the Alfred P. Sloan Foundation, the U.S. Department of Energy Office of Science, and the Participating Institutions. SDSS acknowledges support and resources from the Center for High-Performance Computing at the University of Utah. The SDSS web site is www.sdss.org. SDSS is managed by the Astrophysical Research Consortium for the Participating Institutions of the SDSS Collaboration.
References
- Abazajian et al. (2009) Abazajian K.N., Adelman-McCarthy J.K., Agüeros M.A. et al., 2009, ApJS, 182, 543
- Angulo, Hahn, Abel (2013) Angulo R.E., Hahn O., & Abel T., 2013, MNRAS, 434, 3337
- Aragon-Calvo & Szalay (2013) Aragon-Calvo M.A. & Szalay A.S., 2013, MNRAS, 428, 3409
- Ashley, Marcum, & Fanelli (2017) Ashley T., Marcum P.M., & Fanelli M.L., 2017, AJ, 153, 158
- Beigu et al. (2013) Beygu B., Kreckel K., van de Weygaert R., van der Hulst J.M., van Gorkom J.H., 2013, AJ, 145, 120
- Beigu et al. (2017) Beygu B., Peletier R.F., van der Hulst J.M., Jarrett T.H., Kreckel K., van de Weygaert R., van Gorkom J.H., Aragon-Calvo M.A., 2017, MNRAS, 464, 666
- Bradford et al. (2015) Bradford J.D., Geha M.C., Blanton M.R., 2015, ApJ, 809, 146
- Brown et al. (2015) Brown W.R., Anderson J., Gnedin O.Y., Bond H.E., Geller M.J., Kenyon S.J., 2015, ApJ, 804, 49
- Chengalur, Pustilnik (2013) Chengalur J.N., Pustilnik S.A., 2013, MNRAS, 428, 1579
- Chengalur, Pustilnik, Egorova (2017) Chengalur J.N., Pustilnik S.A., Egorova E.S., 2017, MNRAS, 465, 2342
- Colberg et al. (2005) Colberg J.M., Sheth R.K., Diaferio A., Gao L., Yoshida N., 2005, MNRAS, 360, 216
- Colberg et al. (2008) Colberg J.M., Pearce F., Foster C., et al. 2008, MNRAS, 387, 993
- Colless et al. (2003) Colless M., Peterson B., Jackson C., et al. 2003, arXiv:0306581 (http://www.mso.anu.edu.au/2dFGRS)
- Dawson et al. (2016) Dawson K.S., Kneib J.-P., Percival W.J., et al., 2016, AJ, 151, 44
- Ekta et al. (2008) Ekta, Chengalur J.N., Pustilnik S.A., 2008, MNRAS, 391, 881
- Elyiv et al. (2013) Elyiv A.A., Karachentsev I.D., Karachentseva V.E., Melnyk O.V., Makarov D.I., 2013, Astropysical Bulletin, 68, 1 (arXiv:1302.2369)
- Fairall (1998) Fairall A., 1998, Large-Scale Structures in the Universe, Wiley-Praxis, 196 pp.
- Flewelling et al. (2016) Flewelling H.A., Magnier E.A., Chambers K.C. et al., 2016, arXiv:1612.05243v2 (submitted to ApJ)
- Fliri & Trujillio (2016) Fliri J., Trujillio I., 2016, MNRAS, 456, 1359
- Goldberg & Vogeley (2004) Goldberg D.M., Vogeley M.S., 2004, ApJ, 605, 1
- Gottlöber et al. (2003) Gottlöber S., Lokas E.L., Klypin A., Hoffman Y., 2003, MNRAS, 344, 715
- Grogin, Geller (1999) Grogin N.A., Geller M.J., 1999, AJ, 118, 2561
- Grossi et al. (2009) Grossi M., di Serego Alighieri S., Giovanardi C., Gavazzi G., et al. 2009, A&A, 498, 407
- Hahn et al. (2006) Hahn O., Porciani C., Carollo C.M., Dekel A., 2006, MNRAS, 375, 489
- Hahn et al. (2007) Hahn O., Carollo C.M., Porciani C., Dekel A., 2007, MNRAS, 381, 41
- Hahn et al. (2009) Hahn O., Porciani C., Dekel A., Carollo C.M., 2009, MNRAS, accepted (arXiv:0803.4211v2)
- Haynes et al. (2018) Haynes M.P., Giovanelli R., Kent B., et al., 2018, arXiv:1805.11499
- Hidding et al. (2016) Hidding J., van de Weygaert R., Shandarin S., The Zeldovich Universe: Genesis and Growth of the Cosmic Web, 2016, Proceedings of IAU, IAU Symposium, V.308, pp.69–76
- Hill et al. (2010) Hill D.T., Driver S.P., Cameron E., Cross N., Liske J., Robotham A., 2010, MNRAS, 404, 1215
- Hirschauer et al. (2016) Hirschauer A.S., Salzer J.J., Skillman E.D., et al. 2016, ApJ, 822, 108
- Hoeft et al. (2006) Hoeft M., Yepes G., Gottlöber S., Springel V., 2006, MNRAS, 371, 401
- Hoyle et al. (2005) Hoyle F., Rojas R.R., Vogeley M.S., Brinkmann J., 2005, ApJ, 600, 6018
- Hoyle et al. (2015) Hoyle F., Vogeley M.S., Pan D., 2015, MNRAS, 426, 3041
- Icke, van de Weygaert (1987) Icke V., van de Weygaert R., 1987, A&A, 184, 16
- Icke, van de Weygaert (1991) Icke V., van de Weygaert R., 1991, QJRAS, 32, 85
- Izotov et al. (2012) Izotov Y.I, Thuan T.X., Guseva N.G., 2012, A&A, 546, 122
- Izotov et al. (2018) Izotov Y.I, Thuan T.X., Guseva N.G., Liss S.E., 2018, MNRAS, 473, 1956
- Karachentsev (2005) Karachentsev I.D., 2005, AJ, 129, 178
- Karachentsev et al. (2016) Karachentsev I.D., Chengalur J.N., Tully R.B., Makarova L.N., Sharina M.E., Begum A., Rizzi L., 2016, AN, 337, 306
- Karachentsev et al. (2018) Karachentsev I.D., Makarova L.N., Tully R.B., Rizzi L., Shaya E., 2018, ApJ, 858, 62
- Karachentsev et al. (1996) Karachentsev I.D., Makarov D.I., 1996, AJ, 111, 794
- Karachentsev et al. (2008) Karachentsev I.D., Makarov D.I., 2008, Astrophys. Bull., 63, 299
- Karachentsev et al. (2013) Karachentsev I.D., Makarov D.I., Kaisina E.I., 2013, AJ, 145, 101
- Karachentsev, Nasonova & Courtois (2013) Karachentsev I.D., Nasonova O.G., & Courtois H., 2013, MNRAS, 429, 2264
- Karachentsev et al. (2011) Karachentsev I.D., Makarov D.I., Karachentseva V.E., Melnyk O.V., 2011, Astrophys. Bull., 65, 1
- Karachentsev & Nasonova (2010) Karachentsev I.D., Nasonova O.G., 2010, MNRAS, 405, 1075 The observed infall of galaxies towards the Virgo cluster
- Karachentsev et al. (2015a) Karachentsev I.D., Tully R.B., Makarova L.N., Makarov D.I., Rizzi L., 2015a, ApJ, 805, 144
- Karachentsev et al. (2015b) Karachentsev I.D., Kniazev A.Y., Sharina M.E., 2015b, AN, 336, 707
- Kniazev, Egorova, Pustilnik (2018) Kniazev A.Y., Egorova E.S., Pustilnik S.A., 2018, MNRAS, 479, 3842
- Kreckel et al. (2011) Kreckel K., Platen E., Aragon-Calvo M.A., et al. 2011, AJ, 141, 4
- Kreckel et al. (2012) Kreckel K., Platen E., Aragon-Calvo M.A., van Gorkom J.H., van de Weygaert R., van der Hulst J.M., Beygu B., 2012, AJ, 144, 16
- Lindner et al. (1996) Lindner U., Einasto M., Einasto J., et al. 1996, A&A, 314, 1
-
Lupton et al. (2005)
Lupton R., et al. 2005,
http://www.sdss.org/dr5/algorithms
/sdssUBVRITransform.html#Lupton2005 - Makarov & Karachentsev (2009) Makarov D.I., Karachentsev I.D., 2009, Astrophys. Bull., 64, 24
- Makarov & Karachentsev (2011) Makarov D.I., Karachentsev I.D., 2011, MNRAS, 412, 2498
- Makarov et al. (2014) Makarov D.I., Prugniel P., Terekhova N., Courtois H., Vauglin I., 2014, A&A, 570, A13
- Marchetti et al. (2018) Marchetti T., Contigiani O., Rossi E.M., Albert J.G., Brown A.G.A., Sesana A., 2018, MNRAS, 476, 4697
- Matsuda, Shima (1984) Matsuda T., Shima E., 1984, Prog. Theor. Phys., 71, 855
- McIntyre (2015) McIntyre T.P., Henning P.A., Minchin R.F., Momjian E., Butcher Z., 2015, AJ, 150, 28
- Moorman et al. (2015) Moorman C.M., Prada F., Vogeley M.S., Hoyle F., Pan D.C., Haynes M., Giovanelli R., 2015, ApJ, 810, 108
- Moorman et al. (2016) Moorman C.M., Moreno J., White A., Vogeley M.S., Hoyle F., Haynes M., Giovanelli R., 2016, ApJ, 831, 118 (arXiv:1601.04092) On the Star Formation Properties of Void Galaxies 2016ApJ…831..118M
- Montero-Dorta, Prada (2009) Montero-Dorta A.D., Prada F., 2009, MNRAS, 339, 1106 The SDSS DR6 luminosity functions of galaxies
- Nasonova & Karachentsev (2011) Nasonova O.G., & Karachentsev I.D., 2011, Astrophysics, 54, 1
- Nasonova, de Freitas Pacheco, & Karachentsev (2010) Nasonova O.G., de Freitas Pacheco J.A., & Karachentsev I.D., 2011, A&A, 532, A104
- Pan et al (2012) Pan D.C., Vogeley M.S., Hoyle F., Choi Y.-Y., Park C., 2012, MNRAS, 421, 926
- Patiri et al. (2006) Patiri S.G., Prada F., Holtzman J., Klypin A., Betancort-Rijo J., 2006, MNRAS, 372, 1710
- Perepelitsyna et al. (2014) Perepelitsyna Y.A., Pustilnik S.A., Kniazev A.Y., 2014, Astrophys. Bull., 69, 247 (arXiv:1408.0613)
- Prada et al. (2003) Prada F., Vitvitska M., Klypin A., et al., 2003, ApJ, 598, 260
- Pustilnik & Tepliakova (2011) Pustilnik S.A., Tepliakova A.L., 2011, MNRAS, 415, 1188
- Pustilnik & Martin (2016) Pustilnik S.A., Martin J.-M., 2016, A&A, 596, A86
- Pustilnik et al. (2005) Pustilnik S.A., Kniazev A.Y., Pramskij A.G., 2005, A&A, 443, 91
- Pustilnik et al. (2008) Pustilnik S.A., Tepliakova A.L., Kniazev A.Y., Burenkov A.N., 2008, Astrophys. Bull., 63, 102 (arXiv:0712.4205)
- Pustilnik et al. (2010) Pustilnik S.A., Tepliakova A.L., Kniazev A.Y., Martin J.-M., Burenkov A.N., 2010, MNRAS, 401, 333
- Pustilnik, Tepliakova & Kniazev (2011a) Pustilnik S.A., Tepliakova A.L., Kniazev A.Y., 2011, Astrophys. Bull., 66, 255 (arXiv:1108.4850)
- Pustilnik et al. (2011b) Pustilnik S.A., Martin J.-M., Tepliakova A.L., Kniazev A.Y., 2011, MNRAS, 417, 1335
- Pustilnik et al. (2013) Pustilnik S.A., Martin J.-M., Lyamina Y.A., Kniazev A.Y., 2013, MNRAS, 432, 2224
- Pustilnik et al. (2016) Pustilnik S.A., Perepelitsyna Y.A., Kniazev A.Y., 2016, MNRAS, 463, 670
- Rieder et al. (2013) Rieder S., van de Weygaert R., Cautun M., Beygu B., Portegies Zwart S., 2013, MNRAS, 435, 222
- Rieder et al. (2016) Rieder S., van de Weygaert R., Cautun M., Beygu B., Portegies Zwart S., 2016, The Zeldovich Universe: Genesis and Growth of the Cosmic Web, Proc. of the IAU, IAU Symposium, Volume 308, pp. 575-579
- Rizzi et al. (2017) Rizzi L., Tully R.B., Shaya E.J., Kourkchi E., Karachentsev I.D., 2017, ApJ, 835, 78
- Rojas et al. (2004) Rojas R.R., Vogeley M.S., Hoyle F., Brinkmann J., 2004, ApJ, 617, 50
- Rojas et al. (2005) Rojas R.R., Vogeley M.S., Hoyle F., Brinkmann J., 2005, ApJ, 624, 571
- Salzer (1992) Salzer J.J., 1992, AJ, 103, 385
- Salzer et al. (1991) Salzer J.J., di Serego Alighieri S., Matteucci F., Giovanelli R., Haynes M.P., 1991, AJ, 101, 1258
- Schlafly & Finkbeiner (2011) Schlafly E.F., Finkbeiner D.P., 2011, ApJ, 737, a.i. 103
- Sheth & van de Weygaert (2004) Sheth R.K., van de Weygaert R., 2004, MNRAS, 350, 517
- Skrutskie et al. (2006) Skrutskie M.F., Cutri R.M., Stiening R., et al., 2006, AJ, 131, 1163
- Sorgho et al. (2018) Sorgho A., Carignan C., Pisano D.J., et al., 2018MNRAS.tmp.2656S
- (89) Sorrentino G., Antonuccio-Delogu V., Rifatto A., 2006, A&A, 460, 673
- Staveley-Smith et al. (2016) Staveley-Smith L., Kraan-Korteweg R.C., Schr’́oder A.C., Koribalski B.S., Stewart I.M., Heald G., 2016, AJ, 151, article id. 52
- Stierwalt et al. (2009) Stierwalt S., Haynes M.P., Giovanelli R., Kent B.R., Martin A.M., Saintonge A., Karachentsev I.D., Karachentseva V.E., 2009, AJ, 138, 338
- Tikhonov, Karachentsev (2006) Tikhonov A.V., Karachentsev I.D., 2006, ApJ, 653, 969
- Tikhonov et al. (2009) Tikhonov A.V., Gottlober S., Yepes G., Hoffman Y.; 2009, MNRAS, 399, 1611
- Tully et al. (2008) Tully R.B., Shaya E.J., Karachentsev I.D., Courtois H.M., Kocevski D.D., Rizzi L., Peel A., 2008, ApJ, 676, 184
- Tully et al. (2009) Tully R.B., Rizzi L., Shaya E.J., Courtois H.M., Makarov D.I., Jacobs B.A., 2009, AJ, 138, 323
- Tweed et al. (2018) Tweed D.P., Mamon G.A., Thuan T.X., Cattaneo A., Dekel A., Menci N., Calura F., Silk J., 2018, MNRAS, accepted (arXiv:1802.09530)
- van de Weygaert (2016) van de Weygaert R., The Zeldovich Universe: Genesis and Growth of the Cosmic Web, Proceedings of IAU, 2016, IAU Symposium, V.308, pp.493–523
- van de Weygaert, Icke (1989) van de Weygaert R., Icke V., 1989, A&A, 213, 1
- van der Weygaert et al. (2009) van de Weygaert R., Platen E., Tigrak E., Hidding J., van der Hulst J.M., Aragón-Calvo M.A., Stanonik K., van Gorkom J.H., 2009, in ASP Conf.Ser., 421, 99
- Yang et al. (2015) Yang L.F., Neyrinck M.C., Aragon-Calvo M.A., Falck B., Silk J., 2015, MNRAS, 451, 3606
- Zibetti, Charlot, Rix (2009) Zibetti S., Charlot S., and Rix H.-W., 2009, MNRAS, 400, 1181
Appendix A On-line data for electronic version
A.1 Tables of the Nearby Void Galaxy catalog, ’inner’ and ’outer’ parts
Here we present the compilation of main parameters for the whole Nearby Void Galaxy sample divided into Table A1 and A2 with inner and outer subsamples, respectively. They both have the structure as described in Subsection 4.2. Table A1 containes 1088 inner void galaxies with Notes in the bottom of the table for part of individual galaxies, mainly devoted to galaxy clustering with other void galaxies. Table A2 containes 266 outer void galaxies with similar Notes in the bottom.
A.2 3D views of the Nearby Voids from Table 1.
In Figures A1–A6 of the Appendix we present 3D views in supergalactic coordinates of all 25 voids from Table 2 in cubes with the side length of 50 Mpc, which includes the adopted main sphere with Mpc. These views allow one to get the first impression of the void sizes and positions relative to the Local Sheet, concentrated to the plane.
A.3 Finding charts of the Nearby Void Galaxy catalog, the ’inner’ and ’outer’ parts
We present the finding charts of the Nearby Void Galaxy sample in four mosaics. Figures A7–A65 are for finding charts of galaxies of the ’inner’ part (1088 objects with 2.0 Mpc) divided into those falling within the SDSS footprint sky regions (487 objects, Figures A7–A25) and the remaining 601 ’inner’ galaxies residing outside the SDSS zone (Figures A26–A65), for which we use digitized DSS1/DSS2 images.
Two more categories relate to the ’outer’ void galaxies (266 objects with 2.0 Mpc). Figures A66–A70 show 110 galaxies falling in the SDSS footprint, while Figures A71–A81 show the finding charts of the remaining 156 ’outer’ objects similar to the ’inner’ sample.