Constraints on the Hi Mass for NGC 1052–DF2
Abstract
We report deep, single-dish 21 cm observations of NGC 1052–DF2, taken with the Green Bank Telescope. NGC 1052–DF2, proposed to be lacking in dark matter, is currently classified as an ultra-diffuse galaxy in the NGC 1052 group. We do not detect the galaxy, and derive an upper limit on the Hi mass. The galaxy is extremely gas-poor, and we find that a detection at a distance of 19 Mpc and using a line width of 3.2 km would have an upper limit of . At this mass limit, the gas fraction of neutral gas mass to stellar mass is extremely low, at /. This extremely low gas fraction, comparable to Galactic dwarf spheroidals and gas-poor dwarf ellipticals, implies that either the galaxy is within the virial radius of NGC 1052, where its gas has been stripped due to its proximity to the central galaxy, or that NGC 1052–DF2 is at distance large enough to inhibit detection of its gas. We also estimated the upper limit of the Hi mass of NGC 1052–DF2 resided at 13 Mpc. This would give an Hi mass of , and an Hi gas fraction of /, becoming even more extreme. While the dark matter fraction would be less extreme at this distance, the neutral gas fraction would be unprecedented for an object in a low density environment.
Subject headings:
galaxies: evolution – galaxies: structure – galaxies: ultra diffuse – galaxies: dwarf1. Introduction
The extremely low surface brightness galaxy NGC 1052–DF2 was discovered by Karachentsev et al. (2000), who labeled it a dwarf galaxy candidate. van Dokkum et al. (2018b) measured the total mass of the galaxy by measuring the radial velocities of ten luminous globular clusters. Using the inferred velocity dispersion, van Dokkum et al. (2018b) determined the total mass within a 7.6 kpc radius to be less than . These globular clusters trace the mass profile of NGC 1052–DF2 out to radii nearly as large as the virial radius of the galaxy ( kpc). The dark matter halo mass can be estimated using the dark matter halo mass/stellar mass ratio , where the expected ratio for low mass galaxies like NGC 1052–DF2 is greater than 30 (Moster et al. (2010); Behroozi et al. (2013)). Comparing the estimated total mass with the derived stellar mass of the galaxy, which van Dokkum et al. (2018b) determined to be , they obtain a of order one. Thus, they propose that the galaxy is deficient in dark matter.
If NGC 1052–DF2 is truly a galaxy lacking dark matter, the question of how dark matter is separated from baryonic matter remains. Clowe et al. (2006) showed that dark matter can be dissociated from galaxies if dark matter is bound to baryons through nothing but gravity. However, until now, previous attempts have not been fruitful in observing a galaxy without dark matter (Romanowsky et al., 2003; Peralta de Arriba et al., 2014).
Recently, Laporte et al. (2018) suggested a lack of robustness in the method used by van Dokkum et al. (2018b) to obtain the mass to light ratio, M/L, by using the globular clusters in NGC 1052–DF2. They show that similar methods applied to the well-studied Fornax dSph would give wildly different dark matter halo mass estimates with large scatter in the velocity dispersion at the 95% confidence level.
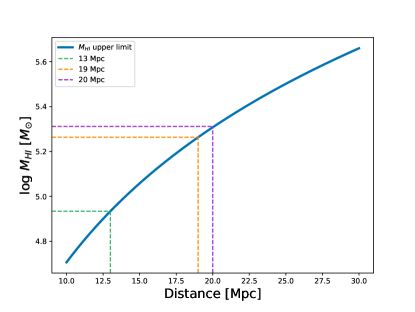
Trujillo et al. (2018) proposed that many of the unusual features of NGC 1052–DF2 may be explained if the galaxy, which van Dokkum et al. (2018b) estimates a distance of 19 Mpc, was brought to a distance of 13 Mpc, making it a typical low surface brightness galaxy without the anomalies described by van Dokkum et al. (2018b). van Dokkum et al. (2018a) address this distance concern by analyzing the color-magnitude diagram (CMD) of NGC 1052–DF2 and arrive at a distance consistent with the 19 Mpc estimate. They provide an additional distance estimate by applying a method free of calibration uncertainties and again arrive at the same 19 Mpc distance estimate. Blakeslee & Cantiello (2018) performed an independent analysis of the distance with similar conclusions of . In this paper, we provide the 21 cm neutral hydrogen (Hi) mass upper limit calculations using the 19 Mpc distance estimate.
Most recently, Chowdhury (2019) found upper limits on the Hi mass to be with 20 km/s resolution. Our observation with a single dish allowed us to go deeper, probing the extreme nature of this source, obtaining a more constrained upper limit.
This paper proceeds as follows. In Section 2 we describe the parameters of our observations using the GBT. In Section 3 we calculate the upper limits and describe our analysis of the data. In Section 4 we present our results, and we conclude in Section 5 with discussion of the significance of these results for NGC 1052–DF2.
2. Observations
| 111Velocity resolution | 222Measured rms noise | 333Integrated flux limit | M | |||
|---|---|---|---|---|---|---|
| (km/s) | (mJy/beam) | () | () | (/) | ||
| 3.2 | 0.673 | 0.006 |
We searched for 21 cm (1.42 GHz) Hi line emission from NGC 1052–DF2 using the Robert C. Byrd Green Bank Telescope (GBT) in August 2018 (project GBT18A-508). We used the L-band (1.15-1.73 GHz) receiver with the VErsatile GBT Astronomical Spectrometer (VEGAS) backend in spectral line mode. At these frequencies, the FWHM beamwidth is .
Using globular clusters in NGC 1052–DF2, van Dokkum et al. (2018) showed that the intrinsic velocity dispersion measured, was . Thus, we would expect the rotational velocity of NGC 1052–DF2 to be of the same order of magnitude. This requires a velocity resolution smaller than in order to measure an accurate Hi line profile. As a result, we aimed for a velocity resolution of in the source rest frame.
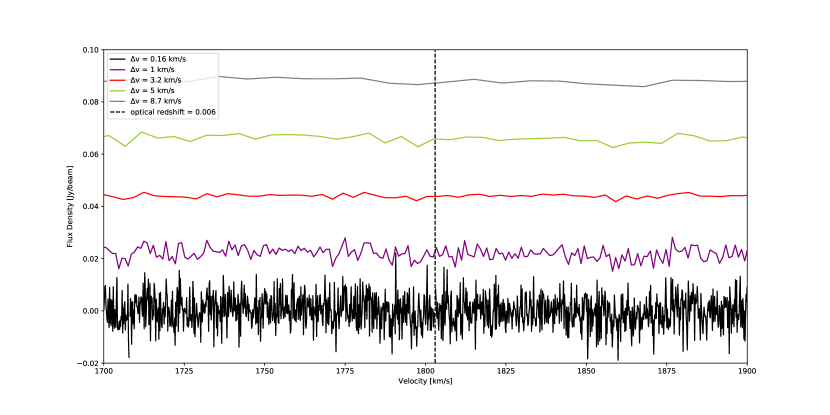
To achieve a sensitivity of with the observing setup described above, we tracked NGC 1052–DF2 for a total observing time of 4 hours and 15 minutes with the GBT. We observed over a bandwidth of 100 MHz and 131072 channels, resulting in the native resolution of 0.76 kHz, or 0.16 km/s. We searched over the bandwidth for Hi emission at a wide range of velocities (0-11000 km/s) with a focus on the range around 1803 km/s, corresponding to an optical redshift of z . We reduced the data using in GBTIDL and averaged and baselined each spectrum obtained. We followed this procedure by smoothing the averaged data to multiple velocity resolutions. These are displayed in Figure 1 where there is no obvious Hi signal detected.
We performed a search with the NASA/IPAC Extragalactic Database (NED222http://ned.ipac.caltech.edu/) using a search radius around NGC 1052–DF2, revealing no other likely sources of contamination at redshifts we can detect within the beam radius.
3. Results
We calculated our Hi flux upper limit using
| (1) |
where is the measured noise in Jy/beam, W is the expected line width in , and is the velocity resolution in . The flux upper limit is in units of Jy km .
The Hi mass of a source can be calculated using
| (2) |
where is the distance to the source in Mpc and is the integrated Hi flux over the source with units of Jy km .
We determined the upper limit of detectable Hi with the requirement of a detection using
| (3) |
We chose to use a line width W, consistent with that of the line widths from kinematic measurements of the globular cluster system within NGC 1052–DF2 in van Dokkum et al. (2018b) (), and smoothed our 0.16 km/s native resolution data to = 1, 3.2, 5, and 8 km/s, all within the range of errors in . Mass calculations in this paper are made using the 3.2 km/s resolution data, with the intent to increase our signal-to-noise ratio. We also present mass upper limits using line widths of and given in Emsellem et al. (2018) and Chowdhury (2019), respectively. Using the line width of , our calculated upper limit would become . A direct comparison to the limit found by Chowdhury (2019) would give us a limit of , a factor of better. We searched throughout our 100 MHz bandwidth at each smoothed resolution and did not detect a signal at any velocity. The noise in each spectra goes down as expected, by , where is the number of channels being smoothed.
For comparison, we include ratios of the Hi mass upper limit by the stellar mass , the total V-band luminosity , and the dynamical mass in Table 1.
4. Discussion and Conclusions
We have included a figure of our as a function of distance (Fig. 2), encompassing the three proposed distances mentioned in this paper (Trujillo et al., 2018; van Dokkum et al., 2018b; Blakeslee & Cantiello, 2018). All prove to be very gas-poor, with a factor of difference in Hi mass between the three distance estimates.
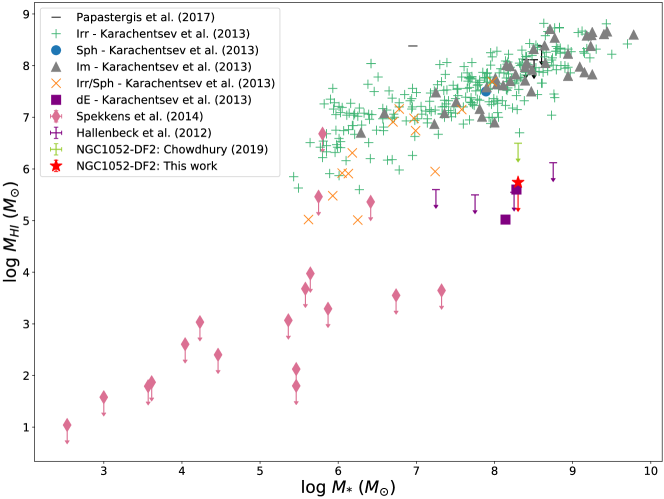
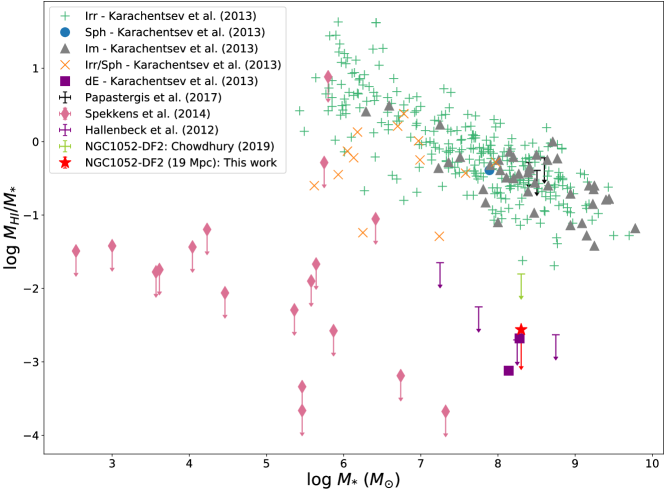
We calculate the upper limit on the for the distance of 19 Mpc (as proposed by van Dokkum et al. (2018b)). We also calculate our integrated flux limit using a detection limit, the Hi gas fraction, , the Hi mass to V-band luminosity , and the Hi mass to dynamical mass ratio , where values for , , and are all taken from van Dokkum et al. (2018b). All of these ratios are below , demonstrating the insignificance of the amount of neutral, atomic hydrogen in this galaxy. This new upper limit would bring the gas fraction ( ) down to that of the population of gas-poor dwarf ellipticals (Hallenbeck et al., 2012), as can be seen in Fig. 1. This limit demonstrates the highly gas-deficient nature of this galaxy.
Previous efforts have been made to detect neutral hydrogen in very low mass galaxies around the Milky Way using the Green Bank Telescope (GBT). These Galactic dwarf spheroidals (dSphs) have upper limits of (Spekkens et al., 2014), while neutral hydrogen detections have been made in other dSphs at comparable distances with the Parkes radio telescope (Tarchi et al., 2005). Our Hi mass to light ratio is of a similar value to that of the dwarf spheroidal galaxies associated with the Milky Way and the Local Group (Spekkens et al., 2014). However, our Hi mass to dynamical mass ratio is higher than that of those same Galactic dSphs by orders of magnitude, but is on par with the Local Volume dwarfs, with a distinction between these two groups being within (Galactic dSphs) or beyond (Local Volume dwarfs) the virial radius of the Milky Way.
The amount of gas found in a galaxy is greatly connected to its environment. An ultra-diffuse galaxy (UDG) in isolation should have a neutral gas mass of (Bellazzini et al., 2017; Papastergis et al., 2017). In groups, similar amounts of Hi mass have been found in UDGs (Trujillo et al., 2017; Spekkens & Karunakaran, 2018). There is an extreme lack of neutral gas in NGC 1052–DF2 as compared to other UDGs with Hi measurements.
We have considered the possibility that this source is an old tidal dwarf galaxy (TDG), collisional debris from a previous merger. These old TDGs should show both a lack of dark matter, and an unusually high metallicity for their mass, with large gas depletion time-scales (Braine et al., 2001; Hunter et al., 2000; Duc et al., 2007; Sweet et al., 2014). Given the less-than-solar metallicity and gas deficient nature of NGC 1052–DF2, we do not consider this to be a likely origin.
Our Hi mass upper limit, however, is consistent with the upper limits for dwarf ellipticals in the Virgo cluster found by Conselice et al. (2003), who reported Hi mass upper limits as low as . The gas fraction upper limit we found is also consistent with the gas fractions from dwarf ellipticals found by Hallenbeck et al. (2012). These similarities provide further support for NGC 1052–DF2 as a dwarf elliptical.
One likely scenario for the mechanism of gas removal in NGC 1052–DF2 is through gas stripping as a result of its proximity to NGC 1052 ( in projection). The location of the source residing within the central galaxy’s virial radius is an important factor in the amount of Hi found in a satellite (Grcevich & Putman (2009); Spekkens et al. (2014)). Because of the extended and loosely bound nature of Hi in galaxies, it is more likely to be stripped from its galaxy than the stars (Boselli & Gavazzi (2006); Poggianti et al. (2017)). The lack of Hi we find could be indicative of NGC 1052–DF2 residing within the virial radius of NGC 1052. It is possible that the Hi in NGC 1052–DF2 was not detected due to the source residing at some greater distance than NGC 1052. In this case, the gas removal mechanism could be through bursts of star formation or through gas expulsion (Hopkins et al., 2014). However, finding an isolated galaxy without Hi would be an unusual scenario and would require further explanation for its gas removal. The upper limit on the gas fraction and the upper limit on the ratio of Hi mass to dynamical mass could be consistent with either environmental scenarios of stripped gas by proximity to a larger galaxy or of a field galaxy with gas loss over time. While one scenario constrains the distance of NGC 1052–DF2, the other would prove to be an atypical finding of a galaxy without neutral gas when living in isolation. If there is any neutral gas present in NGC 1052–DF2, the insignificant amount would contribute extremely little to the baryonic mass of the galaxy.
We found the upper limit of Hi mass in NGC 1052–DF2 to be with a gas fraction of neutral gas to stellar mass of /. Such an extreme lack of neutral gas in this galaxy is consistent with known gas-poor dwarf ellipticals, dwarf spheroidals, and tidal dwarfs. Further inspection is needed to constrain the origin and morphology of this source.
5. ORCID iD
https://orcid.org/0000-0002-5783-145X
References
- Behroozi et al. (2013) Behroozi, P. S., Wechsler, R. H., & Conroy, C. 2013, ApJ, 770, 57
- Bellazzini et al. (2017) Bellazzini, M., Belokurov, V., Magrini, L., et al. 2017, MNRAS, 467, 3751
- Blakeslee & Cantiello (2018) Blakeslee, J. P., & Cantiello, M. 2018, Research Notes of the American Astronomical Society, 2, 146
- Boselli & Gavazzi (2006) Boselli, A., & Gavazzi, G. 2006, PASP, 118, 517
- Braine et al. (2001) Braine, J., Duc, P.-A., Lisenfeld, U., et al. 2001, A&A, 378, 51
- Chowdhury (2019) Chowdhury, A. 2019, MNRAS, 482, L99
- Clowe et al. (2006) Clowe, D., Bradač, M., Gonzalez, A. H., et al. 2006, ApJ, 648, L109
- Conselice et al. (2003) Conselice, C. J., O’Neil, K., Gallagher, J. S., & Wyse, R. F. G. 2003, ApJ, 591, 167
- Duc et al. (2007) Duc, P.-A., Braine, J., Lisenfeld, U., Brinks, E., & Boquien, M. 2007, A&A, 475, 187
- Emsellem et al. (2018) Emsellem, E., van der Burg, R. F. J., Fensch, J., et al. 2018, ArXiv e-prints, arXiv:1812.07345
- Grcevich & Putman (2009) Grcevich, J., & Putman, M. E. 2009, ApJ, 696, 385
- Hallenbeck et al. (2012) Hallenbeck, G., Papastergis, E., Huang, S., et al. 2012, AJ, 144, 87
- Hopkins et al. (2014) Hopkins, P. F., Kereš, D., Oñorbe, J., et al. 2014, MNRAS, 445, 581
- Hunter et al. (2000) Hunter, D. A., Hunsberger, S. D., & Roye, E. W. 2000, ApJ, 542, 137
- Karachentsev et al. (2000) Karachentsev, I. D., Karachentseva, V. E., Suchkov, A. A., & Grebel, E. K. 2000, A&AS, 145, 415
- Karachentsev et al. (2013) Karachentsev, I. D., Makarov, D. I., & Kaisina, E. I. 2013, AJ, 145, 101
- Laporte et al. (2018) Laporte, C. F. P., Agnello, A., & Navarro, J. F. 2018, ArXiv e-prints, arXiv:1804.04139
- Moster et al. (2010) Moster, B. P., Somerville, R. S., Maulbetsch, C., et al. 2010, ApJ, 710, 903
- Papastergis et al. (2017) Papastergis, E., Adams, E. A. K., & Romanowsky, A. J. 2017, A&A, 601, L10
- Peralta de Arriba et al. (2014) Peralta de Arriba, L., Balcells, M., Falcón-Barroso, J., & Trujillo, I. 2014, MNRAS, 440, 1634
- Poggianti et al. (2017) Poggianti, B. M., Moretti, A., Gullieuszik, M., et al. 2017, ApJ, 844, 48
- Romanowsky et al. (2003) Romanowsky, A. J., Douglas, N. G., Arnaboldi, M., et al. 2003, Science, 301, 1696
- Spekkens & Karunakaran (2018) Spekkens, K., & Karunakaran, A. 2018, ApJ, 855, 28
- Spekkens et al. (2014) Spekkens, K., Urbancic, N., Mason, B. S., Willman, B., & Aguirre, J. E. 2014, ApJ, 795, L5
- Sweet et al. (2014) Sweet, S. M., Drinkwater, M. J., Meurer, G., et al. 2014, ApJ, 782, 35
- Tarchi et al. (2005) Tarchi, A., Ott, J., Pasquali, A., et al. 2005, A&A, 444, 133
- Trujillo et al. (2017) Trujillo, I., Roman, J., Filho, M., & Sánchez Almeida, J. 2017, ApJ, 836, 191
- Trujillo et al. (2018) Trujillo, I., Beasley, M. A., Borlaff, A., et al. 2018, ArXiv e-prints, arXiv:1806.10141
- van Dokkum et al. (2018a) van Dokkum, P., Danieli, S., Cohen, Y., Romanowsky, A. J., & Conroy, C. 2018a, ApJ, 864, L18
- van Dokkum et al. (2018b) van Dokkum, P., Danieli, S., Cohen, Y., et al. 2018b, Nature, 555, 629