longtable
MPA network design based on graph theory and emergent properties of larval dispersal111© 2020. This manuscript version is made available under the CC-BY-NC-ND 4.0 license http://creativecommons.org/licenses/by-nc-nd/4.0/
Abstract
Despite the recognised effectiveness of networks of Marine Protected Areas (MPAs) as a biodiversity conservation instrument, nowadays MPA network design frequently disregards the importance of connectivity patterns. In the case of sedentary marine populations, connectivity stems not only from the stochastic nature of the physical environment that affects early-life stages dispersal, but also from the spawning stock attributes that affect the reproductive output (e.g., passive eggs and larvae) and its survivorship. Early-life stages are virtually impossible to track in the ocean. Therefore, numerical ocean current simulations coupled to egg and larval Lagrangian transport models remain the most common approach for the assessment of marine larval connectivity. Inferred larval connectivity may be different depending on the type of connectivity considered; consequently, the prioritisation of sites for marine populations’ conservation might also differ. Here, we introduce a framework for evaluating and designing MPA networks based on the identification of connectivity hotspots using graph theoretic analysis. We use as a case of study a network of open-access areas and MPAs, off Mallorca Island (Spain), and test its effectiveness for the protection of the painted comber Serranus scriba. Outputs from network analysis are used to: (1) identify critical areas for improving overall larval connectivity; (2) assess the impact of species’ biological parameters in network connectivity; and (3) explore alternative MPA configurations to improve average network connectivity. Results demonstrate the potential of graph theory to identify non-trivial egg/larval dispersal patterns and emerging collective properties of the MPA network which are relevant for increasing protection efficiency.
Running page head: Graph theory for designing MPA networks
Key words: Larval connectivity, MPA network, Larval dispersal, Larval transport, Management
Introduction
In ecology, connectivity concerns the exchange of individuals among populations and, thereby, the dispersal ability and the spatial and temporal scales over which a population of a given species is connected with other populations (Strathmann et al. 2002, Armsworth 2002). Most marine species have a pelagic early-life stage in which individuals (i.e., eggs, spores, larvae, juveniles) drift away from natal locations transported by ocean currents. For many species, these early life stages represent the most important, or even the only mechanism of dispersal (Walford 1938, Norcross & Shaw 1984). Although marine connectivity often refers only to a part of the “reproductive resilience” (Lowerre-Barbieri et al. 2016), it remains a key component of the system affecting the recruitment and, as a consequence, the long-term population dynamics and persistence (Travis & Dytham 1998, Siegel et al. 2003, Watson et al. 2012). As such, connectivity is of great interest for the management of marine ecosystems, and a key variable to consider in the scale, spacing and spatial structure of Marine Protected Areas (MPAs) (Lubchenco et al. 2003, Botsford et al. 2003, Fogarty & Botsford 2007, Botsford et al. 2009).
The identification of population connectivity patterns is, however, challenging since dispersal of early-life stages is highly influenced by the stochastic nature of the physical environment (Siegel et al. 2008) and by multiple biological factors affecting the reproductive output of the spawning stock biomass (SSB), like timing of spawning, egg physiology, Pelagic Larval Duration (PLD), larval behaviour, and/or larval mortality (Hinckley et al. 2001, Galarza et al. 2009, Ospina-Alvarez, Palomera, et al. 2012, Morgan 2014, Donahue et al. 2015, Ospina-Alvarez et al. 2018). While displacement routes of large-size organisms (i.e., adult fish) can be assessed using individual-tracking devices, planktonic individuals such as eggs and larvae are virtually impossible to track in the ocean (but see, Paris, Helgers, et al. 2013), notably limiting our ability to characterise their dispersal (Pineda 2000, Armsworth 2002, Siegel et al. 2003, Kinlan & Gaines 2003, Cowen et al. 2006, Cowen & Sponaugle 2009). This limitation has encouraged the use of a suite of indirect methods to reconstruct probable dispersal pathways, such as the analysis of geochemical signatures in calcified structures (Thorrold et al. 2007) and genetic structure assessments (Hedgecock et al. 2007). However, numerical ocean current simulations coupled to egg and larval Lagrangian transport algorithms (i.e., Individual Based Models IBMs) remain the most common approach for the assessment of marine larval connectivity (Werner et al. 2007, Catalán et al. 2013, Alós et al. 2014, Ospina-Alvarez et al. 2015, Blanco et al. 2019).
Larval connectivity derived from these IBMs can be interpreted using two measures: potential and realised larval connectivity (Watson et al. 2010). Potential larval connectivity refers to the probability of connection between a natal site or spawning area and a destination or nursery area. In contrast, realised larval connectivity refers to the number of larvae traveling from spawning to nursery sites (Watson et al. 2010). Realised larval connectivity can be estimated using potential connectivity weighted by relevant biological and environmental information (Kough & Paris 2015). For example, an estimate of realised connectivity can be obtained by weighting potential larval connectivity with observed or modelled spatial egg production (see review by Lowerre-Barbieri et al. 2016). These estimates can be improved by including biological aspects such as maternal effects (like body size), reproductive timing, spawning seasonality or individual spawning times (Hixon et al. 2014, Gwinn et al. 2015). Realised larval connectivity provides spatially explicit information on the ability of a set of sites to hold connected populations. Therefore, it can provide valuable information for the management of coastal resources (Ospina-Alvarez et al. 2020). However, it is rarely considered in the design of MPA networks (but see Watson et al. 2010).
The effectiveness of an MPA network critically depends upon the consideration of connectivity patterns, source-sink dynamics and rates of population replenishment (Botsford et al. 2008, 2009, Gaines et al. 2010, Lagabrielle et al. 2014). Therefore, connectivity values estimated trough IBM can provide insights into the design of MPA networks. However, conventional connectivity matrices generated by larval transport IBMs only provide a partial representation of the complexity of the connectivity and omit parts such as the identification of key locations that act as genetic corridors or central populations that feed many others. In this context, graph theory (i.e., the mathematical study of the interaction of a system of connected elements) is a valuable approach for analysing MPA network performance, as it provides a simplified and quantitative view of the multiple factors involved in the exchange among system elements (Conklin et al. 2018, Henry et al. 2018, Kininmonth et al. 2018, Friesen et al. 2019).
In graph theory, a system of connected elements can be defined as a "network", also called a "graph”. Network elements are modelled as “vertices” or “nodes” in the graph and their connections or links are represented as “edges” or “arcs”. In a network of marine reserves, the graph represents the network itself, with each area being a vertex or node, and the probability of connection or flow of individuals between areas being the arcs or edges (Dale & Fortin 2010). Graph theory provides insights into the system properties and identifies critical nodes with high centrality (i.e., connected to many other areas) or clusters of well-connected nodes with high potential genetic flow and acting as bridges between distant populations (Treml et al. 2008, Kininmonth et al. 2009, Jacobi & Jonsson 2011, Friesen et al. 2019). MPA network design based on connectivity studies and graph theory have increased in recent years (Treml et al. 2008, Kininmonth et al. 2018, Friesen et al. 2019). However, most studies fail to adopt an objective approach for selecting the most adequate centrality measures to identify important nodes in an MPA network. The difficulty lies in the fact that each node could be important from a different point of view depending on the definition of "importance". According to Freeman (1978): "There is certainly no unanimity on exactly what centrality is, or on its conceptual foundations, and there is little agreement on the appropriate procedure for its measurement”.
The methodological framework introduced in this study allows addressing several questions: 1) Does the importance of sites for population connectivity differ when demographic characteristics and available habitat are coupled to larval transport models? 2) Does the importance of sites for population connectivity differ when considering either a) the probability or flow of individuals and b) centrality measures from graph theoretic analyses? 3) Is it possible to design an MPA network that maximises net larval productivity, net larval supply and, simultaneously, avoids the fragmentation between sub-populations? For this purpose, we first analyse the potential and realised connectivity and the emergent properties of an ensemble of coastal species inhabiting an MPA network, where the respective sub-populations are potentially interconnected (e.g., in terms of dispersive/retentive associations between areas) through early-life stages (Basterretxea et al. 2012). As a novelty, our approach explores differences between the potential and realised networks and provides an ecological interpretation to the centrality measures analysed. This approach sets the baseline for a wider adoption of coupled connectivity-graph theory models in marine conservation and planning.
Methods
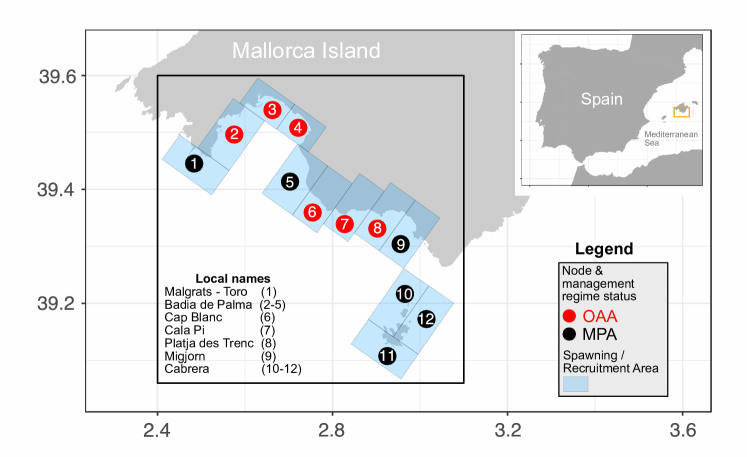
Our case-study refers to the south-eastern coast of Mallorca Island, in the Western Mediterranean Sea (Fig. 1). In this region, we identified 12 coastal sites (hereafter nodes) managed under two different regimes: MPA and OAA (Table 1, Fig. 1). Five MPAs protect the most important ecological assets of the island (e.g., well preserved seagrass meadows, rocky reefs), including the National Marine-Terrestrial Park of Cabrera (a fully no-take MPA for recreational fisheries since 1991). For this study, two small and nearby MPAs (Malgrats and Toro) have been considered as a single MPA. A complete description of environmental and hydrodynamic characteristics of the area can be found in Basterretxea et al. (2012).
| Node ID | Node name | Latitude Longitude | Manag. regime | Available habitat (sq. km) | Protected area of sea (sq. km) |
Fish size
mean – sd N |
Fish abundance (ind. sq. km habitat)
mean - sd |
| 1 | Malgrats - Toro | 39.445N 2.468E | MPA | 0.75 | 2.25 | 135 – 29.73 214 | 4531.36 – 2758.46 |
| 2 | Badia de Palma | 39.495N 2.574E | OAA | 9.74 | 124 – 27.68 467 | 96651.25 – 46475.54 | |
| 3 | Badia de Palma | 39.538N 2.658E | OAA | 8.08 | 124 – 30.64 279 | 68074.11 – 16431.04 | |
| 4 | Badia de Palma | 39.502N 2.720E | OAA | 18.12 | 121 – 29.76 607 | 152634.46 – 36841.35 | |
| 5 | Badia de Palma | 39.405N 2.701E | MPA | 9.24 | 23.94 | 144 – 24.95 135 | 111311.57 – 73869.36 |
| 6 | Cap Blanc | 39.358N 2.753E | OAA | 1.32 | 143 – 26.91 238 | 8215.92 – 5417.97 | |
| 7 | Cala Pi | 39.333N 2.823E | OAA | 5.76 | 119 – 25.56 84 | 64827.08 – 26730.27 | |
| 8 | Platja des Trenc | 39.328N 2.904E | OAA | 14.69 | 120 – 24.77 37 | 127115.42 – 100846.30 | |
| 9 | Migjorn | 39.308N 2.966E | MPA | 10.47 | 223.32 | 112 -27.36 63 | 96173.66 – 46896.00 |
| 10 | Cabrera | 39.198N 2.945E | MPA | 4.51 | 151 -27.72 354 | 71691.32 – 17304.12 | |
| 11 | Cabrera | 39.116N 2.914E | MPA | 0.98 | 86.8 | 164 -26.89 28 | 15518.97 – 3745.81 |
| 12 | Cabrera | 39.162N 3.010E | MPA | 3.3 | 163 -24.42 14 | 52523.67 – 12677.63 |
Hydrodynamic model
The coupled hydrodynamic-biological IBM used in this work has been previously described and validated (Basterretxea et al. 2012). Some outstanding features of the modelling approach include the simulation of the hydrodynamics around Mallorca Island using a three-dimensional density-resolving model, based on the Princeton Ocean Model (POM), with a resolution of 200 m in horizontal and 25 sigma layers in vertical from 2000 to 2009. The model was executed offline and included wind forcing using 12-hour maps for the same period.
Potential larval exchange matrix
A total 19 325 passive tracers were released at weekly intervals from 200 m equispaced grid points located over seagrass / rocky bottoms (<40 m depth) for a 6-month period (March– August) each year. The depth of release of the particles was random within the first 10 m of the water column. Particles were treated as passive, neutrally buoyant, flowing near the surface being freely transported by the currents for 21 days. A reflective boundary condition was used to prevent particles from moving onto land. At the end of this period the simulation was stopped. The final position (latitude, longitude and depth) of the passive tracers was used to determine their fate. Larvae within the 12 previously defined areas were assumed to successfully settle. A potential larval matrix was obtained representing the probability of connection between the 12 sites. This matrix can be associated to an ensemble of coastal fish species inhabiting the rocky, sand and seagrass meadows of the Mediterranean Sea; with summer spawning preferences; and a PLD of 21-days (Table S1).
Realised larval exchange matrix
The painted comber Serranus scriba was selected as model species for calculating the realised larval exchange matrix in this modelling approach because its breeding season spans from May to August in the Balearic Islands (Alonso-Fernández et al. 2011). Moreover, its dispersal is restricted to early-life stages (March et al. 2010) that are pelagic during ca. three weeks (Macpherson & Raventós 2006). Here, we have developed a total egg production model based on the individual, which incorporates valuable information of basic reproductive parameters of S. scriba, like size- and site-dependent fecundity or a long spawning season, as revealed by the empirical data (Alonso-Fernández et al. 2011, Alós et al. 2013, 2014). Potential fecundity (oocytes/ female), density (individuals m-2), proportion of females and proportion of mature females were used as proxies in the model to assess the total egg abundance (See Supplementary material for a detailed model explanation). The model output was used to calculate the realised larval exchange matrix by weighting the potential larval matrix with the spatial variability in egg abundance (oocytes m-2). In consequence, the egg abundance is a function of adult population abundance and reproductive characteristics, that are a function of the extent of available habitat (rocky and seagrass meadows down to 40 m depth) and the level of protection (MPA vs. OAA, see Table 1). Since information on vertical movements or the orientation of the larvae towards sound or light stimuli for the painted comber is non-existent, directed horizontal movement and the vertical movement of the larvae were not parameterised in the hydrodynamic simulations.
Matrices, graphs and networks as representations of connected systems
Any adjacency matrix can be represented as a graph with its nodes and edges and, consequently, they are equivalent representations of a connected system. Hereafter, we will refer to connected larval flow systems as larval connectivity networks. The potential larval exchange matrix, and its correspondent graph, represents the larval connectivity network of an ensemble of species with a common PLD (Table S1). The realised larval exchange matrix, and its correspondent graph, represents the larval connectivity network of the painted comber, as a model species. Although the visual representation of adjacency matrices on their own provides valuable information about the links within the entire network (i.e., probabilities or absolute numbers), the use of graph theory provides key information about the role of each node within a larval connectivity network (Fig S1, Minor and Urban 2008). To explore the potential of graph theory methods, we calculated centrality measures to understand the effect of the distinct levels of connectivity derived from potential and realised larval connectivity networks.
Road map for the selection of retention indices and centrality measures
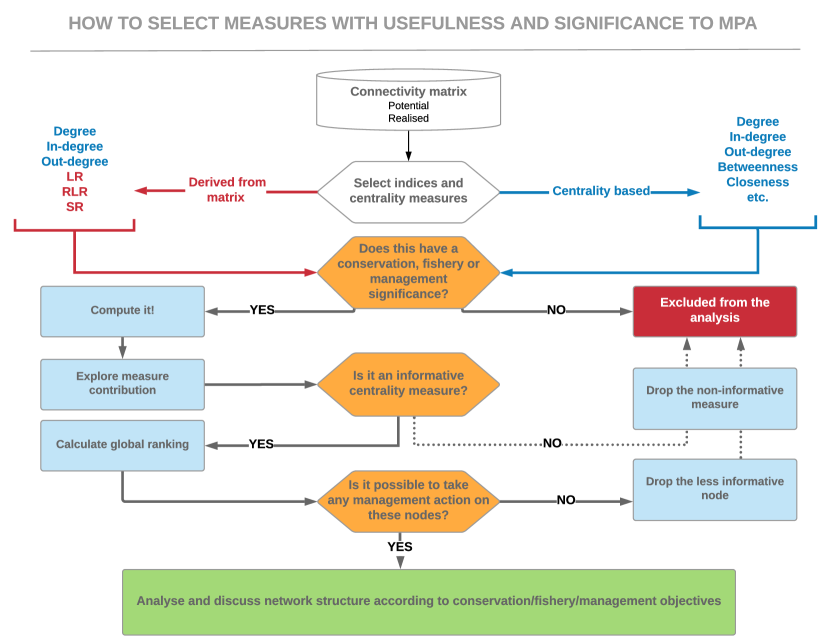
A road map was established for the selection of retention indices and centrality measures based on their usefulness and importance for conservation, recreational fisheries or management. This roadmap is summarized as follows (Fig 2):
-
1.
Obtain the larval connectivity network (e.g. by species, functional groups, etc.).
-
2.
Select the retention indices and centrality measures that can be calculated according to the characteristics of each connectivity network (e.g., strength can only be calculated in weighted networks, or closeness cannot be calculated in disconnected networks).
-
3.
Calculate indices and measures that may be relevant to conservation, recreational fisheries or management (see rationale column in Tables 2 y 3).
-
4.
Exploratory data analysis to assist decisions on which indices and measures are informative (e.g., summary statistics, correlation analysis, etc.).
-
5.
The indices and measures are normalised and the nodes (locations) of the network are ranked globally.
-
6.
Management decisions could be made, and management scenarios be designed according to the overall ranking of the nodes.
-
7.
The structure of the resulting connectivity network is analyzed and discussed according to the conservation, recreational fisheries or management objectives.
| Index | Definition | Calculation | Rationale |
| Local Retention (LR) | The ratio of locally produced settlement to local egg production. | LR is equal to the diagonal elements of the connectivity matrix. | LR does not depend on egg production in the different habitat patches, meaning it is independent of temporal changes in adult population size. |
| Relative Local Retention (RLR) | The ratio of locally produced settlement to all settlement of local origin. | RLR is equal to the diagonal elements of the connectivity matrix divided by the sum of the corresponding column of the connectivity matrix. | RLR does not depend on egg production, but it does depend on the connectivity between the focal patch and the ensemble of patches in the system. |
| Self-Recruitment (SR) | The ratio of locally produced settlement to settlement of all origins at a site. | If egg production is uniform over sites, then SR is equal to the diagonal elements of the connectivity matrix divided by the sum of the corresponding row of the connectivity matrix. If not, then the elements of the dispersal matrix must be weighted by the number of eggs produced. | SR depends on egg production in the different habitat patches (relative to that of the focal patch) and therefore on temporal changes in population size. SR also depends on connectivity between every patch and the focal patch. |
Retention indices and centrality measures
Following the roadmap (Fig. 2), 3 retention indices and 9 centrality measures were considered to have potential relevance to conservation, recreational fisheries or management. To capture hydrodynamic retention and, consequently, larval retention in our system, we calculated 3 different retention indices for the potential and realised larval connectivity networks following Lett et al. (2015): local retention (LR); relative local retention (RLR) and self-recruitment (SR). Retention indices are defined in Table 2 according Lett et al. (2015).
With the aim of highlighting the most important nodes for larval connectivity within the network, we calculated 9 measures of centrality for the potential and realised networks: In-strength; Out-strength; Strength; Betweenness, Eigenvector centrality; Closeness; Kleinberg’s hub centrality score (hereafter Hub score); Kleinberg’s authority centrality score (hereafter Authority score); and Page Rank. These centrality measures were selected as those potentially useful in larval connectivity studies and come from a first selection that included all existing measures of centrality, identified from a review of the existing literature. A full description of each centrality measure selected, their scope and ecological interpretation and references to the original source, is provided in Table 3. Note that Out-strength and In-strength correspond to the sum of all eggs released and larvae recruited from each node, respectively, and Strength correspond to the sum of In-strength and Out-strength. In consequence, these 3 centrality measures can be calculated either from a graph or directly from an adjacency matrix. Higher values in centrality measures indicate greater "connectivity" (sensu lato). Connectivity is not understood as larval connectivity but as connectivity between the nodes of the network. Therefore, each centrality measure informs of node connectivity properties within the network and provides different ecological interpretation of network connectivity. The selection and prioritisation of one measure over the other should be carefully considered depending on management and conservation local targets (Fig. 2, Table 3).
| measure | reference | definition | rationale |
| Strength | Barrat et al. 2004 | Also named weighted degree. The node degree is the number of relations (edges) of the nodes. In weighted networks, node Strength is the sum of weights of links connected to the node. | Strength indicates a node is involved in many important (by weight) interactions with other nodes. Nodes with high Strength can be acting as keystones since they are connected by egg production and recruitment to many neighbouring nodes. |
| In-strength | Barrat et al. 2004 | In directed networks, the In-strength is the sum of inward link weights. | Nodes with high In-strength can be acting as important nursery areas, sensitive recruitment or settlement zones. |
| Out-strength | Barrat et al. 2004 | In directed networks, the Out-strength is the sum of outward link weights. | Nodes with high Out-strength can be acting as essential spawning habitats. Genetically, sub-populations inhabiting nodes with high Out-strength have a high probability to spread genes to other sub-population in the network. |
| Closeness | Freeman 1979 | Closeness centrality indicates how long it will take for information from a given node to reach other nodes in the network. | Nodes with a higher Closeness have a high probability of exporting propagules to their nearest neighbouring nodes. |
| Betweenness | Freeman 1979 | Betweenness centrality is a measure of the influence of a node over the flow of information between every pair of nodes under the assumption that information primarily flows over the shortest paths between them. | While high release of propagules and high recruitment of larvae is important, it’s not everything. Nodes with high Betweenness centralities have been termed "bottlenecks" or "bridges" and they are preventing the fragmentation of the network. A node acting as a bridge between two well-differentiated subpopulations should have a high Betweenness. |
| Eigenvector centrality | Bonacich 1987 | The Eigenvector centrality network metric takes into consideration not only how many connections a node has (i.e., its Degree or Strength), but also the centrality of the vertices that it is connected to. | It is a measure of the influence of a node in a network. In general, a connection to a well-connected node is more important than a connection to a poor connected node. Nodes with high Eigenvector centralities mean high-productivity and high-recruitment nodes connected to other high-productivity, high-recruitment nodes. |
| Kleinberg’s hub centrality score (aka. Hub score) | Kleinberg 2000 | The Hub score of a node shows how many highly informative nodes or authoritative nodes this node is pointing to. | Nodes with high Hub scores mean nodes that recruit larvae from many other nodes in the network. Nodes that act as a nursery area very well-connected to other areas in the network. |
| Kleinberg’s authority centrality score (aka. Authority score) | Kleinberg 2000 | The Authority score of a node is a measure of the amount of valuable information that this node holds. | Nodes with high Authority scores mean nodes that export successful propagules to many other nodes in the network. Nodes that act as a well-connected source of propagules to other nodes in the network. |
| Page Rank | Brin and Page 1998 | Algorithm developed by Larry Page and Sergey Brin, founders of Google. Page Rank works by assigning importance to a webpage (node) if important pages (other nodes) point to it. | It is interpreted similarly to the hub score. The approximate estimation of the importance of a node is based on the number and quality (weight) of the links pointing to it. The most important nodes are likely to recruit more larvae from other nodes in the network. |
To facilitate the interpretation of the ranking of the nodes in a network, firstly, each index or centrality measurement was normalised between 0 and 1, with 1 corresponding to the highest connectivity value, and secondly, the nodes were sorted in a descending order, with those with the highest connectivity measures at the top. We also calculated edge Betweenness centrality, a measure of arc centrality, defined as the number of the shortest paths that go through an edge in a graph or network (Girvan & Newman 2002). An arc with a high edge Betweenness centrality score represents a bridging connector between two parts of a network, the removal of which can affect communication between many pairs of nodes through the shorter paths between them.
Following the roadmap described in section 2.5 (Fig. 2), indices and centrality measures were used to design a scenario where some open-access could be converted into no-take areas and vice versa. The biological parameters observed at Cabrera MPA (nodes 10 – 12) were used to scale-up egg production in the open-access areas to be converted to no-take. To convert no-take into “open to fisheries” areas, the average biological parameters of the open-access areas were used. The characteristics and structure of the network were explored and the impact of protection on larval network connectivity was discussed based on the decisions made.
Community detection
In graph theory, it is possible to identify groups of nodes (i.e., modules) that probably share common properties and/or play similar roles within the network. In networks where the distribution of links is globally and locally inhomogeneous, some nodes have higher concentration of links within special groups of nodes and low concentrations between these groups. Here, we have considered the approach to community detection using edge weights (i.e., connection probability or larval number, Brandes et al. 2008). When two or more network graphs are compared, the weight differences among pairs result in differences in cluster formation. Therefore, we quantified network modularity; the existence of groups of locations that are highly interconnected among themselves by proximity of links, and that are poorly connected to locations in other modules (Guimera & Nunes Amaral 2005, Reichardt & Bornholdt 2006). Then, we calculated the optimal community structure for the graph, in terms of maximal modularity score, to identify clustering organization and identify communities (following Brandes et al. 2008). The number of communities and membership of each node were used to visually display networks structure.
All analyses were performed using the R language and environment for statistical computing version 3.6.0, released 2019-04-26 (R Core Team 2019). Matrix, network graph and community detection analyses were performed using R packages “igraph” v.1.2.4.1 and “ConnMatTools” v.0.3.3 (Csardi & Nepusz 2006, Kaplan et al. 2017). Network visualisations were made with R packages: “mapdata” v.2.3.0; “ggplot2” v.3.2.1 and “ggraph” v.2.0.0 (Chang 2012, Wickham 2016).
Results
Retention and self-recruitment
The nodes ranked according to their relative retention indices for potential and realised larval connectivity and for the scenario networks are shown in Tables S2, S3 andS4. In the case of the LR index, where the sorting is based on absolute numbers and not on proportions, a slightly different ranking of the nodes in the potential and realised networks is observed, however nodes 3 and 4 are positioned as the most locally retentive in both networks (Fig. 3). These results are because nodes 3 and 4 are in the zone with the highest hydrodynamic retention and where egg production is also the highest for any node in the network. LR is sensitive to local patch (node) gamete production, but not to gamete production from all metapopulations (the whole network). Therefore, LR only provides information about local processes (i.e., node processes).
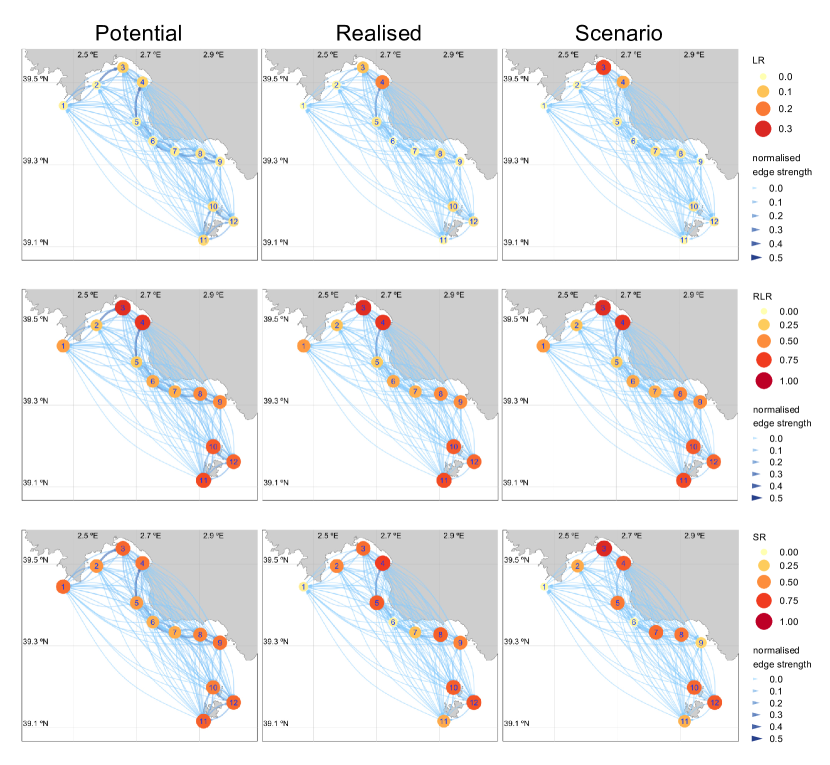
Nodes 3 and 4, located in the inner Palma Bay, show the highest RLR in both the potential and realised larval connectivity networks. Indeed, the same RLR node rank is obtained for these two networks since this index is relative to reproductive output of the whole network, and the results do not differ if either probabilities or measured demographic weights based of the species are used (Fig. 3).
SR, unlike RLR, is an index relative to the number of larvae arriving and not to the gamete production of each node. In a system where egg production is not uniform, and initial density is known, SR provides valuable information on the relative importance of each node in the larval connectivity system. The main SR differences between the potential and the realised networks are occurring in nodes 5, 10 and 12 that are ranked higher in the realised network whereas node 3 descends in the rank (Fig. 3).
Analysis of centrality measures
Out-strength, In-strength and Strength (the sum of the first two) are measures of centrality with a marked influence on larval retention. The nodes highlighted as important for these centrality measures are those with the highest values of self-connection (i.e., LR) in the potential and realised networks (Figs. 3 and S2).
Potential larval connectivity network
In the case of the potential larval connectivity network, nodes 3 and 4 were the most important nodes when considering the Out-strength, i.e., the release of propagules that reach some recruitment node. If self-loops (i.e., self-connections, LR) are not considered, the nodes with the highest probability of emitting successful propagules were 5 and 7. Nodes 3 and 4 were also highlighted as those with the highest probability of being successful nursery areas (Table S2, In-strength column and Fig. S2).
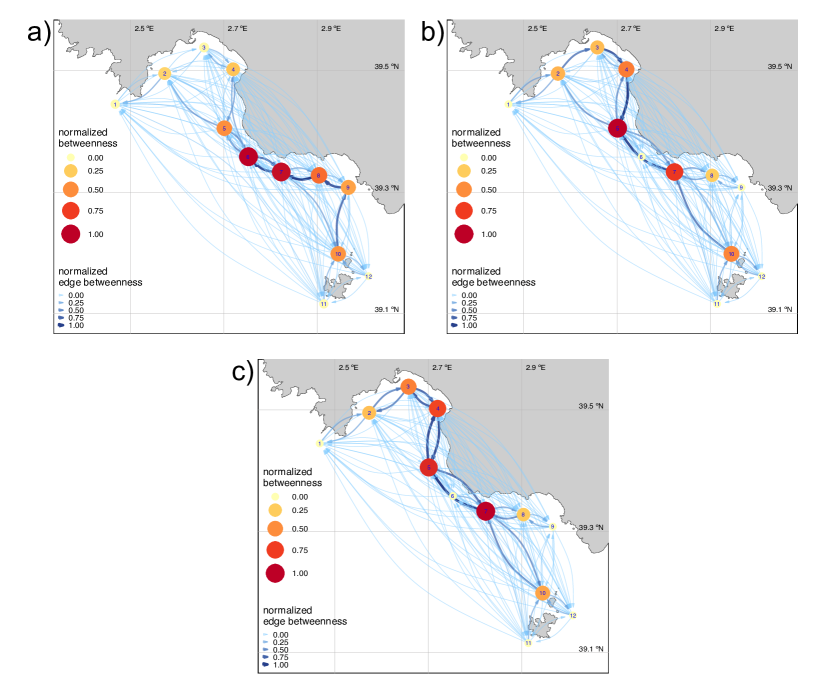
In a network, a high Closeness value indicates a higher probability of information propagation from one node to all other nodes in the network. In a larval connectivity network, this probability will be higher for those nodes that occupy areas of the network where hydrodynamics facilitates larval transport to all other nodes. Accordingly, in the potential larval connectivity network the nodes with highest Closeness were 6 and 7, followed by 5 (Fig. 4). There is a moderately high correlation between the Closeness and Betweenness measures (r , Fig. 5), and nodes 6 and 7 also exhibited the highest Betweenness indicating their importance as “bridges” between the nodes located north and south of their location (Fig. 6 and Table S2). The connections between the pair of nodes , , , and exhibited the highest edge Betweenness within the network. Excluding the self-loops, the strongest connections were , , and . These routes are the ones that concentrate the largest flow of larvae between the different nodes of the potential network. There is a strong inverse correlation between the Closeness and SR index (r , Fig. 5), which suggests that Closeness is a useful measure of centrality since it allows the identification of nodes that facilitate global connectivity in networks with a strong larval retention influence.
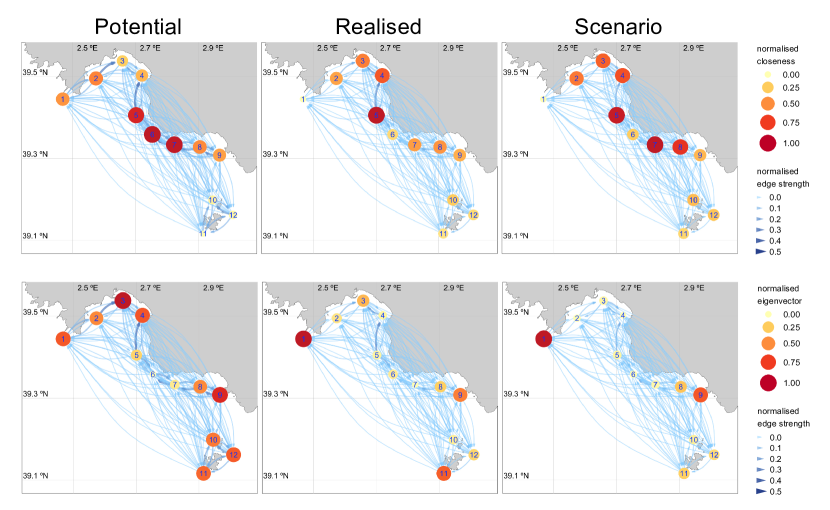
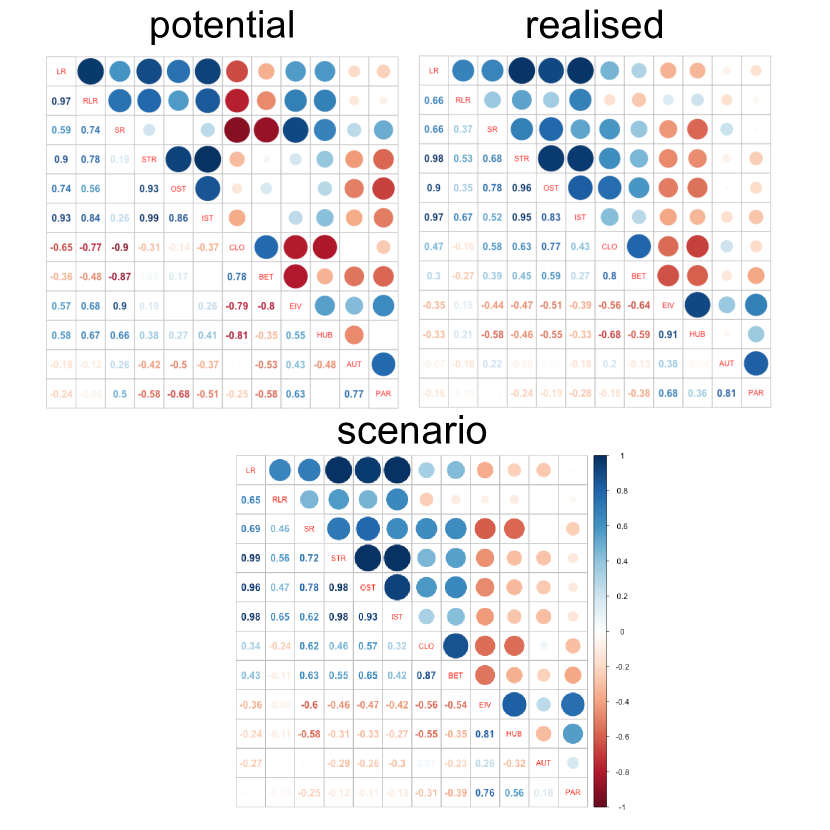
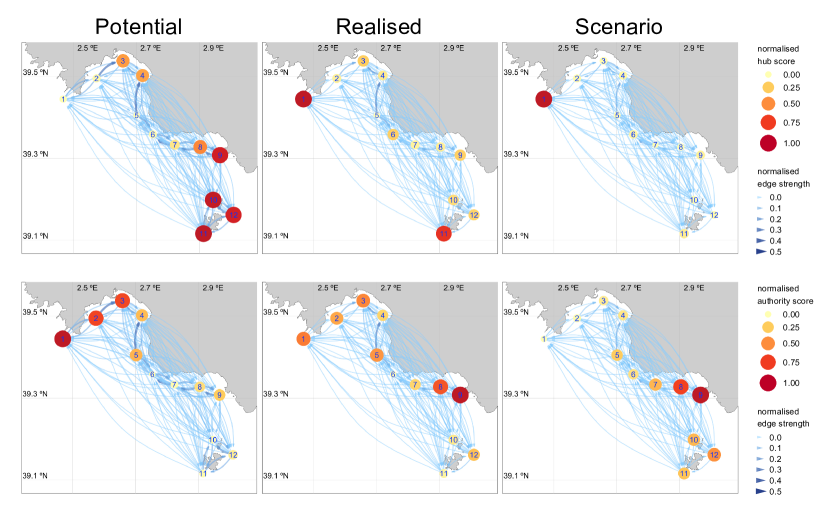
Continuing with the potential larval connectivity network, nodes with the highest Eigenvector, revealing the influence of a node in the network, were 3 and 9, which also had high SR values (Fig. 3). Indeed, there is a strong correlation between these two metrics (r , Fig. 5). Nodes 10, 11 and 12 had the highest Hub-score, while nodes 1, 2 and 3 had the highest Authority-score (Fig. 7). Nodes 1, 2 and 3 were also highlighted by Page Rank (Fig. S3). These four measures (Eigenvector, Hub and Authority score and Page Rank) could be useful to identify critical nodes in a connectivity network. For example, node 1, with low release and larval recruitment values, had a high Authority-score and Page Rank (Table S2). This suggests that although the weight of its connections to other nodes is low, these other nodes have the highest connections in the network.
Realised larval connectivity network
In the case of the realised larval connectivity network, node 4 held the highest Strength and In-strength coinciding with what was observed in the potential network (Tables S2 and S3 and Fig. S2). The node with the highest probability of emitting successful larvae was node 4 (5 if self-loops are not considered). According to Closeness, the incorporation of demographic information shifts the importance of nodes to those where more eggs are produced. Nodes 5, 4 and 3 had the highest Closeness, i.e., the highest potential for connecting their larvae to all the other nodes in the network (Fig. 4). Betweenness was partly correlated with Closeness centrality (r ). Regarding Betweenness, the most important nodes in this network were 5 and 7 (Fig. 6). Surprisingly, the node with the highest Betweenness in the potential network (node 6) had the lowest values in the realised network. In the realised network, the nodes with a high Betweenness are distributed both in the periphery and in the geographic centre of the network, indicating a higher cohesion between distant nodes in the network promoted by these "bridge" nodes. The connections between the pair of nodes , , , and exhibited the highest edge Betweenness within the network. The strongest connections, excluding self-loops, were , , , and . It is important to note that the high edge Betweenness of the 9-10 node pair in the potential network was not observed in the realised network, while node 10 formed a new bridge with node 7 (Fig. 6).
The four measures that highlight the importance of the nodes according to their relationship to other nodes in a network (i.e., Eigenvector, Hub and Authority score, and Page Rank) selected some of the same nodes as critical in both the potential and realised networks. Node 1 was the most important node in the realised network regarding Eigenvector, Hub-score and Page Rank, and it ranked high in Authority-score, after nodes 9 and 8 (Table S3, Fig. 4 and Fig. 7). There is an almost total coincidence in the classification of the nodes according to Page Rank for the two networks (potential and realised), indicating that this measure of centrality is not sensitive to the inclusion of demographic information, or that it is a measure relative to egg production (similar to RLR index).
Larval connectivity network in the simulated scenario
In order to test the influence of node protection on the network connectivity, we simulated a scenario where open-access nodes 3 and 7 are converted to no-take areas through the assignment of the biological parameters observed in Cabrera MPA nodes, 10-12. Otherwise, no-take nodes 1 and 9 are “open to fisheries” by the assignment of the average biological parameters observed in open access areas. We explored the structure of the network in this scenario and generally observed higher scores of LR, RLR and SR indices (Fig. 3) and of Strength, Out-strength and In-strength for nodes 3 and 7, and higher connectivity measures for node 7 (particularly Closeness and Betweenness; Figs. 4 and 6, Table S4). Otherwise, nodes 1 and 9 obtained similar scores. Overall, this scenario obtained an improved connectivity throughout the nodes of the realised larval connectivity network (e.g., see Authority score in Tables S3 and S4 and Fig. 7).
Community detection
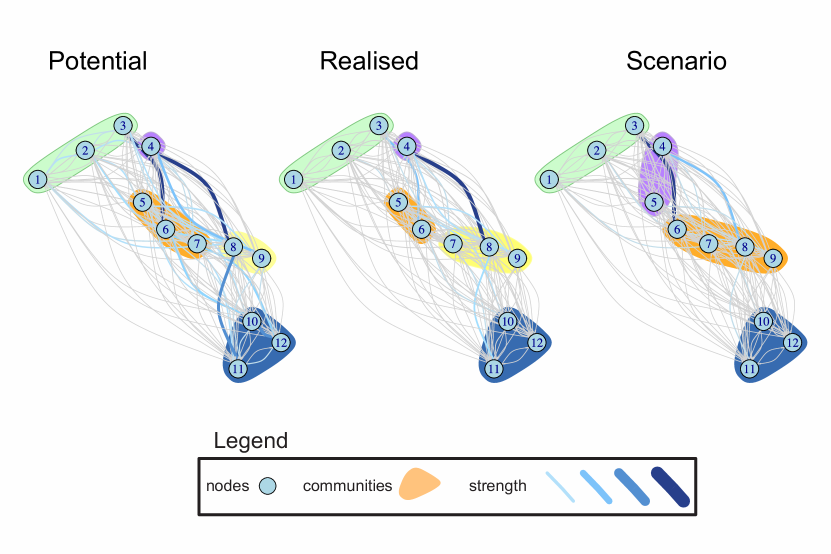
A total of 5 communities were detected in both the potential and realised larval connectivity networks, whereas only four communities were detected in the scenario network (Fig. 8). The community formed by nodes 1, 2 and 3 is persistent in all three networks, as is the community formed by nodes 10, 11 and 12. However, nodes 4 to 9 are shifting their community membership across the networks. Node 4, which remains isolated in the potential and realised networks, is forming a new community with node 5 in the simulated scenario.
Discussion
Larval transport is a key factor to consider in MPA network design. Optimal sites regarding larval connectivity metrics are not always easy to identify, particularly in complex scenarios constituted by intricate geographical settings, heterogeneous habitats, or where strong variations in physical ocean conditions occur. Our results show that, in these settings, the combination of larval connectivity patterns in complex marine systems and the network emergent properties (centrality measures) from graph theory may optimise decisions on design and management of MPA networks.
Graph theory allows spatially explicit representation of a complex inter-connected ecological system (Saunders et al. 2016) because different populations, represented as nodes, are connected by links that represent population connectivity pathways (Loro et al. 2015). As shown in the present study, measures like Betweenness and Closeness are good descriptors of MPA network properties, which is not explicit from traditional cartography. The adequacy of these measurements depends on the management or conservation targets and the resources to be managed. For example, when managing a network of reserves, often the objective is to maximise biological connectivity (Andrello et al. 2015), either by facilitating the mobility of adult organisms or by ensuring the departure, arrival and mobility between nodes of larvae or propagules (i.e., recruits). In this case, local flow patterns and the biological features of the organisms, including their PLD and reproductive behaviour, play a crucial role. In a broad sense, optimal sites for conservation should meet at least three basic conditions: a) enhanced larval production; b) increased larval recruitment; and c) high connectivity amongst sites to ensure larval flow and avoid the isolation of populations.
We demonstrated that applying graph theory enables to gain a deeper insight into egg/larval dispersal network structure and function in a complex system. For example, Betweenness centrality identified nodes that have strategic importance for channelling large flow of propagules (high Betweenness), as nodes from 5 to 8 that are in a hydrodynamically active area close to a cape (Fig. 1). The incorporation of spatially explicit information on reproductive output and graph theory analysis enabled the identification of nodes acting as stepping-stones within the complete network (Betweenness centrality), as well as the main paths through which the larvae are transported (edge-Betweenness). For example, a recent study has used Betweenness to identify key nodes that act as gateways to dispersal in an MPA-OAA network in an archipelago in the Western Indian Ocean (Gamoyo et al. 2019). At the same time, Closeness captures how close a node is to the “central region” of the network. But here "central region" does not correspond to the geographical centre but to the central source of larvae dissemination. This "central region" can change from species to species, therefore, the Closeness value for each node will change for each realised larval connectivity network, when species-specific demographic information is incorporated (Fig. 4). Hence, it is possible to identify the best and worst connected nodes (using Closeness) independently of their spatial location.
If egg production is uniform throughout the network, differences in centrality measures should not be expected. However, demographic differences between species in an ecosystem should be expected. For example, in nature, individuals tend to aggregate where conditions are more favourable. Marked differences in population reproductive parameters (e.g., batch fecundity, maternal effects, etc.) have been observed in S. scriba at relatively short distances (few kilometres, Alós et al. 2013). This spatial variability highlights the necessity of including demographic parameters when estimating connectivity. Other factors like larval behaviour are also relevant, yet not always available. For example, vertical migration (Ospina-Alvarez, Parada, et al. 2012, Daigle et al. 2016); directionality in swimming in response to the sound of waves breaking on shore (Tolimieri et al. 2000, Montgomery et al. 2006) or to chemical stimuli (Sweatman 1988, Paris, Atema, et al. 2013); and aggregation under floating objects (Shanks 1983, Tully & Ceidigh 1989, Ohta & Tachihara 2004) have been shown to modify the trajectories and final destination of fish larvae. Our study relies on S. scriba, due to availability of biological data on the species in the study area, but the spatial optimization of MPAs in other case studies should incorporate a set of species representative of the species pool per habitat type in the region (Blanco et al. 2019).
Despite these limitations, the potential connectivity network is highly relevant, as it can be used in absence of detailed biological information of the key species, or species’ pool, in the area of interest. However, incorporating biological parameters of a key species allowed us to obtain a more realistic representation of the connectivity patterns and understanding of stock dynamics (Morgan & Fisher 2010, Kell et al. 2015).The comparison of the two networks (potential vs. realised) evidences changes in the relative importance of nodes as stepping-stones. For example, in our realised connectivity network, node 5 emerged as a key node, while the importance of node 6, a key component of the potential network, decreased drastically. In the case study this is relevant, because node 5 is in fact a marine reserve (Fig. 1) that, according to the centrality measures chosen, acts well as a bridge between communities (Fig. 8) and as a node with high egg exportation with subsequent high larval recruitment rates. We observed how Betweenness and Closeness centrality ranked differently the important nodes in the realised connectivity matrix. We also observed how the bridge links between stepping-stone nodes and the classification of the best-connected sites (according to their Closeness, Fig. 4) changed between these networks, despite the case study was a small network dominated by high retention and self-recruitment.
MPA network design involves making decisions about the allocation of protected areas, interspaced by areas open to fisheries (or under more permissive fisheries restriction regimes). The alternative scenario showed potential benefits for the network performance, particularly improving the Betweenness in Palma Bay (nodes 2 to 5). Also, it achieved a better balance of Out-strength and In-strength measures in the southern cape area (node 7). Still, as revealed by Strength, Out-strength and Betweenness, nodes 3 to 5 are crucial for the performance of the network. However, node 7 gained relevance in maintaining the connectivity with the more peripheral nodes, including the Cabrera Archipelago MPA (nodes 10 to 12). By allocating MPAs in the best performing sites in terms of larval connectivity, ecological connectivity through the network is improved and, therefore, the resilience of the whole spawner-recruit system is strengthened. We also show how closing sites to fishing activities leads to different patterns of connectivity or groupings of sites. Management decisions based on centrality measures can increase network resilience by allowing, through simple analysis, decision-making in networks composed of several management units (Fig. 8).
The graph analysis performed over the realised connectivity network eases the understanding of some ecological processes (e.g., gene flow, colonization, invasion; Moilanen 2011) and demonstrates that the incorporation of biological data provides an additional and valuable source of information to assist management decisions. A key advantage of graph analysis is the information provided by centrality measures, which allow to identify the most critical nodes acting as bridges between communities. We encourage scientists and decision-makers to choose within the set of centrality measures derived from graph theory, those that best define their case study according to their ecological significance. This will assist the adoption of the concept “reproductive system” by Lowerre-Barbieri et al. (2016) as a more realistic framework to analyse population resilience through time and produce a more detailed view of the connectivity patterns in meta-populations of marine species.
Acknowledgments
This study was supported by the research project Phenofish (grant number CTM2015-69126-C2-1-R) funded by the Spanish Ministry of Economy and Competiveness. AO was supported by H2020 Marie Skłodowska-Curie Actions MSCA-IF-2016 (Project ID: 746361). SJ was supported by H2020- Marie Skłodowska-Curie Actions MSCA-IF-2016 (Project ID: 743545). JA was supported by a Ramón y Cajal Grant funded by the Spanish Ministry of Science, Innovation and Universities (Grant No. RYC2018-024488-I). GFB was funded by a fellowship (FPI-INIA) (CPD2015) from the National Institute for Agricultural and Food Research and Technology (INIA).
References
-
Alonso-Fernández A, Alós J, Grau A, Domínguez-Petit R, Saborido-Rey F (2011) The Use of Histological Techniques to Study the Reproductive Biology of the Hermaphroditic Mediterranean Fishes Coris julis, Serranus scriba, and Diplodus annularis. Marine and Coastal Fisheries 3:145–159
-
Alós J, Alonso-Fernández A, Catalán IA, Palmer M, Lowerre-Barbieri S (2013) Reproductive output traits of the simultaneous hermaphrodite Serranus scriba in the western Mediterranean. Sci Mar 77:331–340
-
Alós J, Palmer M, Catalán IA, Alonso-Fernández A, Basterretxea G, Jordi A, Buttay L, Morales-Nin B, Arlinghaus R (2014) Selective exploitation of spatially structured coastal fish populations by recreational anglers may lead to evolutionary downsizing of adults. Mar Ecol Prog Ser 503:219–233
-
Andrello M, Jacobi MN, Manel S, Thuiller W, Mouillot D (2015) Extending networks of protected areas to optimize connectivity and population growth rate. Ecography 38:273–282
-
Armsworth PR (2002) Recruitment limitation, population regulation, and larval connectivity in reef fish metapopulations. Ecology 83:1092–1104
-
Basterretxea G, Jordi A, Catalán IA, Sabatés A (2012) Model-based assessment of local-scale fish larval connectivity in a network of marine protected areas. Fish Oceanogr 21:291–306
-
Blanco M, Ospina-Alvarez A, Navarrete SA, Fernández M (2019) Influence of larval traits on dispersal and connectivity patterns of two exploited marine invertebrates in central Chile. Mar Ecol Prog Ser 612:43–64
-
Botsford LW, Brumbaugh DR, Grimes C, Kellner JB, Largier J, O’Farrell MR, Ralston S, Soulanille E, Wespestad V (2008) Connectivity, sustainability, and yield: bridging the gap between conventional fisheries management and marine protected areas. Rev Fish Biol Fish 19:69–95
-
Botsford LW, Micheli F, Hastings A (2003) Principles for the design of marine reserves. Ecol Appl 13:25–31
-
Botsford LW, White JW, Coffroth MA, Paris CB, Planes S, Shearer TL, Thorrold SR, Jones GP (2009) Connectivity and resilience of coral reef metapopulations in marine protected areas: matching empirical efforts to predictive needs. Coral Reefs 28:327–337
-
Brandes U, Delling D, Gaertler M, Görke R, Hoefer M, Nikoloski Z, Wagner D (2008) On modularity clustering. TKDE 20:172–188
-
Catalán IA, Macías D, Solé J, Ospina-Alvarez A, Ruíz J (2013) Stay off the motorway: resolving the pre-recruitment life history dynamics of the European anchovy in the SW Mediterranean through a spatially-explicit individual-based model (SEIBM). Prog Oceanogr 111:140–153
-
Chang W (2012) R Graphics Cookbook, 1st edn. O’Reilly, Sebastopol
-
Conklin EE, Neuheimer AB, Toonen RJ (2018) Modeled larval connectivity of a multi-species reef fish and invertebrate assemblage off the coast of Moloka‘i, Hawai‘i. PeerJ 6:e5688–32
-
Cowen RK, Sponaugle S (2009) Larval dispersal and marine population connectivity. Annu Rev Mar Sci 1:443–466
-
Cowen RK, Paris CB, Srinivasan A (2006) Scaling of connectivity in marine populations. Science 311:522–527
-
Csardi G, Nepusz T (2006) The igraph software package for complex network research. InterJournal Complex Systems:1695
-
Daigle RM, Chassé J, Metaxas A (2016) The relative effect of behaviour in larval dispersal in a low energy embayment. Prog Oceanogr 144:93–117
-
Dale MRT, Fortin MJ (2010) From Graphs to Spatial Graphs. Annu Rev Ecol Evol S 41:21–38
-
Donahue MJ, Karnauskas M, Toews C, Paris CB (2015) Location isn’t everything: Timing of spawning aggregations optimizes larval replenishment. PLoS ONE 10:e0130694
-
Fogarty MJ, Botsford L (2007) Population connectivity and spatial management of marine fisheries. Oceanography 20:112–123
-
Freeman LC (1978) Centrality in social networks conceptual clarification. Social Networks 1:215–239
-
Friesen SK, Martone R, Rubidge E, Baggio JA, Ban NC (2019) An approach to incorporating inferred connectivity of adult movement into marine protected area design with limited data. Ecol Appl 29:e01890–14
-
Gaines SD, White C, Carr MH, Palumbi SR (2010) Designing marine reserve networks for both conservation and fisheries management. P Natl Acad Sci USA 107:18286–18293
-
Galarza JA, Carreras-Carbonell J, Macpherson E, Pascual M, Roques S, Turner GF, Rico C (2009) The influence of oceanographic fronts and early-life-history traits on connectivity among littoral fish species. P Natl Acad Sci USA 106:1473–1478
-
Gamoyo M, Obura D, Reason CJC (2019) Estimating Connectivity Through Larval Dispersal in the Western Indian Ocean. J Geophys Res Biogeosci 124:2446–2459
-
Girvan M, Newman M (2002) Community structure in social and biological networks. P Natl Acad Sci USA 99:7821–7826
-
Guimera R, Nunes Amaral LA (2005) Functional cartography of complex metabolic networks. Nature 433:895–900
-
Gwinn DC, Allen MS, Johnston FD, Brown P, Todd CR, Arlinghaus R (2015) Rethinking length-based fisheries regulations: the value of protecting old and large fish with harvest slots. Fish and Fisheries 16:259–281
-
Hedgecock D, Barber PH, Edmands S (2007) Genetic approaches to measuring connectivity. Oceanography 20:70–79
-
Henry L-A, Mayorga-Adame CG, Fox AD, Polton JA, Ferris JS, McLellan F, McCabe C, Kutti T, Roberts JM (2018) Ocean sprawl facilitates dispersal and connectivity of protected species. Sci Rep 8:1–11
-
Hinckley S, Hermann A, Mier K, Megrey BA (2001) Importance of spawning location and timing to successful transport to nursery areas: a simulation study of Gulf of Alaska walleye pollock. ICES J Mar Sci 58:1042–1052
-
Hixon MA, Johnson DW, Sogard SM (2014) BOFFFFs: on the importance of conserving old-growth age structure in fishery populations. ICES J Mar Sci 71:2171–2185
-
Jacobi MN, Jonsson PR (2011) Optimal networks of nature reserves can be found through eigenvalue perturbation theory of the connectivity matrix. Ecol Appl 21:1861–1870
-
Kaplan DM, Cuif M, Fauvelot C, Vigliola L, Nguyen-Huu T, Tiavouane J, Lett C (2017) Uncertainty in empirical estimates of marine larval connectivity. ICES J Mar Sci 74:1723–1734
-
Kell LT, Nash RDM, Dickey-Collas M, Mosqueira I, Szuwalski C (2015) Is spawning stock biomass a robust proxy for reproductive potential? Fish and Fisheries:doi: 10.1111–faf.12131
-
Kininmonth S, Weeks R, Abesamis RA, Bernardo LPC, Beger M, Treml EA, Williamson D, Pressey RL (2018) Strategies in scheduling marine protected area establishment in a network system. Ecol Appl 1695:1–10
-
Kininmonth SJ, De’ath G, Possingham HP (2009) Graph theoretic topology of the Great but small Barrier Reef world. Theor Ecol 3:75–88
-
Kinlan BP, Gaines SD (2003) Propagule dispersal in marine and terrestrial environments: a community perspective. Ecology 84:2007–2020
-
Kough AS, Paris CB (2015) The influence of spawning periodicity on population connectivity. Coral Reefs 34:753–757
-
Lagabrielle E, Crochelet E, Andrello M, Schill SR, Arnaud-Haond S, Alloncle N, Ponge B (2014) Connecting MPAs – eight challenges for science and management. Aquat Conserv 24:94–110
-
Lett C, Nguyen-Huu T, Cuif M, Saenz-Agudelo P, Kaplan DM (2015) Linking local retention, self-recruitment, and persistence in marine metapopulations. Ecology 96:2236–2244
-
Loro M, Ortega E, Arce RM, Geneletti D (2015) Ecological connectivity analysis to reduce the barrier effect of roads. An innovative graph-theory approach to define wildlife corridors with multiple paths and without bottlenecks. Landscape and Urban Planning 139:149–162
-
Lowerre-Barbieri S, DeCelles G, Pepin P, Catalán IA, Muhling B, Erisman B, Cadrin SX, Alós J, Ospina-Alvarez A, Stachura MM, Tringali MD, Burnsed SW, Paris CB (2016) Reproductive resilience: a paradigm shift in understanding spawner-recruit systems in exploited marine fish. Fish and Fisheries 18:285–312
-
Lubchenco J, Palumbi SR, Gaines SD, Andelman S (2003) Plugging a Hole in the Ocean: The Emerging Science of Marine Reserves. Ecol Appl 13:S3–S7
-
Macpherson E, Raventós N (2006) Relationship between pelagic larval duration and geographic distribution in Mediterranean littoral fishes. Mar Ecol Prog Ser 327:257–265
-
March D, Palmer M, Alós J, Grau A, Cardona F (2010) Short-term residence, home range size and diel patterns of the painted comber Serranus scriba in a temperate marine reserve. Mar Ecol Prog Ser 400:195–206
-
Moilanen A (2011) On the limitations of graph-theoretic connectivity in spatial ecology and conservation. J Appl Ecol 48:1543–1547
-
Montgomery JC, Jeffs A, Simpson SD, Meekan M, Tindle C (2006) Sound as an orientation cue for the pelagic larvae of reef fishes and decapod crustaceans. Adv Mar Biol 51:143–196
-
Morgan SG (2014) Behaviorally mediated larval transport in upwelling systems. Advances in Oceanography 2014:1–17
-
Morgan SG, Fisher JL (2010) Larval behavior regulates nearshore retention and offshore migration in an upwelling shadow and along the open coast. Mar Ecol Prog Ser 404:109–126
-
Norcross BL, Shaw RF (1984) Oceanic and estuarine transport of fish eggs and larvae: A review. Trans Am Fish Soc 113:153–165
-
Ohta I, Tachihara K (2004) Larval development and food habits of the marbled parrotfish, Leptoscarus vaigiensis , associated with drifting algae. Ichthyol Res 51:63–69
-
Ospina-Alvarez A, Catalán IA, Bernal M, Roos D, Palomera I (2015) From egg production to recruits: Connectivity and inter-annual variability in the recruitment patterns of European anchovy in the northwestern Mediterranean. Prog Oceanogr 138:431–447
-
Ospina-Alvarez A, de Juan S, Davis KJ, González C, Fernández M, Navarrete SA (2020) Integration of biophysical connectivity in the spatial optimization of coastal ecosystem services. Sci Total Environ 733:139367
-
Ospina-Alvarez A, Palomera I, Parada C (2012) Changes in egg buoyancy during development and its effects on the vertical distribution of anchovy eggs. Fish Res 117:86–95
-
Ospina-Alvarez A, Parada C, Palomera I (2012) Vertical migration effects on the dispersion and recruitment of European anchovy larvae: From spawning to nursery areas. Ecol Model 231:65–79
-
Ospina-Alvarez A, Weidberg N, Aiken CM, Navarrete SA (2018) Larval transport in the upwelling ecosystem of central Chile: The effects of vertical migration, developmental time and coastal topography on recruitment. Prog Oceanogr 168:82–99
-
Paris CB, Atema J, Irisson J-O, Kingsford M, Gerlach G, Guigand CM (2013) Reef odor: A wake up call for navigation in reef fish larvae (C Fulton, Ed.). PLoS ONE 8:e72808
-
Paris CB, Helgers J, van Sebille E, Srinivasan A (2013) Connectivity Modeling System: A probabilistic modeling tool for the multi-scale tracking of biotic and abiotic variability in the ocean. Environ Modell Softw 42:47–54
-
Pineda J (2000) Linking larval settlement to larval transport: assumptions, potentials, and pitfalls. Oceanography of the Eastern Pacific 1:84–105
-
R Core Team (2019) R: A Language and Environment for Statistical Computing. Vienna, Austria
-
Reichardt J, Bornholdt S (2006) Statistical Mechanics of Community Detection. arXiv cond-mat.dis-nn
-
Saunders MI, Brown CJ, Foley MM, Febria CM, Albright R, Mehling MG, Kavanaugh MT, Burfeind DD (2016) Human impacts on connectivity in marine and freshwater ecosystems assessed using graph theory: a review. Mar Freshwater Res 67:277–290
-
Shanks AL (1983) Surface slicks associated with tidally forced internal waves may transport pelagic larvae of benthic invertebrates and fishes shoreward. Mar Ecol Prog Ser 13:311–315
-
Siegel DA, Kinlan BP, Gaylord B, Gaines SD (2003) Lagrangian descriptions of marine larval dispersion. Mar Ecol Prog Ser 260:83–96
-
Siegel DA, Mitarai S, Costello CJ, Gaines SD, Kendall BE, Warner RR, Winters KB (2008) The stochastic nature of larval connectivity among nearshore marine populations. P Natl Acad Sci USA 105:8974–8979
-
Strathmann RR, Hughes TR, Kuris AM, Lindeman KC, Morgan SG, Pandolfi JM, Warner RR (2002) Evolution of self-recruitment and its consequences for marine populations. Bulletin of Marine Science -Miami- 70
-
Sweatman H (1988) Field evidence that settling coral reef fish larvae detect resident fishes using dissolved chemical cues. J Exp Mar Biol Ecol 124:163–174
-
Thorrold SR, Zacherl DC, Levin LA (2007) Population connectivity and larval dispersal using geochemical signatures in calcified structures. Oceanography 20:80–89
-
Tolimieri N, Jeffs A, Montgomery JC (2000) Ambient sound as a cue for navigation by the pelagic larvae of reef fishes. Mar Ecol Prog Ser 207:219–224
-
Travis JMJ, Dytham C (1998) The evolution of dispersal in a metapopulation: a spatially explicit, individual-based model. Proc R Soc Lond, B, Biol Sci 265:17–23
-
Treml EA, Halpin PN, Urban DL, Pratson LF (2008) Modeling population connectivity by ocean currents, a graph-theoretic approach for marine conservation. Landscape Ecol 23:19–36
-
Tully O, Ceidigh PÓ (1989) The ichthyoneuston of Galway Bay (west of Ireland). II. Food of post-larval and juvenile neustonic and pseudo-neustonic fish. Mar Ecol Prog Ser 51:301–310
-
Walford LA (1938) Effect of currents on distribution and survival of the eggs and larvae of the haddock (Melanogrammius aeglefinus) on Georges bank. Bulletin of the Bureau of Fisheries 49:1–73
-
Watson JR, Kendall BE, Siegel DA, Mitarai S (2012) Changing seascapes, stochastic connectivity, and marine metapopulation dynamics. Am Nat 180:99–112
-
Watson JR, Mitarai S, Siegel DA, Caselle JE, Dong C, McWilliams JC (2010) Realized and potential larval connectivity in the Southern California Bight. Mar Ecol Prog Ser 401:31–48
-
Werner FE, Cowen RK, Paris CB (2007) Coupled biological and physical models. Oceanography
-
Wickham H (2016) ggplot2: Elegant Graphics for Data Analysis. Springer International Publishing, New York
See pages 1-10 of SI.pdf