Band Structure of Overdoped Cuprate Superconductors: Density Functional Theory Matching Experiments
Abstract
A comprehensive angle resolved photoemission spectroscopy study of the band structure in single layer cuprates is presented with the aim of uncovering universal trends across different materials. Five different hole- and electron-doped cuprate superconductors (La1.59Eu0.2Sr0.21CuO4, La1.77Sr0.23CuO4, Bi1.74Pb0.38Sr1.88CuO6+δ, Tl2Ba2CuO6+δ, and Pr1.15La0.7Ce0.15CuO4) have been studied with special focus on the bands with predominately -orbital character. Using light polarization analysis, the and bands are identified across these materials. A clear correlation between the band energy and the apical oxygen distance is demonstrated. Moreover, the compound dependence of the band bottom and the band top is revealed. Direct comparison to density functional theory (DFT) calculations employing hybrid exchange-correlation functionals demonstrates excellent agreement. We thus conclude that the DFT methodology can be used to describe the global band structure of overdoped single layer cuprates on both the hole and electron doped side.
Introduction: The physics of cuprate superconductors has been a subject of intense investigations for more than three decades Lee et al. (2006); Keimer et al. (2015); Scalapino (2012). Yet, some of the most fundamental questions related to high-temperature superconductivity remain open. For example, consensus on the mechanism underpinning cuprate superconductivity is still missing. Related to this is the question of the defining parameters for the transition temperature Slezak et al. (2008); Norman (2008); Sakakibara et al. (2010); Matt et al. (2018); Weber et al. (2012); Adler et al. (2018), and how to optimize it. Starting point for most theoretical approaches to superconductivity is an (effective) electronic band structure as well as the interactions that are relevant for driving a pairing mechanism. The former is typically obtained through density functional theory (DFT). However, because DFT cannot describe all relevant aspects of the electronic structure (such as the Mott insulating phase out of which superconductivity emerges upon hole or electron doping Furness et al. (2018)) it is commonly viewed as too simplistic of an approach in the context of the cuprates Hozoi et al. (2011). Another widespread assumption is that effective models for cuprates can be constructed solely on the band structure. This latter assumption has recently been challenged Sakakibara et al. (2010, 2012) by angle-resolved photoemission spectroscopy (ARPES) observations of a second band () hybridizing with the orbital in overdoped La1.77Sr0.23CuO4 (LSCO) Matt et al. (2018); Horio et al. (2018a).
Here we provide a systematic ARPES and DFT study of the electronic -band structure across single layer cuprate superconductors. Five different hole- and electron-overdoped superconducting systems [La1.59Eu0.2Sr0.21CuO4 (Eu-LSCO), La1.77Sr0.23CuO4 (LSCO), Bi1.74Pb0.38Sr1.88CuO6+δ (Bi2201), Tl2Ba2CuO6+δ (Tl2201), and Pr1.15La0.7Ce0.15CuO4 (PLCCO)] have been investigated experimentally. This has led to three main observations: (i) clear identification of the band position in three of the mentioned compounds, (ii) compound dependence of the band bottom positions and (iii) the (, and ) band positions at the zone corner. These experimental observations are quantified as a function of apical oxygen distance and compared directly to DFT calculations. Generally, excellent quantitative agreement between DFT and experimental band structures is found. It is therefore concluded that even though DFT is not capturing low-energy self-energy effects, it is successfully describing the global band structure of the cuprates.
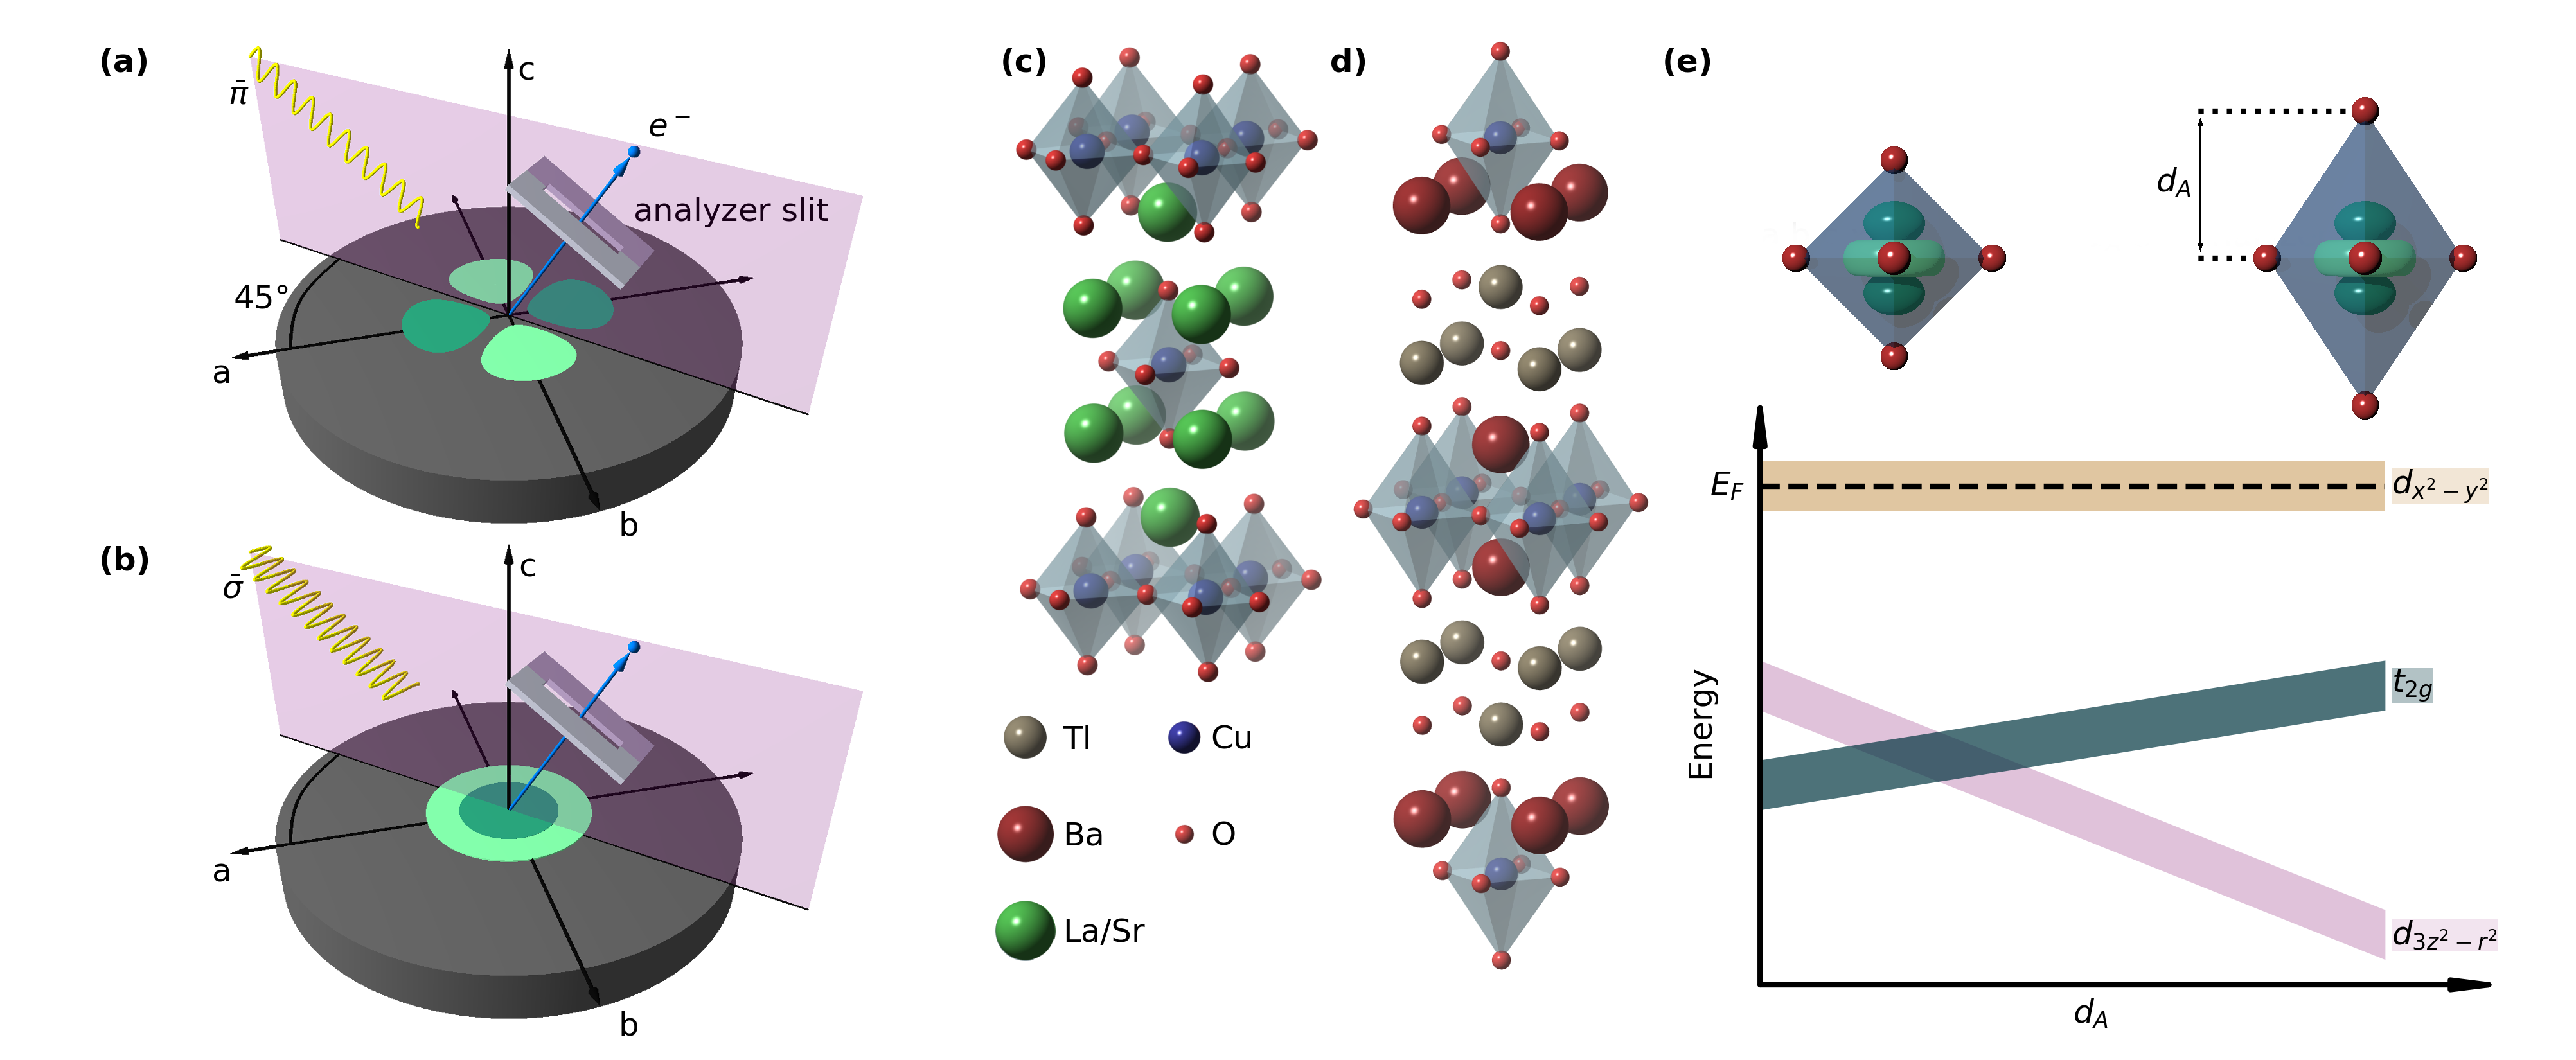
Methods: Single crystals of Eu-LSCO, LSCO, Bi2201, Tl2201 and PLCCO were grown by floating zone or flux growth techniques. Both ultraviolet () and soft x-ray () ARPES experiments were carried out at the SIS U. Flechsig and Schmidt (2004) and ADRESS Strocov et al. (2014) beamlines at the Swiss Light Source. All data were recorded at a temperature of approximately . Electrons were analyzed through a slit oriented within the photoemission mirror plane Damascelli et al. (2003). Light polarization perpendicular (parallel) to the mirror plane is denoted as ().
Predicting the correct energies for the electronic bands is a notorious problem for DFT in many materials, which is mostly due to the unknown form of the exchange-correlation functional. Improvements over local density approximations are commonly obtained using hybrid functionals which mix in a portion of exact exchange from Hartree-Fock theory Krukau et al. (2006). While is a free parameter in general, we find good agreement between the theoretical and experimental band structures for all compounds studied by fixing . We thus propose this value as generically suited for cuprate superconductors. A hypothetical tetragonal structure of La2CuO4 with lattice parameters corresponding to overdoped LSCO was used and the chemical potential adjusted to match the actual hole-filling. Similarly, for Bi2201, Tl2201 and PLCCO stochiometric tetragonal crystal structures were used as a starting point for the DFT calculations. We ensured, on the example of Bi2201, that using an orthorhombic crystal structure leads to essentially the same results after downfolding the calculated band structure to the tetragonal Brillouin zone. More details on the methodology used can be found in the supplementary material 111The supplementary material can be found at the end of this document. References 31-39 appear therein.. Although some of the systems studied have orthorhombic structures, we represent all data in tetragonal notation Damascelli et al. (2003), using the CuO2 plaquette Brillouin zone nomenclature. Therefore M and X, respectively, denote the zone corner and boundary in units of with being the tetragonal in-plane lattice parameter [Fig. 1 (c), inset].
Results: We start by examining the nodal spectra recorded on overdoped Bi2201 using linearly polarized soft x-rays, see Fig. 1. The photoemission intensities of the observed band structure are highly dependent on the incident light polarization. Three distinct bands are identified. (i) The intensely-studied nodal quasiparticle dispersion Zhou et al. (2003); Fatuzzo et al. (2014); Yoshida et al. (2007) crossing the Fermi level , which is observed with -polarized light only. This fact can be appreciated both from the energy distribution maps (EDMs) and the momentum distribution curves (MDCs) at the Fermi level [Figs. 1 (a),(b)]. (ii) A second dispersive band with energy maximum of at the M-point and band bottom at the -point. At the M-point, this band is featured in both the and channels [Fig. 1 (c)]. Notice that in comparison to previous studies of Bi2201, our data displays extremely weak -folded replica bands King et al. (2011); Rosen et al. (2013). As a result and in contrast to Refs. Xia et al., 2008; Meevasana et al., 2007, this dispersive band is not found at the -folded equivalent -point. (iii) The -channel features an additional weakly dispersive band at energy [Fig. 1 (b)]. This band, which to the best of our knowledge has not been reported previously, is completely suppressed in the -sector.
Nodal ARPES spectra recorded in and polarization on LSCO, Bi2201, Tl2201 and PLCCO are shown in Figs. 2 (a)–(h). For all four compounds, the band crossing the Fermi level is visible (suppressed) in the () channel. Interestingly, the bottom of this band varies significantly, from in LSCO to for Tl2201. In the channel an additional band feature appears for LSCO, Bi2201 and PLCCO. The position and band width of this -suppressed band differs for the three compounds. In LSCO, it disperses from at the M-point to at the zone center, while for Bi2201 and PLCCO the -branches found at and respectively, are quasi non-dispersive. Finally, for Tl2201 no band unique to the channel was identified down to .
The DFT band structure of LSCO, Bi2201, Tl2201 and PLCCO [Figs. 2 (a)–(h)] has been calculated as described above and in the supplementary material. In addition to the band dispersions, their expected photoemission matrix elements are indicated according to their mirror eigenvalues. To first order, photoemission matrix elements can be understood through simple symmetry considerations Damascelli et al. (2003); Moser (2017). Our experimental setup has a mirror-plane defined by the incident photon beam and the electron analyzer. With respect to this plane, the electromagnetic field has even (odd) parity for parallel (perpendicular) () polarization [suppl. Figs. S4 (a), (b)]. Meanwhile, the photoemitted electron wave function has even parity. The mirror eigenvalues of the (, , , +, ) orbital states are (, 1, 1, 1, ), respectively (suppl. Tab. SI). Therefore, and states will be suppressed in the channel while states cannot appear under illumination. Since and orbitals are not eigenstates of the mirror operator, electronic states along are formed by even ( + ) and odd ( ) linear combinations and will thus be visible under both polarizations. In Fig. 2, bands with matrix element 0 are colored light grey, while bands with nonzero matrix element remain black.
For LSCO, the band width is roughly with a band maximum at the M-point (). The crossing of the and bands, constituting a type-II Dirac line node, is protected by mirror symmetry Horio et al. (2018a); Tao and Tsymbal (2018). For Bi2201 and Tl2201, the band is pushed to lower energies and an overall smaller band width is found. As a result, the nodal crossing of the and bands is not found for Bi2201 and Tl2201. The type-II Dirac line node is thus unique to LSCO Horio et al. (2018a). We also notice that in LSCO, the band lies above the bands whereas the opposite is true for Bi2201 and Tl2201. Finally, in comparison to LSCO, the bottom of the band is closer to the Fermi level in Tl2201.
Discussion: The polarization dependence of the band which crosses the Fermi level allows us to assign it uniquely to the orbital in all studied compounds. For Bi2201, the next band below the Fermi level is found in both the and channels and hence can be assigned to the , orbitals. The flat band found around in the channel has to have either or character. For a unique orbital assignment we stress the following facts: (i) Resonant inelastic x-ray scattering (RIXS) measurements of the -excitations found the states at and below the , , states Peng et al. (2017). (ii) As the orbital extends purely in the -plane, the band is generally expected to disperse strongly along the nodal direction. This is indeed confirmed by our DFT calculations. Combined, this lets us assign the band in Bi2201 to the orbital. As previously discussed in Ref. Matt et al., 2018 and shown in Fig. 2 and suppl. Fig. S3 the band is clearly identified in La-based cuprates. In the case of Tl2201, by contrast, no evidence for the band is found down to . Therefore, either the band in Tl2201 is pushed to even lower binding energies or this band is too faint to be observed. The latter scenario is supported by the fact that in PLCCO with no apical oxygen, the band is found at around [see Fig. 2(h)].
We plot the observed band position at the M-point as a function of the compound dependent ratio between apical oxygen distance and in-plane lattice constant (Fig. 3). Furthermore, the band bottoms and the energies of the bands at the zone corner M are plotted alongside their respective positions found from our DFT calculations. One can see that the calculations capture the most salient band structure trends: (i) DFT correctly predicts how the band position – with respect to the Fermi level – evolves as a function of . (ii) DFT yields the right trends for the band widths of both the and bands. The band width is, for example, gradually reduced when going through the series LSCO Bi2201 Tl2201. The ARPES data on LSCO and Bi2201 supports that trend. For the band, ARPES only reveals the occupied part. Instead of band width, it thus makes more sense to consider the band bottom. It turns out that the band minimum is varying across LSCO, Bi2201, and Tl2201 and the positions agree between DFT and experiment. (iii) The band position at the zone corner also follows the trend of moving closer to with increasing , both in experiment and the DFT calculations. However, we stress that because the DFT methodology is not including electron interactions, it is not capturing self-energy effects such as the much discussed nodal waterfall structure Graf et al. (2007); Valla et al. (2007); Chang et al. (2007).
Conclusions: In summary, we have carried out a comprehensive ARPES and DFT study of the band structure across single layer cuprate superconductors. Experimentally, five different overdoped cuprate compounds were studied using light polarization analysis to assign band orbital characters. Both the ( and ) and bands were discussed and their band positions and band widths were compared to DFT calculations. The excellent agreement between DFT and experimental results led us to conclude that the DFT methodology with proper choice of exchange-correlation functional does capture the global electronic structure of the overoped cuprates.
Acknowledgments: K.P.K., M.H., D.S., J.A.K., and J.C. acknowledge support by the Swiss National Science Foundation. Y.S. is funded by the Swedish Research Council (VR) with a Starting Grant (Dnr. 2017-05078) O.K.F. and M.M. are supported by a VR neutron project grant (BIFROST, Dnr. 2016-06955). ARPES measurements were performed at the ADRESS and SIS beamlines of the Swiss Light Source at the Paul Scherrer Institute. We thank the beamline staff for their support.
References
- Lee et al. (2006) P. A. Lee, N. Nagaosa, and X.-G. Wen, Rev. Mod. Phys. 78, 17 (2006), URL https://link.aps.org/doi/10.1103/RevModPhys.78.17.
- Keimer et al. (2015) B. Keimer, S. A. Kivelson, M. R. Norman, S. Uchida, and J. Zaanen, Nature 518, 179 EP (2015), URL http://dx.doi.org/10.1038/nature14165.
- Scalapino (2012) D. J. Scalapino, Rev. Mod. Phys. 84, 1383 (2012), URL https://link.aps.org/doi/10.1103/RevModPhys.84.1383.
- Slezak et al. (2008) J. A. Slezak, J. Lee, M. Wang, K. McElroy, K. Fujita, B. M. Andersen, P. J. Hirschfeld, H. Eisaki, S. Uchida, and J. C. Davis, Proceedings of the National Academy of Sciences of the United States of America 105, 3203 (2008), ISSN 0027-8424.
- Norman (2008) M. R. Norman, Proceedings of the National Academy of Sciences 105, 3173 (2008), ISSN 0027-8424, eprint http://www.pnas.org/content/105/9/3173.full.pdf, URL http://www.pnas.org/content/105/9/3173.
- Sakakibara et al. (2010) H. Sakakibara, H. Usui, K. Kuroki, R. Arita, and H. Aoki, Phys. Rev. Lett. 105, 057003 (2010), URL http://link.aps.org/doi/10.1103/PhysRevLett.105.057003.
- Matt et al. (2018) C. E. Matt, D. Sutter, A. M. Cook, Y. Sassa, M. Månsson, O. Tjernberg, L. Das, M. Horio, D. Destraz, C. G. Fatuzzo, et al., Nat. Commun. 9, 972 (2018).
- Weber et al. (2012) C. Weber, C. Yee, K. Haule, and G. Kotliar, EPL (Europhysics Letters) 100, 37001 (2012), URL http://stacks.iop.org/0295-5075/100/i=3/a=37001.
- Adler et al. (2018) R. Adler, C.-J. Kang, C.-H. Yee, and G. Kotliar, ArXiv e-prints (2018), eprint 1807.00398.
- Furness et al. (2018) J. W. Furness, Y. Zhang, C. Lane, I. G. Buda, B. Barbiellini, R. S. Markiewicz, A. Bansil, and J. Sun, Communications Physics 1, 11 (2018), URL https://doi.org/10.1038/s42005-018-0009-4.
- Hozoi et al. (2011) L. Hozoi, L. Siurakshina, P. Fulde, and J. van den Brink, Scientific Reports 1, 65 (2011), URL http://dx.doi.org/10.1038/srep00065.
- Sakakibara et al. (2012) H. Sakakibara, H. Usui, K. Kuroki, R. Arita, and H. Aoki, Phys. Rev. B 85, 064501 (2012), URL http://link.aps.org/doi/10.1103/PhysRevB.85.064501.
- Horio et al. (2018a) M. Horio, C. E. Matt, K. Kramer, D. Sutter, A. M. Cook, Y. Sassa, K. Hauser, M. Månsson, N. C. Plumb, M. Shi, et al., Nature Communications 9, 3252 (2018a), URL https://doi.org/10.1038/s41467-018-05715-2.
- U. Flechsig and Schmidt (2004) L. P. U. Flechsig and T. Schmidt, AIP Conf. Proc. 705, 316 (2004).
- Strocov et al. (2014) V. N. Strocov, X. Wang, M. Shi, M. Kobayashi, J. Krempasky, C. Hess, T. Schmitt, and L. Patthey, J. Synchrotron Rad. 21, 32 (2014), URL https://doi.org/10.1107/S1600577513019085.
- Damascelli et al. (2003) A. Damascelli, Z. Hussain, and Z.-X. Shen, Rev. Mod. Phys. 75, 473 (2003).
- Krukau et al. (2006) A. V. Krukau, O. A. Vydrov, A. F. Izmaylov, and G. E. Scuseria, The Journal of Chemical Physics 125, 224106 (2006), eprint https://doi.org/10.1063/1.2404663, URL https://doi.org/10.1063/1.2404663.
- Zhou et al. (2003) X. J. Zhou, T. Yoshida, A. Lanzara, P. V. Bogdanov, S. A. Kellar, K. M. Shen, W. L. Yang, F. Ronning, T. Sasagawa, T. Kakeshita, et al., Nature 423, 398 (2003), URL http://dx.doi.org/10.1038/423398a.
- Fatuzzo et al. (2014) C. G. Fatuzzo, Y. Sassa, M. Månsson, S. Pailhès, O. J. Lipscombe, S. M. Hayden, L. Patthey, M. Shi, M. Grioni, H. M. Rønnow, et al., Phys. Rev. B 89, 205104 (2014), URL https://link.aps.org/doi/10.1103/PhysRevB.89.205104.
- Yoshida et al. (2007) T. Yoshida, X. J. Zhou, D. H. Lu, S. Komiya, Y. Ando, H. Eisaki, T. Kakeshita, S. Uchida, Z. Hussain, Z.-X. Shen, et al., J. Phys. Condens. Matter. 19, 125209 (2007).
- King et al. (2011) P. D. C. King, J. A. Rosen, W. Meevasana, A. Tamai, E. Rozbicki, R. Comin, G. Levy, D. Fournier, Y. Yoshida, H. Eisaki, et al., 106, 127005 (2011), URL https://link.aps.org/doi/10.1103/PhysRevLett.106.127005.
- Rosen et al. (2013) J. A. Rosen, R. Comin, G. Levy, D. Fournier, Z. H. Zhu, B. Ludbrook, C. N. Veenstra, A. Nicolaou, D. Wong, P. Dosanjh, et al., Nature Communications 4, 1977 EP (2013), URL http://dx.doi.org/10.1038/ncomms2977.
- Xia et al. (2008) J. Xia, E. Schemm, G. Deutscher, S. A. Kivelson, D. A. Bonn, W. N. Hardy, R. Liang, W. Siemons, G. Koster, M. M. Fejer, et al., Phys. Rev. Lett. 100, 127002 (2008), URL https://link.aps.org/doi/10.1103/PhysRevLett.100.127002.
- Meevasana et al. (2007) W. Meevasana, X. J. Zhou, S. Sahrakorpi, W. S. Lee, W. L. Yang, K. Tanaka, N. Mannella, T. Yoshida, D. H. Lu, Y. L. Chen, et al., Phys. Rev. B 75, 174506 (2007), URL https://link.aps.org/doi/10.1103/PhysRevB.75.174506.
- Moser (2017) S. Moser, Journal of Electron Spectroscopy and Related Phenomena 214, 29 (2017), ISSN 0368-2048, URL http://www.sciencedirect.com/science/article/pii/S0368204816301724.
- Tao and Tsymbal (2018) L. L. Tao and E. Y. Tsymbal, Phys. Rev. B 98, 121102 (2018), URL https://link.aps.org/doi/10.1103/PhysRevB.98.121102.
- Peng et al. (2017) Y. Y. Peng, G. Dellea, M. Minola, M. Conni, A. Amorese, D. Di Castro, G. M. De Luca, K. Kummer, M. Salluzzo, X. Sun, et al., Nature Physics 13, 1201 EP (2017), URL http://dx.doi.org/10.1038/nphys4248.
- Graf et al. (2007) J. Graf, G.-H. Gweon, K. McElroy, S. Y. Zhou, C. Jozwiak, E. Rotenberg, A. Bill, T. Sasagawa, H. Eisaki, S. Uchida, et al., Phys. Rev. Lett. 98, 067004 (2007), URL https://link.aps.org/doi/10.1103/PhysRevLett.98.067004.
- Valla et al. (2007) T. Valla, T. E. Kidd, W.-G. Yin, G. D. Gu, P. D. Johnson, Z.-H. Pan, and A. V. Fedorov, Phys. Rev. Lett. 98, 167003 (2007), URL https://link.aps.org/doi/10.1103/PhysRevLett.98.167003.
- Chang et al. (2007) J. Chang, S. Pailhés, M. Shi, M. Månsson, T. Claesson, O. Tjernberg, J. Voigt, V. Perez, L. Patthey, N. Momono, et al., Phys. Rev. B 75, 224508 (2007), URL https://link.aps.org/doi/10.1103/PhysRevB.75.224508.
- Kresse and Hafner (1993) G. Kresse and J. Hafner, Phys. Rev. B 48, 13115 (1993), URL https://link.aps.org/doi/10.1103/PhysRevB.48.13115.
- Kresse and Furthmüller (1996) G. Kresse and J. Furthmüller, Computational Materials Science 6, 15 (1996), ISSN 0927-0256, URL http://www.sciencedirect.com/science/article/pii/0927025696000080.
- Blöchl (1994) P. E. Blöchl, Phys. Rev. B 50, 17953 (1994), URL https://link.aps.org/doi/10.1103/PhysRevB.50.17953.
- Kresse and Joubert (1999) G. Kresse and D. Joubert, Phys. Rev. B 59, 1758 (1999), URL https://link.aps.org/doi/10.1103/PhysRevB.59.1758.
- Perdew et al. (1996) J. P. Perdew, K. Burke, and M. Ernzerhof, Phys. Rev. Lett. 77, 3865 (1996), URL https://link.aps.org/doi/10.1103/PhysRevLett.77.3865.
- Mostofi et al. (2008) A. A. Mostofi, J. R. Yates, Y.-S. Lee, I. Souza, D. Vanderbilt, and N. Marzari, Computer Physics Communications 178, 685 (2008), ISSN 0010-4655, URL http://www.sciencedirect.com/science/article/pii/S0010465507004936.
- Mostofi et al. (2014) A. A. Mostofi, J. R. Yates, G. Pizzi, Y.-S. Lee, I. Souza, D. Vanderbilt, and N. Marzari, Comput. Phys. Commun. 185, 2309 (2014), ISSN 0010-4655.
- Kaminski et al. (2004) A. Kaminski, S. Rosenkranz, H. M. Fretwell, J. Mesot, M. Randeria, J. C. Campuzano, M. R. Norman, Z. Z. Li, H. Raffy, T. Sato, et al., Phys. Rev. B 69, 212509 (2004), URL https://link.aps.org/doi/10.1103/PhysRevB.69.212509.
- Horio et al. (2018b) M. Horio, K. Hauser, Y. Sassa, Z. Mingazheva, D. Sutter, K. Kramer, A. Cook, E. Nocerino, O. K. Forslund, O. Tjernberg, et al., Physical Review Letters 121, 077004 (2018b).
Supplementary Information
DFT calculations: The presented DFT calculations were performed using the VASP code package Kresse and Hafner (1993); Kresse and Furthmüller (1996) employing the projector-augmented wave method (PAW) Blöchl (1994); Kresse and Joubert (1999). The exchange-correlation functional was treated in the form similar to the Heyd-Scuseria-Ernzerhof (HSE06) Krukau et al. (2006) screened hybrid functional, but with a variable portion of Hartree-Fock (HF) exchange. The standard HSE06 functional uses , i.e. 25% of HF exchange and 75% of Perdew, Burke, and Ernzerhof generalized-gradient approximation (GGA) Perdew et al. (1996) for the short-range part of the exchange functional. We discover that this tends to overestimate the binding energy of the bands in the materials under study. On the other hand the pure GGA functional () underestimates the binding energies. By varying the portion of HF exchange, we find that the best overall agreement for all investigated materials is achieved by letting (suppl. Fig. S1). After performing self-consistent hybrid-functional calculations on a regular 6x6x6 -centered k-point grid, we interpolate the band structures along the line by means of the Wannier90 code package Mostofi et al. (2008, 2014).
We add two notes concerning the calculations of PLCCO: (i) We started with the stochiometric crystal structure of Pr2CuO4 and simulated the La occupation by replacing one of the two Pr sites in the unit cell with La. Even though this does not exactly represent the exact occupation that is present in the experimental compound, we ensured by comparison to calculations on Pr2CuO4 that varying the La content has only a minor effect on the electronic band structure. Thus the small error in occupation should not affect our conclusion. (ii) The energies of the -bands resulting from our calculations lie above due to the shifting of the Fermi level in order to account for the right electron filling. This result is of course unphysical and we conclude that our methodology, while proving very successful for the -orbitals, is unfit to correctly predict the -orbitals.
Background subtraction: In virtually all spectroscopy methods, the obtained data contains an intrinsic and extrinsic background. For the cuprates, it has been demonstrated that these background contributions have significant dependencies on binding energy Kaminski et al. (2004). In fact, the background at binding energies of might be an order of magnitude larger than at or near the Fermi level. For comparison of band structures across a wide range of binding energy, it can therefore be useful to subtract the background intensity Matt et al. (2018). Assuming a -independent background, we estimate the background profile by averaging the five lowest intensity points of each MDC Matt et al. (2018); Horio et al. (2018a). In this fashion, we are subtracting a constant background at each binding energy. MDCs therefore remain unchanged. Two examples, using Eu-LSCO and Tl2201, of this background subtraction procedure are shown in supplementary Fig. S3. We stress that for flat non-dispersive bands such a background determination is not advisable as the band structure will be eliminated in the subtraction procedure. We therefore only apply the background subtraction, in Fig. 2 of the main text, to enhance the visibility of dispersive bands.
Experimental details: Eu-LSCO, LSCO and PLCCO data presented has been acquired at the SIS beamline with incident photon energies of , and , respectively. Meanwhile, Bi2201 and Tl2201 data was taken at the ADRESS beamline with photon energies of and , respectively. All data presented was acquired at a temperature of approximately . The used photon energies ensure that the data taken stems from planes through along the -direction for LSCO, Tl2201 and PLCCO. For Bi2201 we are closer to the Brillouin zone edge along the -direction. Meanwhile, all calculations were done for , i.e. in planes through the Brillouin zone center. This fact does not invalidate our comparison between ARPES and DFT, however: The -dispersion has been shown to be of very small (yet finite) order in LSCO Horio et al. (2018b); Matt et al. (2018) and is not expected to be any bigger for Bi2201. The effect of being at a different therefore only contributes a shift in the order of the marker size in Fig. 3 of the main text.
| Character | odd | even | even | even | odd |
|---|---|---|---|---|---|
| 0 | 0 | 0 | 0 | 0 | |
| 0 | 0 | 0 | 0 | 0 |