Hybrid LWFA PWFA staging as a beam energy and brightness transformer: conceptual design and simulations
Abstract
We present a conceptual design for a hybrid laser-to-beam-driven plasma wakefield accelerator. In this setup, the output beams from a laser-driven plasma wakefield accelerator (LWFA) stage are used as input beams of a new beam-driven plasma accelerator (PWFA) stage. In the PWFA stage a new witness beam of largely increased quality can be produced and accelerated to higher energies. The feasibility and the potential of this concept is shown through exemplary particle-in-cell simulations. In addition, preliminary simulation results for a proof-of-concept experiment at HZDR (Germany) are shown.
I Introduction
Plasma-based accelerators driven by either an intense laser pulse Tajima1979 (LWFA) or a highly relativistic charged particle beam Veksler1956 ; Chen1985 ; Chen1987 (PWFA), generate and sustain accelerating fields orders of magnitude higher than those achievable with conventional radiofrequency technology, offering a path towards highly-compact and cost-effective particle accelerators, with multiple applications in science, industry and medicine.
In both LWFAs and PWFAs either a laser or a particle beam excites wakefields in an initially neutral and homogeneous plasma. These wakefields propagate at the velocity of the driver and oscillate at the plasma frequency, , where is the elementary charge, is the mass of the electron, is the vacuum permittivity and is the unperturbed plasma electron density. Sufficiently intense drivers generate the wakefields in the blowout regime, completely expelling all plasma electrons from their propagation path, and forming a clear ion cavity with a length given approximately by , with , the wakefield oscillation wavenumber, and the speed of light. Inside this cavity accelerating fields exceeding are generated, as well as an uniform focusing gradient , enabling ideal conditions for the acceleration and transport of electron beams to energies within -scale distances Rosenzweig1991 ; Lotov2004 ; Lu2006 .
Although LWFAs and PWFAs share the same working principle, they possess some fundamental differences inherited from the completely different nature of their drivers: in LWFAs, a drive laser with frequency propagates with a reduced group velocity in the plasma, , which results in a progressive dephasing between the electrons being accelerated at near the speed of light and the wakefields. Besides, although the laser propagation can be self-Thomas2007 ; Lu2007 or externally guided Spence2000 ; Shalloo2018 , the etching and diffraction effects on the laser pulse substantially affect the wakefield excitation conditions Streeter2018 , which together with the dephasing effect, harden the required control over the witness acceleration process for applications demanding witness beams with low energy spread and emittance. By contrast, PWFAs driven by highly relativistic electron beams are not affected by dephasing (the drive beam propagates at nearly the speed of light), and when in the blowout regime, the wakefield excitation state remains essentially unaltered over most of the propagation, making possible to find optimal conditions of beam loading for a minimal correlated energy spread Lotov2005 ; Tzoufras2008 , which hold over the entire acceleration process. Moreover, operating PWFAs in the blowout regime enables novel injection techniques specifically designed to deliver ultra-low emittance witness beams Hidding2012 ; Li2013 ; MartinezdelaOssa2013 ; MartinezdelaOssa2015 ; Wittig2015 ; MartinezdelaOssa2017 ; Manahan2017 , that can be efficiently accelerated within the blowout plasma wake, therefore allowing for a substantial improvement of the energy and the quality of the generated witness beams with respect to the drivers.
Other significant differences between LWFAs and PWFAs arise from their practical implementation: while LWFAs are operated by relatively compact high-power laser systems, PWFAs typically require costly km-scale electron linacs Hogan2010 ; Aschikhin2016 . Thanks to the proliferation of multiple laser laboratories around the world capable of producing short laser pulses with hundreds of peak power Strickland1985 , LWFAs have been greatly advanced over the last decades. Thus, important milestones, such as the realization of quasi-monoenergetic electron spectra Mangles2004 ; Geddes2004 ; Faure2004 , GeV-class beams Leemans2006 ; Wang2013 ; Leemans2014 , enhanced stability Osterhoff2008 ; Hafz2008 , controlled injection techniques for tunability Faure2006 ; Rowlands-Rees2008 ; Pak2010 ; Schmid2010 ; Gonsalves2011 ; Buck2013 ; Mirzaie2015 , and the application of the generated beams to drive compact synchrotron Schlenvoigt2008 , XUV Fuchs2009 and X-ray sources Kneip2010 ; Khrennikov2015 ; Dopp2017 , have validated plasma-based acceleration as a promising technique for future accelerators. By contrast, only few linac facilities are nowadays capable and ready to perform PWFAs, and in spite of the important advances achieved at SLAC Blumenfeld2007 ; Oz2007 ; Litos2014 ; Corde2015 ; Corde2016 , DESY Gross2018 ; Loisch2018 and CERN Adli2018 , PWFA research is handicapped by the comparably limited number of facilities which allow to realize PWFA.
In the context of this article, LWFAs are thought to provide a relatively compact and affordable source of high-energy electron beams for driving PWFAs, in order to allow an easier and widespread access to PWFA technology for research and applications. Besides, the LWFA-produced beams have some unique properties as PWFA drivers. LWFAs are now proven to routinely produce GeV-class and highly compressed beams Lundh2011 ; Heigoldt2015 ; Couperus2017 ; Irman2018 ; Li2017 , with peak currents well above the minimal requirements for enabling internal injection techniques and efficient acceleration in PWFAs. By contrast, achieving the drive beam energy and current required to enable a strong blowout regime in PWFAs imposes challenging operating conditions for linacs upon compressing and transporting the beam. Moreover, although the state-of-the-art emittance and energy spread of the LWFA-generated electron beams are as of yet insufficient for applications demanding a high beam quality (e.g. FELs), these characteristics do not inhibit their usage as driver beams for PWFAs and may even offer improved stability Mehrling2017 ; MartinezdelaOssa2018 .
Using the output of a LWFA to perform a PWFA was already proposed as a beam-energy afterburner, where two distinct electron bunches produced in an LWFA were thought to be used as a driver/witness pair in a PWFA stage Hidding2010 . Also a mode transition from LWFA to PWFA in one single stage has been proposed as a way of boosting the energy Pae2010 ; Masson-Laborde2014 and/or the betatron radiation Corde2011 ; Dong2018 ; Ferri2018 of the LWFA-produced electron beams. The concept developed here is fundamentally different, as the witness beam is generated in the PWFA stage in a controlled manner, and the hybrid LWFA PWFA staging is conceived as a beam energy and brightness transformer. This possibility of using LWFA-produced electron beams to drive a PWFA for the generation of superior quality beams has been also indicated in Hidding2012 ; MartinezdelaOssa2015 ; Manahan2017 . So far, important experimental milestones such that LWFA beams can generate wakefields in a subsequent plasma stage have been demonstrated Kuschel2016 ; Chou2016 ; Gilljohann2018 , but no acceleration of a distinct witness beam in an LWFA-driven PWFA has ever been reported.
In this work, we further study the potential of an LWFA-driven PWFA (LPWFA) by means of idealized setups simulated with the particle-in-cell (PIC) code OSIRIS Fonseca2002 ; Fonseca2008 ; Fonseca2013 . Specifically, we do not aim towards full predictive start-to-end simulations here, but for testing the feasibility of such scheme in the light of current experimental capabilities. In the scheme considered, the output beam from an LWFA stage is used as the driver of a PWFA stage, where a new witness beam of superior quality is generated and accelerated to higher energies. This scenario benefits from the advantages unique to each method, particularly exploiting the capability of PWFA schemes to provide energy-boosted and high-brightness witness beams, while the LWFA stage fulfills the demand for a compact source of relativistic high-current electron bunches required as PWFA drivers. In essence, the PWFA stage operates as a beam brightness and energy transformer of the LWFA output, aiming to reach the demanding beam quality requirements of accelerator-driven light sources Huang2012 ; Maier2012 ; Hidding2014 ; Dimitri2015 , without sacrificing the small spatial footprint and the relatively low cost offered by LWFAs.
II Conceptual design and simulations
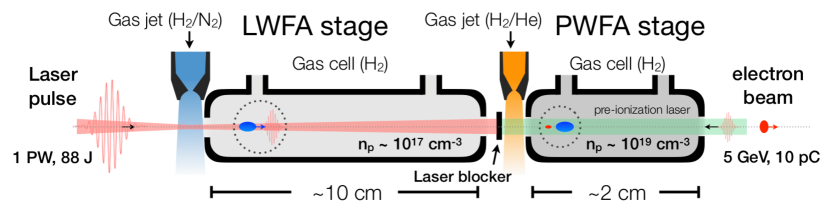
We start describing a conceptual design for an LPWFA consisting of two quasi-identical plasma acceleration modules coupled to each other with a minimal distance in between (Figure 1). Each plasma module contains a gas jet (supersonic gas nozzle) at the front, which is fed with a low-ionization-threshold (LIT) gas species (e.g. hydrogen), doped with a high-ionization-threshold (HIT) gas species at variable concentration. In each stage, the system triggers the injection of a witness beam via field-ionization from the dopant HIT species contained in the gas jet. The injection stops once the gas jet column is over. Immediately after the gas jet, a longer plasma cell composed only of the LIT gas species is used to further accelerate the generated witness beam.
The first plasma stage is driven by a high-power laser (LWFA), optimized for the production of a highly relativistic (order energy) and high-current electron beam via ionization injection Rowlands-Rees2008 ; Pak2010 . The LWFA electron beam is then used as driver of the subsequent plasma stage (PWFA), where a new high-quality witness beam is produced via wakefield-induced ionization injection MartinezdelaOssa2013 ; MartinezdelaOssa2015 and then boosted to high-energies. Both plasma stages need to be sufficiently close to each other, such that the LWFA-beam can be refocused into the second plasma by means of its self-driven plasma wakefields. A thin slab of solid material (e.g. aluminum, steel, kapton, etc.) is placed in the beginning of the second jet in order to remove the laser from the second stage, while letting the electron beam pass through. In addition, a counter-propagating low-intensity laser can be used to preionize the LIT gas species in the PWFA stage, in order to facilitate the beam focusing and enhance the blowout formation. Typically, the plasma density in the second stage needs to be increased substantially with respect to the one in the first stage, as it needs to be matched to the short length of the LWFA beam for an efficient injection and acceleration process. By operating the PWFA stage with a short and high-current electron beam at these high plasma densities, it is possible to generate ultra-short electron beams (sub-femtosecond duration), which double the initial energy of the LWFA beam in just few cm of acceleration, for the parameters considered. Moreover, the emittance of the newly generated PWFA beam can be on the order of hundred nanometers, at the same time that its current can reach values of tens of kiloamps, as required for optimum beam loading. The brightness enhancement of the PWFA beam with respect to the LWFA beam can be about five orders of magnitude.
II.1 First stage: LWFA with ionization injection
A first PIC simulation employing the code OSIRIS Fonseca2002 ; Fonseca2008 ; Fonseca2013 was performed for the LWFA stage. For the drive laser, we considered a Ti:Sa system (), with a peak power of . The parameters of the laser in the simulation resemble those of the DRACO laser system Schramm2017 at HZDR (Helmholtz-Zentrum Dresden-Rossendorf), which was successfully utilized to perform LWFA experiments with ionization-injection Couperus2017 ; Irman2018 . The laser intensity envelope is Gaussian in both longitudinal and transverse directions. The pulse duration (fwhm) is , while the spot size at focus (waist) is , yielding a peak normalized vector potential of , which correspond to a peak intensity of . The total energy in the laser pulse amounts to . The laser is linearly polarized in the direction. The plasma density was chosen to be in order to provide near-resonance wakefield excitation (, with , the rms length of the laser pulse) and relativistic self-guiding () of the laser intensity envelope Lu2007 . The plasma profile starts with a short Gaussian up ramp (shorter than the plasma wavelength) from vacuum to the plateau density at . Then the plasma density continues uniform at for the rest of the simulation. The first part of the plasma profile is doped at with nitrogen (N), up to from the start of the plateau.
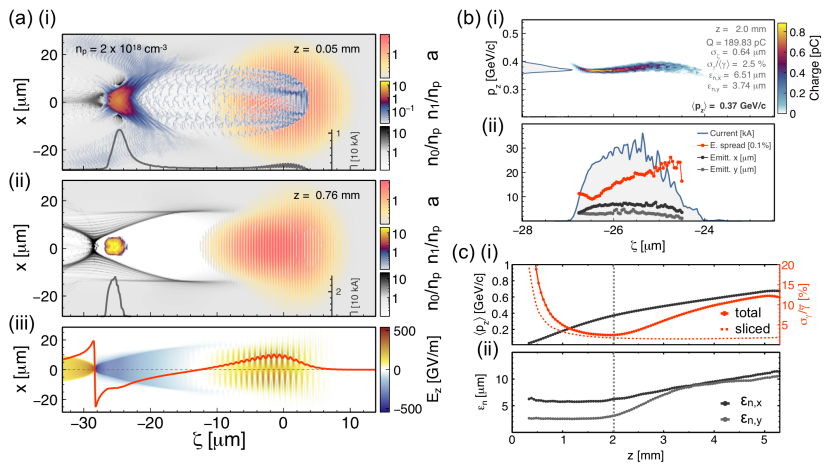
Figure 2(a) (top) shows a snapshot of the simulation when the drive laser is traversing the doped section. The electron densities of the plasma and the high levels ( and ) of nitrogen are shown. The low levels of nitrogen were not included in the simulation as they play a negligible role in the injection process and including them substantially increases the computational cost. Figure 2(a) (middle) shows another snapshot after the dopant section has been passed, at a propagation distance of after the start of the density plateau. A witness beam has been injected, composed by electrons from the high levels of nitrogen. The current profile of this beam is also shown as a dark gray line. This beam features a peak current of , charge and duration (fwhm). Figure 2(a) (bottom) shows the longitudinal electron field also at . The accelerating field over the witness bunch at this point is around .
Figure 2(b) shows in details the phase space of the witness bunch after of propagation. The average energy of the beam is , and therefore, the average accelerating field up to this point is around . The total energy spread is , while the sliced energy spread is around . Further acceleration of the witness beam is still possible since the system did not reach neither the dephasing nor the depletion length, the two main limiting factors to the energy gain of the witness beam in an LWFA Lu2007 . According to the scalings for short and intense drive lasers operating in the non-linear regime under self-guiding conditions Lu2007 , the acceleration distance is limited to the pump-depletion length in this case: , while the average accelerating field, accounting for dephasing, is . Thus, the expected total energy gain after the pump-depletion length is approximately given by . We note that this expression for holds for a beam-unloaded case. However, the simulation shown in here is optimized for the production of high-current witness beam, and thus, there is a substantial beam-loading effect, which overall diminishes the high slope of the accelerating gradient along the witness beam. As a consequence, the maximum energy gain in the witness beam is observed after only of propagation, reaching values of .
| Plasma density | |||
|---|---|---|---|
| Laser peak intensity | |||
| Laser spot size (norm.) | |||
| Laser pulse duration (norm.) | |||
| Laser power | |||
| Laser energy | |||
| Acceleration distance | |||
| Accelerating field | |||
| Beam energy (mean) | |||
| Beam charge | |||
| Beam current | |||
| Beam duration (fwhm) | |||
| Beam norm. emittance | |||
| Beam rel. energy spread |
The time evolution of the witness beam parameters is shown in Figure 2 (c). The minimum relative energy spread is reached after of propagation. At this point the plasma wakefields are well beam loaded by the witness beam, and therefore, its total energy spread is relatively low () and comparable to the slice energy spread (). However, due to the beam dephasing effect and the laser diffraction, the optimal beam-loading conditions do not hold over the whole propagation, leading to the increase of the correlated energy spread (energy chirp) as the beam is further accelerated. The projected normalized emittance of the beam is also shown in Figure 2 (c). Initially the emittance is approximately two times higher in the laser polarization plane, reaching values of . However, as the drive laser diffracts, the generated plasma wakefields diminish in intensity and the blowout formation is not complete. Due to the presence of plasma electrons in the first plasma oscillation bucket, the witness beam alters the plasma currents by means of its space-charge fields, generating in this way a longitudinal variation of the focusing, which in turns causes an increase of the projected emittance in both transverse planes.
In summary, we show by means of a PIC simulation that electron beams with tens of and hundreds of can be produced in an LWFA with ionization injection, when employing a peak power laser system. These results are in good agreement with recent experiments Couperus2017 ; Irman2018 ; Li2017 . In particular, in ref. Couperus2017 it is shown that by controlling the amount of injected charge, e.g. by changing the concentration of the dopant, optimal beam-loading conditions could be found for the production of charge electron beams, with average energy and relative energy spread.
Scaling results to petawatt power lasers
In this section we show by means of well-known scaling rules Lu2007 that by employing higher power lasers, these results can be extrapolated to the production of longer beams with higher charges, and with average energies in the multi-GeV range. In particular, we show an example for the EuPRAXIA design study Walker2017 , which considers a drive laser pulse with peak power operating a plasma at a 10 times smaller density, i.e. . Performing a new PIC simulation for these parameters would require to increase the longitudinal resolution by a factor , which together with the corresponding increase in the time resolution (factor ) and the propagation distance (factor ), would require about a factor more computing power, making this task extremely costly. For this reason, we rely on scaling rules to estimate the results when the plasma density is varied, while keeping , , and of the drive laser constant. Since the sizes of the laser pulse are kept constant relative to the plasma wavelength, the laser peak power scales as for a constant , while the total energy in the pulse, , follows a dependency. On the other hand, the laser propagation distance in plasma goes as , while the accelerating wakefield does as . Therefore, the final energy of the witness beam scales as .
Taking as a reference the witness beam generated in the 3D LWFA simulation described in Section II.1, we summarize in Table 1 the expected beam parameters when the process is initiated by a PW-class Ti:Sa laser in a plasma with density. The corresponding laser pulse driving the process would have then the following parameters: , and . is kept fixed and equals to for a Ti:Sa laser. The total energy in the pulse would be then . For the produced witness beam, we estimate an energy gain of after a propagation distance of . This is the equivalent distance at which the witness beam had the lowest energy spread in the simulated case (cf. Figure 2 (c)). The current profile of the witness beam remains the same for the same degree of beam loading Tzoufras2008 , but its length scales as , leading to a long (fwhm) beam. Also the total charge, , scales as the beam length, yielding . The normalized emittance of the witness beam, , is essentially defined by the transverse extension of the initial distribution of the ionized electrons Kirby2009 ; Schroeder2014 , and therefore is expected to also scale as , yielding for the extrapolated case. Assuming that the total energy spread is dominated by the energy chirp imprinted in the bunch due to a non-uniform accelerating field along the beam, we expect this quantity to scale as the energy gain , and therefore, the relative energy spread would remain unchanged. We note that the total energy stored in the witness beam, given by , scales as the laser pulse energy, and therefore, the laser-to-beam energy transfer efficiency remains constant.
II.2 Second stage: PWFA with wakefield-induced ionization injection
In this section we present an exemplary PIC simulation that shows that electron beams with the same properties than those produced in LWFAs with ionization injection can indeed be utilized as drivers of a PWFA. In this LWFA-driven PWFA (LPWFA) stage, a new witness beam of largely superior quality is injected by means of wakefield-induced ionization (WII) injection MartinezdelaOssa2013 ; MartinezdelaOssa2015 and then accelerated to substantially higher energies within few cm of propagation.
In the simulation, the parameters of the drive beam are as follows: charge, duration and a peak current of . Based on the LWFA simulation presented in section II.1 and supported by the experiments performed at HZDR with a laser pulse Couperus2017 ; Irman2018 , we assume that an electron beam with these characteristics could be produced by a near PW-class laser system operating an LWFA at a plasma density close to (see section II.1). Thus, we further assume that the average energy of this beam could be , with relative energy spread, and that the normalized emittance is . For simplicity, the relative energy spread is considered time uncorrelated in the simulation. The charge distribution of the beam is initialized Gaussian in every phase-space dimension and cylindrically symmetric with respect to the propagation axis. The transverse rms size of the beam is at waist, when entering into the plasma. This assumption neglects any drift between the two plasma stages, and considers that the laser is completely removed/reflected by a plasma-mirror Thaury2007 ; Steinke2016 , while the electron beam goes through with negligible impact on its transverse size and emittance. In the simulation, the plasma profile and the dopant section are also idealized with the aim to explore the potential of this approach. The plasma profile starts with a short Gaussian up-ramp from vacuum to the plateau density at . Then the plasma density continues uniform at for the rest of the simulation. The first part of the plasma profile is doped at with helium (He), up to only from the start of the plateau.
| Driver (before PWFA) | Witness (after PWFA) | |
|---|---|---|
| Charge | ||
| Average energy | ||
| Energy spread | ||
| Average sliced energy spread | ||
| Normalized emittance | ||
| Duration (fwhm) | ||
| Current | ||
| Brightness |
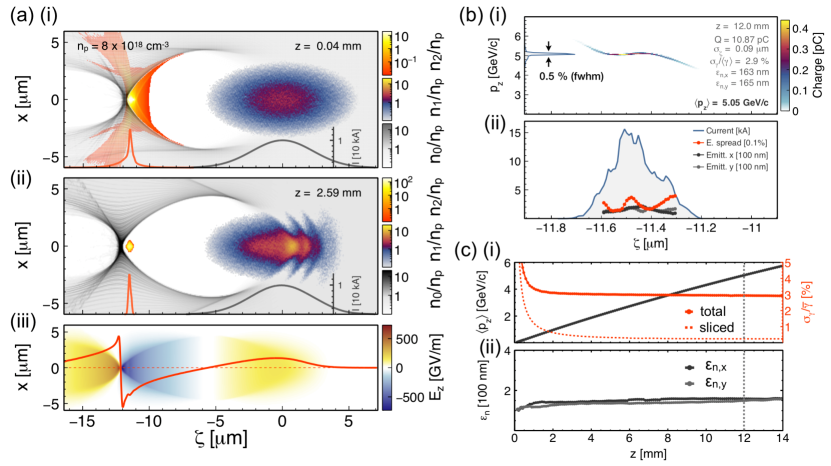
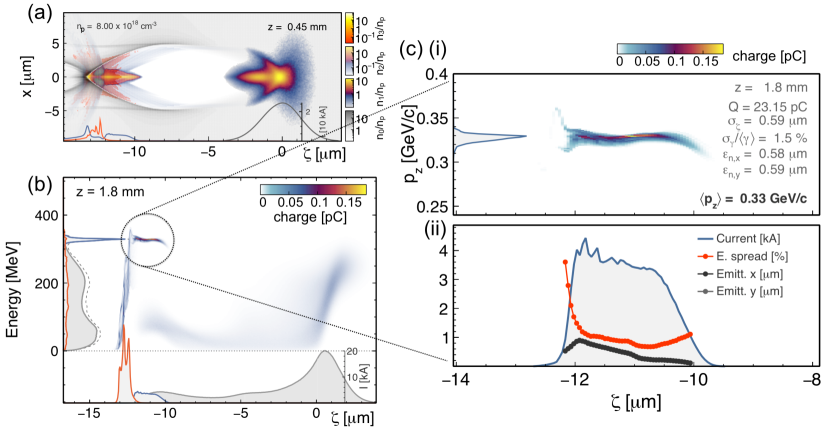
Figure 3(a) (top) shows a snapshot of the simulation when the drive beam is traversing the dopant section. In this simulation both the hydrogen and the first level of helium are assumed preionized, while the second ionization level of helium () is kept non ionized. This could be achieved by means of a counter-propagating low-intensity laser for selective ionization (cf. Figure 1). The strong accelerating field at the back of the blowout cavity is responsible for the ionization of and the subsequent trapping of a high-quality electron beam MartinezdelaOssa2013 ; MartinezdelaOssa2015 . Figure 3(a) (middle) shows another snapshot of the simulation after the dopant section has been passed, at a propagation distance of after the start of the density plateau. The witness beam features a peak current of , charge and duration (fwhm). Figure 3(a) (bottom) shows the longitudinal electric field also at . The accelerating field over the witness at this point is , while the maximum decelerating field on the driver is . The ratio of these two quantities defines the transformer ratio, , which provides a measure of the maximum energy gain of the witness beam as a function of the initial energy of the driver , under the assumption that the wakefields remain at this state up to the energy depletion of the driver. The WII injection method exploits precisely this high transformer ratio ( is considered high for values bigger than 2) in order to induce ionization and trapping from and into the extreme accelerating fields of the plasma wake, while avoiding any spurious injection caused by the drive beam. This allows the initial phase-volume of the trapped electrons to be constrained to a well-defined phase-range of the wakefields, which in turn, results in the generation of high-quality witness beams MartinezdelaOssa2013 ; MartinezdelaOssa2015 .
Figure 3(b) shows the witness beam phase space after of propagation. The average longitudinal momentum of the beam is , while the projected normalized emittance is preserved around in both transverse planes. The total relative energy spread of the witness beam is in total, but only within the fwhm of the energy peak. The average sliced relative energy spread is around . This means that although the high-current witness beam partially flattens the accelerating fields within its central part by means of beam loading, the residual energy chirp at the head and tail contributes significantly to the overall energy spread. Figure 3(c) shows the evolution of the witness beam parameters as a function of the propagation distance, featuring an essentially constant energy gain rate, derived from the unique wakefield stability of PWFAs in the blowout regime. We observe that the energy of the witness doubles the initial energy of the driver after around of propagation, yielding an average energy of . The evolution of the relative energy spread reflects stable beam-loading conditions over the whole propagation distance shown in Figure 3(c). Also the projected normalized emittance of the witness exhibits great stability, as a result of the uniformity of the focusing fields and the low energy spread of the beam. In comparison with the evolution of the witness beam in the LWFA stage (Figure 2(c)), the PWFA stage shows a greatly improved stability on the accelerating conditions.
In summary, this simulation result strongly supports the concept that high-current electron beams produced in LWFAs can indeed drive strong plasma wakefields themselves, where a new witness of dramatically improved quality can be injected and accelerated to much higher energies. For the parameters here considered, Table 2 summarizes the properties of the LWFA-produced drive beam against the newly PWFA-produced witness beam. In particular, the brightness of the witness beam, , is increased by about five orders of magnitude.
III Simulation for the proof-of-concept experiment at HZDR
Motivated by the promising simulations results shown in section II, we are currently exploring the experimental feasibility of this concept. With this purpose, a proof-of-concept experiment has been implemented at HZDR Heinemann2017 , using the DRACO Schramm2017 laser system for the LWFA stage and the thereby produced electron beam as driver for a subsequent PWFA stage. As a proof-of-concept, the first goal of the experiment is to demonstrate the injection and acceleration of a new witness beam in the PWFA stage driven by the LWFA beam. Ultimately, the resulting PWFA beam is ought to feature a substantially higher energy and brightness than the initial LWFA beam.
The experimental setup consists of two consecutive supersonic gas jets, one for the generation of a high-current electron beam in an LWFA stage driven by the DRACO laser, and a second jet for the injection of a new electron beam in a PWFA stage, driven by the previously produced electron beam (Figure 4). A thin ribbon made of kapton, of thickness, is placed at the entrance of the second jet, aiming to reflect the main laser from the second stage, while letting the electron beam go through with a minimal impact on its transverse size and emittance. The first LWFA stage has been already proven to provide electron beams of charge, energy spread and with average energies around , with an excellent shot-to-shot stability Couperus2017 . The second stage will use this LWFA beam to subsequently drive a PWFA, where a new witness electron beam is generated.
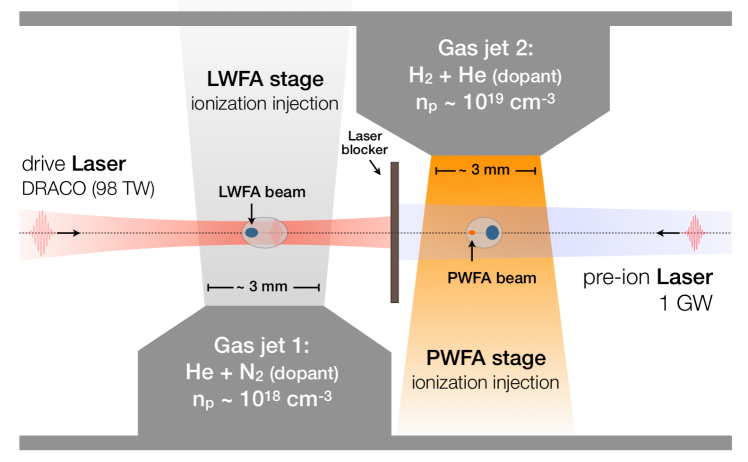
Recent measurements based on coherent transition radiation indicate that the electron beams produced in the LWFA stage have a duration between 10 and 20 fs, suggesting peak currents between 15 and 30 kA. These high currents are more than sufficient to enable a strong blowout wakefield in the second stage, that allows trapping of electrons generated by field ionization MartinezdelaOssa2015 . Due to the short duration of the electron beam from the LWFA stage, the plasma density needs to be increased in the second jet for near-resonance wakefield excitation, within the range. Operating the PWFA near the resonant wakefield excitation facilitates the trapping capabilities and maximizes the accelerating gradient MartinezdelaOssa2017 . One crucial aspect towards the realization of such a staging experiment is the transition from the LWFA to the PWFA process, particularly the recapturing of the initially diverging LWFA output in the following plasma section. This can be achieved by means of the self-driven transverse wakefields in the second plasma. Assuming that the electron beams leave the first stage at waist, their transverse rms size, , after a drift in vacuum of length can be calculated through the expression , where and are the transverse rms size and divergence of the beam when leaving the plasma. After the first jet, the electron beams have been measured to have divergence, while their transverse size before leaving the plasma is inferred from PIC simulations and betatron source size measurements Kohler2016 to be around . This combined determination of the divergence and the spot size of the beam at the focus allows an estimation of the normalized emittance of the beam, which yields . Preliminary PIC simulations considering these beams have shown that a separation between jets up to could be tolerated Heinemann2017 . For distances smaller than this, the electron beams emerging from the first stage are expected to keep its transverse size below (rms), which is still sufficiently small to enable beam self-ionization of the hydrogen gas, for the generation of the plasma and the self-driven focusing wakefields. The maximum transverse electric field generated by a beam with a Gaussian and symmetric transverse distribution is given by , which for a beam with and yields , largely above the ionization threshold of hydrogen. According to the ADK field-ionization model Ammosov1986 adopted in the PIC simulations, an electric field value of induces a ionization probability rate of on hydrogen. Still, a counter-propagating low-intensity laser can be used in order to fully preionize the hydrogen to facilitate the beam refocusing and enhance the blowout formation in the second stage. In addition, the pre-ionization laser can be used for selective ionization of certain low-ionization threshold levels of the selected dopant species, e.g. the first level of helium.
In the following we present results from a PIC simulation for the LPWFA stage, considering the experimental setup described above, and where the witness electron beam is generated by means of WII injection MartinezdelaOssa2013 ; MartinezdelaOssa2015 . We note that such an experimental setup could be also compatible with other injection techniques for the generation of high-quality witness beams Hidding2012 ; Li2013 ; MartinezdelaOssa2013 ; MartinezdelaOssa2015 ; Wittig2015 ; MartinezdelaOssa2017 ; Manahan2017 . In the simulation, the distribution of the beam is Gaussian in every phase-space dimension, and cylindrically symmetric with respect to the propagation axis. The beam parameters are as follows: average energy with energy spread, charge, duration, peak current and normalized emittance (these values are in good agreement with measurements and PIC simulations Couperus2017 ). Based on the geometrical constrains of the experiment, we considered a distance between the two plasma stages of , and therefore, the drive beam is initialized with a transverse size of , right at the entrance of the second plasma. For the plasma target we have considered a longitudinal flat-top profile for the gas distribution in the second jet. The gas itself consists of hydrogen doped with helium at concentration. The hydrogen is considered fully preionized over the total section of the jet by a large spot size and low intensity laser, capable of fully ionizing the hydrogen (), but not the helium (). This configuration is different from the simulated case shown in section II.2, where also the first level of helium was assumed preionized. The hydrogen plasma density at the plateau is . Figure 5 (a) shows a snapshot of the simulation after of propagation. At this point the drive beam has been fully refocused into the blowout regime. As a result of this process, an electron bunch composed by electrons ionized from the first level of helium has been trapped. The trapping of this electron species happens during the transverse focusing of the beam, which induces a rapid elongation of the blowout cavity. Due to this cavity elongation, the trapped electrons span a wider phase range, making possible the generation of longer beams. Another consequence of this process is the self-truncation of the injection. In this setup the length of the dopant section is not constrained as in the example shown in section II.2. Therefore, it is expected to have continuous injection at the back of the cavity until the accelerating fields are fully saturated. In fact, this effect is observed in the simulation for the electrons ionized from the second level of helium. However, due to the cavity elongation during the focusing, these electrons are being trapped behind the previously injected beam, and thus, they do not overlap time nor influence the quality of the primarily injected beam.
Figure 5 (b) shows the combined longitudinal phase space of the driver and the injected electrons, after of propagation. At this point the driver is already partly depleted, as a substantial fraction of its electrons lost their kinetic energy, while the primary injected bunch reaches an average energy of ( higher than the initial energy of the driver), within a quasi-monochromatic peak of only energy spread. With more details, we show in Figure 5 (c) the longitudinal phase space of the witness beam, featuring , duration and an approximately flat-top current profile. The projected normalized emittance of the beam is , an order of magnitude smaller than the initial emittance of the driver beam produced in the LWFA stage. The sliced normalized emittance is also shown in Figure 5 (c) (bottom), exhibiting values of around in its frontal part. The sliced relative energy spread reaches sub-percent levels along the full length of the bunch.
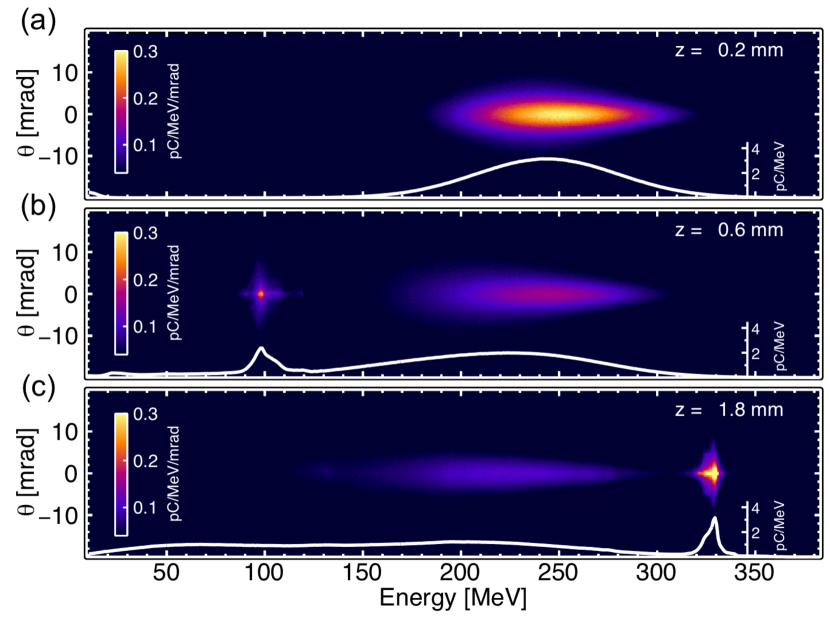
Figure 6 shows the distribution of the driver and witness beams in the divergence vs. energy plane, for three lengths of propagation in the second stage. Figure 6 (a) shows the system after only of propagation, where we can see the imprint of the large energy spread driver only, peaking at energy. In Figure 6 (b), the newly injected witness beam can be clearly seen at after of propagation. Finally, Figure 6 (c) shows the witness beam at after of acceleration, together with the energy depleted drive beam. The non-overlapping energy distributions of driver and witness allow for clear observation in experimental realizations.
Experimental studies of the idealized schemes outlined here are of high importance beyond proving the general feasibility of LPWFAs. In particular, evaluating the sensitivity of the final beam parameters on the experimental conditions will be critical for assessing the importance of such schemes for future applications Walker2017 . For this, realistic start-to-end simulations and numerical sensitivity studies - that are beyond the scope of this work - will be necessary to evaluate the robustness and scalability of the schemes sketched here.
IV Conclusion
In conclusion, we have presented and discussed a conceptual design for an LWFA-driven PWFA (LPWFA), aiming at producing a new generation of beams with substantially improved energy, and especially, brightness. The concept is supported by 3D PIC simulations for both LWFA and PWFA stages, demonstrating that ultra-short and low-emittance beams could be produced in a PWFA stage driven by a relativistic high-current beam produced in an LWFA. The expected increase in brightness can be of about five orders of magnitude, therefore offering an attractive path to the production of GeV-class, ultra-high-brightness beams for applications in high-energy physics and photon science. Remarkably, the experimental design is comparably simple, as the two plasma stages can be concatenated without requiring external coupling elements, thus avoiding complications which would arise from the implementation of sophisticated beam transport optics between stages. Finally, we have presented first simulations for the LPWFA proof-of-concept experiment at HZDR, in which we expect to demonstrate that LWFA witness beams can indeed be used as PWFA drivers for the production of a new class of electron beams with dramatically improved brightness and energy spread.
- Data Accessibility
-
The simulation data supporting this study takes about 1TB of information and it is stored in the DESY data servers. It could be accessed through the corresponding author upon reasonable request.
- Authors’ Contributions
-
A.M.O. conceived the idea, performed the simulations, the analysis and wrote the manuscript. A.F.P. and T.H. contributed to the writing of the manuscript. A.D., R.P., A.F.P. and T.H. contributed to the simulation work. J.P.C.C., T.H., O.K., T.K., A.M.O. and A.I. designed and developed the LPWFA proof-of-concept experiment at HZDR. R.W.A, M.B., S.C., A.D., A.D., M.F.G., B.H., S.K., O.K., J.O. and U.S. reviewed the article and contributed to the final version of the text. All authors gave final approval for publication.
- Competing Interests
-
The authors declare no competing interests.
- Funding
-
This work used computational time, granted by the Jülich Supercomputing Center, on JUQUEEN and JUWELS machines under Projects No. HHH23 and No. HHH45, respectively.
- Acknowledgements
-
We thank the OSIRIS consortium (IST/UCLA) for access to the OSIRIS code. Furthermore, we acknowledge the use of the High-Performance Cluster (Maxwell) at DESY. A.M.O. acknowledges the Helmholtz Virtual Institute VH-VI-503, for financial support, and EuPRAXIA for scientific advisory.
References
- (1) T. Tajima and J. Dawson, Phys. Rev. Lett. 43, 267 (1979).
- (2) V. I. Veksler, Conf. Proc. CERN (1956).
- (3) P. Chen, J. M. Dawson, R. W. Huff, and T. Katsouleas, Phys. Rev. Lett. 54, 693 (1985).
- (4) P. Chen, Part. Accel. 20, 171 (1987).
- (5) J. B. Rosenzweig, B. Breizman, T. C. Katsouleas, and J. J. Su, Phys. Rev. A44, R6189 (1991).
- (6) K. V. Lotov, Phys. Rev. E69, 046405 (2004).
- (7) W. Lu, C. Huang, M. Zhou, W. B. Mori, and T. Katsouleas, Phys. Rev. Lett. 96, 165002 (2006).
- (8) A. G. R. Thomas, Z. Najmudin, S. P. D. Mangles, C. D. Murphy, A. E. Dangor, C. Kamperidis, K. L. Lancaster, W. B. Mori, P. A. Norreys, W. Rozmus, and K. Krushelnick, Phys. Rev. Lett. 98, 095004 (2007).
- (9) W. Lu, M. Tzoufras, and C. Joshi, F. S. Tsung, W. B. Mori, J. Vieira, R. A. Fonseca, and L. O. Silva, Phys. Rev. ST Accel. Beams 10, 061301 (2007).
- (10) D. J. Spence and S. M. Hooker, Phys. Rev. E 63, 015401 (2000).
- (11) R. J. Shalloo, C. Arran, L. Corner, J. Holloway, J. Jonnerby, R. Walczak, H. M. Milchberg, and S. M. Hooker, Phys. Rev. E 97, 053203 (2018).
- (12) M. J. V. Streeter, S. Kneip, M. S. Bloom, R. A. Bendoyro, O. Chekhlov, A. E. Dangor, A. Döpp, C. J. Hooker, J. Holloway, J. Jiang, N. C. Lopes, H. Nakamura, P. A. Norreys, C. A. J. Palmer, P. P. Rajeev, J. Schreiber, D. R. Symes, M. Wing, S. P. D. Mangles, and Z. Najmudin, Phys. Rev. Lett. 120, 254801 (2018).
- (13) K. V. Lotov, Phys. Plasmas 12, 053105 (2005).
- (14) M. Tzoufras, W. Lu, F. S. Tsung, C. Huang, W. B. Mori, T. Katsouleas, J. Vieira, R. A. Fonseca, and L. O. Silva, Phys. Rev. Lett. 101, 145002 (2008)
- (15) B. Hidding, G. Pretzler, J. B. Rosenzweig, T. Königstein, D. Schiller, and D. L. Bruhwiler, Phys. Rev. Lett. 108, 035001 (2012).
- (16) F. Li, J. F. Hua, X. L. Xu, C. J. Zhang, L. X. Yan, Y. C. Du, W. H. Huang, H. B. Chen, C. X. Tang, W. Lu, C. Joshi, W. B. Mori, and Y. Q. Gu, Phys. Rev. Lett. 111, 015003 (2013).
- (17) A. Martinez de la Ossa, J. Grebenyuk, T. J. Mehrling, L. Schaper, and J. Osterhoff, Phys. Rev. Lett. 111, 245003 (2013).
- (18) A. Martinez de la Ossa, T. J. Mehrling, L. Schaper, M. J. V. Streeter, and J. Osterhoff, Phys. Plasmas 22 093107 (2015).
- (19) G. Wittig, O. Karger, A. Knetsch, Y. Xi, A. Deng, J. B. Rosenzweig, D. L. Bruhwiler, J. Smith, G. G. Manahan, Z.-M. Sheng, D. A. Jaroszynski, and B. Hidding, Phys. Rev. ST Accel. Beams 18, 081304 (2015).
- (20) A. Martinez de la Ossa, Z. Hu, M. J. V. Streeter, T. J. Mehrling, O. Kononenko, B. Sheeran, and J. Osterhoff, Phys. Rev. Accel. Beams 20, 091301 (2017).
- (21) G. G. Manahan, A. F. Habib, P. Scherkl, P. Delinikolas, A. Beaton, A. Knetsch, O. Karger, G. Wittig, T. Heinemann, Z. M. Sheng, J. R. Cary, D. L. Bruhwiler, J. B. Rosenzweig, and B. Hidding, Nature Comm. 8, 15705 (2017).
- (22) M. J. Hogan, T. O. Raubenheimer, A. Seryi, P. Muggli, T. Katsouleas, C. Huang, W. Lu, W. An, K. A. Marsh, W. B. Mori, C. E. Clayton, and C. Joshi, New J. Phys. 12, 055030 (2010).
- (23) A. Aschikhin, C. Behrens, S. Bohlen, J. Dale, N. Delbos, L. di Lucchio, E. Elsen, J.-H. Erbe, M. Felber, B. Foster, L. Goldberg, J. Grebenyuk, J.-N. Gruse, B. Hidding, Z. Hu, S. Karstensen, A. Knetsch, O. Kononenko, V. Libov, K. Ludwig, A. Maier, A. Martinez de la Ossa, T. Mehrling, C. Palmer, F. Pannek, L. Schaper, H. Schlarb, B. Schmidt, S. Schreiber, J.-P. Schwinkendorf, H. Steel, M. Streeter, G. Tauscher, V. Wacker, S. Weichert, S. Wunderlich, J. Zemella, and J. Osterhoff, Nucl. Instrum. Methods Phys. Res. A 806, 175 (2016).
- (24) D. Strickland, and G. Mourou, Optics Comm. 56, 3 (1985).
- (25) S. P. D. Mangles, C. D. Murphy, Z. Najmudin, A. G. R. Thomas, J. L. Collier, A. E. Dangor, E. J. Divall, P. S. Foster, J. G. Gallacher, C. J. Hooker, D. A. Jaroszynski, A. J. Langley, W. B. Mori, P. A. Norreys, F. S. Tsung, R. Viskup, B. R. Walton, and K. Krushelnick, Nature 431, 535 (2004).
- (26) C. G. R. Geddes, Cs. Toth, J. van Tilborg, E. Esarey, C. B. Schroeder, D. Bruhwiler, C. Nieter, J. Cary, and W. P. Leemans, Nature 431, 538 (2004).
- (27) J. Faure, Y. Glinec, A. Pukhov, S. Kiselev, S. Gordienko, E. Lefebvre, J.-P. Rousseau, F. Burgy, and V. Malka, Nature 431, 541 (2004).
- (28) W. P. Leemans, B. Nagler, A. J. Gonsalves, Cs. Tóth, K. Nakamura, C. G. R. Geddes, E. Esarey, C. B. Schroeder, and S. M. Hooker, Nat. Phys. 2, 696 (2006).
- (29) X. Wang, R. Zgadzaj, N. Fazel, Z. Li, S. A. Yi, X. Zhang, W. Henderson, Y.-Y. Chang, R. Korzekwa, H.-E. Tsai, C.-H. Pai, H. Quevedo, G. Dyer, E. Gaul, M. Martinez, A. C. Bernstein, T. Borger, M. Spinks, M. Donovan, V. Khudik, G. Shvets, T. Ditmire, and M. C. Downer, Nature Comm. 4, 1988 (2013).
- (30) W. P. Leemans, A. J. Gonsalves, H.-S. Mao, K. Nakamura, C. Benedetti, C. B. Schroeder, Cs. Tóth, J. Daniels, D. E. Mittelberger, S. S. Bulanov, J.-L. Vay, C. G. R. Geddes, and E. Esarey, Phys. Rev. Lett. 113, 245002 (2014).
- (31) J. Osterhoff, A. Popp, Zs. Major, B. Marx, T. P. Rowlands-Rees, M. Fuchs, M. Geissler, R. Hörlein, B. Hidding, S. Becker, E. A. Peralta, U. Schramm, F. Grüner, D. Habs, F. Krausz, S. M. Hooker, and S. Karsch, Phys. Rev. Lett. 101, 085002 (2008).
- (32) N. A. M. Hafz, T. M. Jeong, I. W. Choi, S. K. Lee, K. H. Pae, V. V. Kulagin, J. H. Sung, T. J. Yu, K.-H. Hong, T. Hosokai, J. R. Cary, D.-K. Ko, and J. Lee, Nat. Photon. 2, 571 (2008).
- (33) J. Faure, C. Rechatin, A. Norlin, A. Lifschitz, Y. Glinec, and V. Malka Nature 444, 737 (2006).
- (34) T. P. Rowlands-Rees, C. Kamperidis, S. Kneip, A. J. Gonsalves, S. P. D. Mangles, J. G. Gallacher, E. Brunetti, T. Ibbotson, C. D. Murphy, P. S. Foster, M. J. V. Streeter, F. Budde, P. A. Norreys, D. A. Jaroszynski, K. Krushelnick, Z. Najmudin, and S. M. Hooker, Phys. Rev. Lett. 100, 105005 (2008).
- (35) A. Pak, K. A. Marsh, S. F. Martins, W. Lu, W. B. Mori, and C. Joshi, Phys. Rev. Lett. 104, 025003 (2010).
- (36) K. Schmid, A. Buck, C. M. S. Sears, J. M. Mikhailova, R. Tautz, D. Herrmann, M. Geissler, F. Krausz, and L. Veisz, Phys. Rev. ST Accel. Beams 13, 091301 (2010).
- (37) A. J. Gonsalves, K. Nakamura, C. Lin, D. Panasenko, S. Shiraishi, T. Sokollik, C. Benedetti, C. B. Schroeder, C. G. R. Geddes, J. van Tilborg, J. Osterhoff, E. Esarey, C. Toth, and W. P. Leemans, Nat. Phys. 7, 862 (2011).
- (38) A. Buck, J. Wenz, J. Xu, K. Khrennikov, K. Schmid, M. Heigoldt, J. M. Mikhailova, M. Geissler, B. Shen, F. Krausz, S. Karsch, and L. Veisz, Phys. Rev. Lett. 110, 185006 (2010).
- (39) M. Mirzaie, S. Li, M. Zeng, N. A. M. Hafz, M. Chen, G. Y. Li, Q. J. Zhu, H. Liao, T. Sokollik, F. Liu, Y. Y. Ma, L.M. Chen, Z. M. Sheng, and J. Zhang, Scientific Reports 5, 14659 (2015).
- (40) H.-P. Schlenvoigt, K. Haupt, A. Debus, F. Budde, O. Jäckel, S. Pfotenhauer, H. Schwoerer, E. Rohwer, J. G. Gallacher, E. Brunetti, R. P. Shanks, S. M. Wiggins, and D. A. Jaroszynski, Nat. Phys. 4, 130-133 (2008).
- (41) M. Fuchs, R. Weingartner, A. Popp, Z. Major, S. Becker, J. Osterhoff, I. Cortrie, B. Zeitler, R. Hörlein, G. D. Tsakiris, U. Schramm, T. P. Rowlands-Rees, S. M. Hooker, D. Habs, F. Krausz, S. Karsch, and F. Grüner, Nat. Phys. 5, 826 (2009).
- (42) S. Kneip, C. McGuffey, J. L. Martins, S. F. Martins, C. Bellei, V. Chvykov, F. Dollar, R. Fonseca, C. Huntington, G. Kalintchenko, A. Maksimchuk, S. P. D. Mangles, T. Matsuoka, S. R. Nagel, C. A. J. Palmer, J. Schreiber, K. Ta Phuoc, A. G. R. Thomas, V. Yanovsky, L. O. Silva, K. Krushelnick and Z. Najmudin, Nat. Phys. 6, 980 (2010).
- (43) K. Khrennikov, J. Wenz, A. Buck, J. Xu, M. Heigoldt, L. Veisz, and S. Karsch, Phys. Rev. Lett. 114, 195003 (2015).
- (44) A. Döpp, B. Mahieu, A. Lifschitz, C. Thaury, A. Doche, E. Guillaume, G. Grittan, O. Lundh, M. Hansson, J. Gautier, M. Kozlova, J. P. Goddet, P. Rousseau, A. Tafzi, V. Malka, A. Rousse, S. Corde, and K. T. Phuoc, Light: Science & Applications 6, e17086 (2017).
- (45) I. Blumenfeld, C. E. Clayton, F.-J. Decker, M. J. Hogan, C. Huang, R. Ischebeck, R. Iverson, C. Joshi, T. Katsouleas, N. Kirby, W. Lu, K. A. Marsh, W. B. Mori, P. Muggli, E. Öz, R. H. Siemann, D. Walz, and M. Zhou, Nature 445, 741 (2007).
- (46) E. Öz, S. Deng, T. Katsouleas, P. Muggli, C. D. Barnes, I. Blumenfeld, F. J. Decker, P. Emma, M. J. Hogan, R. Ischebeck, R. H. Iverson, N. Kirby, P. Krejcik, C. O’Connell, R. H. Siemann, D. Walz, D. Auerbach, C. E. Clayton, C. Huang, D. K. Johnson, C. Joshi, W. Lu, K. A. Marsh, W. B. Mori, and M. Zhou, Phys. Rev. Lett. 98, 084801 (2007).
- (47) M. Litos, E. Adli, W. An, C. I. Clarke, C. E. Clayton, S. Corde, J. P. Delahaye, R. J. England, A. S. Fisher, J. Frederico, S. Gessner, S. Z. Green, M. J. Hogan, C. Joshi, W. Lu, K. A. Marsh, W. B. Mori, P. Muggli, N. Vafaei-Najafabadi, D. Walz, G. White, Z. Wu, V. Yakimenko, and G. Yocky, Nature 515, 92 (2014).
- (48) S. Corde, E. Adli, J. M. Allen, W. An, C. I. Clarke, C. E. Clayton, J. P. Delahaye, J. Frederico, S. Gessner, S. Z. Green, M. J. Hogan, C. Joshi, N. Lipkowitz, M. Litos, W. Lu, K. A. Marsh, W. B. Mori, M. Schmeltz, N. Vafaei-Najafabadi, D. Walz, V. Yakimenko, and G. Yocky, Nature 524, 442 (2015).
- (49) S. Corde, E. Adli, J. M. Allen, W. An, C. I. Clarke, B. Clausse, C. E. Clayton, J. P. Delahaye, J. Frederico, S. Gessner, S. Z. Green, M. J. Hogan, C. Joshi, M. Litos, W. Lu, K. A. Marsh, W. B. Mori, N. Vafaei-Najafabadi, D. Walz, and V. Yakimenko, Nature Comm. 7, 11898 (2016).
- (50) M. Gross, J. Engel, J. Good, H. Huck, I. Isaev, G. Koss, M. Krasilnikov, O. Lishilin, G. Loisch, Y. Renier, T. Rublack, F. Stephan, R. Brinkmann, A. Martinez de la Ossa, J. Osterhoff, D. Malyutin, D. Richter, T. J. Mehrling, M. Khojoyan, C. B. Schroeder, and F. Grüner, Phys. Rev. Lett. 120, 144802.
- (51) G. Loisch, G. Asova, P. Boonpornprasert, R. Brinkmann, Y. Chen, J. Engel, J. Good, M. Gross, F. Grüner, H. Huck, D. Kalantaryan, M. Krasilnikov, O. Lishilin, A. Martinez de la Ossa, T. J. Mehrling, D. Melkumyan, A. Oppelt, J. Osterhoff, H. Qian, Y. Renier, F. Stephan, C. Tenholt, V. Wohlfarth, and Q. Zhao, Phys. Rev. Lett. 121, 064801
- (52) E. Adli et al., Nature 561, 363 (2018).
- (53) O. Lundh, J. Lim, C. Rechatin, L. Ammoura, A. Ben-Ismaïl, X. Davoine, G. Gallot, J-P. Goddet, E. Lefebvre, V. Malka, and J. Faure Nat. Phys. 7, 219-222 (2011).
- (54) M. Heigoldt, A. Popp, K. Khrennikov, J. Wenz, S. W. Chou, S. Karsch, S. I. Bajlekov, S. M. Hooker, and B. Schmidt, Phys. Rev. ST Accel. Beams 18, 121302 (2015).
- (55) J. P. Couperus, R. Pausch, A. Köhler, O. Zarini, J.M. Krämer, M. Garten, A. Huebl, R. Gebhardt, U. Helbig, S. Bock, K. Zeil, A. Debus, M. Bussmann, U. Schramm, and A. Irman, Nature Comm. 8, 487 (2017).
- (56) A. Irman, J. P. Couperus, A. Debus, A. Köhler, J. M. Krämer, R. Pausch, O. Zarini, and U. Schramm, Plasma Phys. Control. Fusion 60 044015 (2018).
- (57) Y. F. Li, D. Z. Li, K. Huang, M. Z. Tao, M. H. Li, J. R. Zhao, Y. Ma, X. Guo, J. G. Wang, M. Chen, N. Hafz, J. Zhang, and L. M. Chen, Phys. Plasmas 24, 023108 (2017).
- (58) T. J. Mehrling, R. A. Fonseca, A. Martinez de la Ossa, and J. Vieira, Phys. Rev. Lett. 118, 174801 (2017).
- (59) A. Martinez de la Ossa, T. J. Mehrling, and J. Osterhoff, Phys. Rev. Lett. 121, 064803 (2018).
- (60) B. Hidding, T. Königstein, J. Osterholz, S. Karsch, O. Willi, and G. Pretzler, Phys. Rev. Lett. 104, 195002 (2010).
- (61) K. H. Pae, I. W. Choi, and J. Lee, Phys. Plasmas 17, 123104 (2010).
- (62) P. E. Masson-Laborde, M. Z. Mo, A. Ali, S. Fourmaux, P. Lassonde, J. C. Kieffer, W. Rozmus, D. Teychenne, and R. Fedosejevs, Phys. Plasmas 21, 123113 (2014).
- (63) S. Corde, C. Thaury, K. Ta Phuoc, A. Lifschitz, G. Lambert, J. Faure, O. Lundh, E. Benveniste, A. Ben-Ismail, L. Arantchuk, A. Marciniak, A. Stordeur, P. Brijesh, A. Rousse, A. Specka, and V. Malka, Phys. Rev. Lett. 107, 215004 (2011).
- (64) C. F. Dong, T. Z. Zhao, K. Behm, P. G. Cummings, J. Nees, A. Maksimchuk, V. Yanovsky, K. Krushelnick, and A. G. R. Thomas, Phys. Rev. Accel. Beams 21, 041303 (2018).
- (65) J. Ferri, S. Corde, A. Döpp, A. Lifschitz, A. Doche, C. Thaury, K. Ta Phuoc, B. Mahieu, I. A. Andriyash, V. Malka, and X. Davoine, Phys. Rev. Lett. 120, 254802 (2018).
- (66) S. Kuschel, D. Hollatz, T. Heinemann, O. Karger, M. B. Schwab, D. Ullmann, A. Knetsch, A. Seidel, C. Rödel, M. Yeung, M. Leier, A. Blinne, H. Ding, T. Kurz, D. J. Corvan, A. Sävert, S. Karsch, M. C. Kaluza, B. Hidding, and M. Zepf Phys. Rev. Accel. Beams 19, 071301 (2016).
- (67) S. Chou, J. Xu, K. Khrennikov, D. E. Cardenas, J. Wenz, M. Heigoldt, L. Hofmann, L. Veisz, and S. Karsch, Phys. Rev. Lett. 117, 144801 (2016).
- (68) M. F. Gilljohann, H. Ding, A. Döpp, J. Goetzfried, S. Schindler, G. Schilling, S. Corde, A. Debus, T. Heinemann, B. Hidding, S. M. Hooker, A. Irman, O. Kononenko, T. Kurz, A. Martinez de la Ossa, U. Schramm, and S. Karsch, arXiv:1810.11813 (2018).
- (69) R. Fonseca, L. Silva, F. Tsung, V. Decyk, W. Lu, C. Ren, W. Mori, S. Deng, S. Lee, T. Katsouleas, and J. Adam, Notes Comp. Sci. 2331, 342 (2002).
- (70) R. A. Fonseca, S. F. Martins, L. O. Silva, J. W. Tonge, F. S. Tsung, and W. B. Mori, Plasma Phys. Controlled Fusion 50, 124034 (2008).
- (71) R.A. Fonseca, J. Vieira, F. Fiuza, A. Davidson, F. S. Tsung, W. B. Mori, and L. O. Silva, Plasma Phys. Controlled Fusion 55, 124011 (2013).
- (72) Z. Huang, Y. Ding, and C. B. Schroeder Phys. Rev. Lett. 109, 204801 (2012).
- (73) A. R. Maier, A. Meseck, S. Reiche, C. B. Schroeder, T. Seggebrock, and F. Grüner, Phys. Rev. X 2, 031019 (2012)
- (74) B. Hidding, G. G. Manahan, O. Karger, A. Knetsch, G. Wittig, D. A. Jaroszynski, Z.-M. Sheng, Y. Xi, A. Deng, J. B. Rosenzweig, G. Andonian, A. Murokh, G. Pretzler, D. L. Bruhwiler, and J. Smith, J. Phys. B: At. Mol. Opt. Phys. 47 234010 (2014).
- (75) S. Di Mitri, Photonics 2015, 2, 317 (2015).
- (76) U. Schramm et al., J. Phys.: Conf. Ser. 874 012028 (2017).
- (77) P. A. Walker et al., J. Phys.: Conf. Ser. 874 012029 (2017).
- (78) N. Kirby, I. Blumenfeld, C. E. Clayton, F. J. Decker, M. J. Hogan, C. Huang, R. Ischebeck, R. H. Iverson, C. Joshi, T. Katsouleas, W. Lu, K. A. Marsh, S. F. Martins, W. B. Mori, P. Muggli, E. Oz and R. H. Siemann, Phys. Rev. ST Accel. Beams 12, 051302 (2009).
- (79) C. B. Schroeder, J.-L. Vay, E. Esarey, S. S. Bulanov, C. Benedetti, L.-L. Yu, M. Chen, C. G. R. Geddes, and W. P. Leemans, Phys. Rev. ST Accel. Beams 17, 101301 (2014).
- (80) C. Thaury, F. Quéré, J.-P. Geindre, A. Levy, T. Ceccotti, P. Monot, M. Bougeard, F. Réau, P. d’Oliveira, P. Audebert, R. Marjoribanks, and Ph. Martin, Nat. Phys. 3, 424 (2007).
- (81) S. Steinke, J. van Tilborg, C. benedetti, C. G. R. Geddes, C. B. Schroeder, J. Daniels, K. K. Swanson, A. J. Gonsalves, K. Nakamura, N. H. Matlis, b. H. Shaw, E. Esarey, and W. P. Leemans, Nature 530, 190 (2007).
- (82) A. Köhler, J. P.Couperus, O. Zarini, A.Jochmann, A. Irman, and U.Schramm, Nucl. Instrum. Methods Phys. Res. A 829, 265-269 (2016).
- (83) T. Heinemann, R. W. Assmann, J. P. Couperus, B. Hidding, A. Knetsch, O. Kononenko, A. Köhler, T. Kurz, U. Schramm, O. Zarini, A. Irman, and A. Martinez de la Ossa, Proc. IPAC (2017).
- (84) M. V. Ammosov, N. B. Delone, and V. Krainov, Sov. Phys. JETP 64, 1191 (1986).