Ultrafast Hot Phonon Dynamics in MgB2 Driven by Anisotropic Electron-Phonon Coupling
Abstract
The zone-center modes play a crucial role in MgB2, controlling the scattering mechanisms in the normal state as well the superconducting pairing. Here, we demonstrate via first-principles quantum-field theory calculations that, due to the anisotropic electron-phonon interaction, a hot-phonon regime where the phonons can achieve significantly larger effective populations than other modes, is triggered in MgB2 by the interaction with an ultra-short laser pulse. Spectral signatures of this scenario in ultrafast pump-probe Raman spectroscopy are discussed in detail, revealing also a fundamental role of nonadiabatic processes in the optical features of the mode.
Although MgB2 is often regarded as a conventional high- superconductor, described by the Eliashberg theory for phonon-mediated superconductivity, it displays many peculiar characteristics that make it a unique case. Most remarkable is the anisotropy of the electronic and superconducting properties, where electronic states belonging to the bands are strongly coupled to phonons, and display thus large superconducting gaps , whereas electronic states associated with the bands are only weakly coupled to the lattice, and hence exhibit small superconducting gaps Liu et al. (2001); Choi et al. (2002a, b); Kong et al. (2001); Golubov et al. (2002); Giubileo et al. (2001); Tsuda et al. (2001); Chen et al. (2001); Gonnelli et al. (2002); Mou et al. (2015). Such electronic anisotropy is also accompanied by a striking anisotropy in the phonon states. The electron-phonon (e-ph) coupling is indeed strongly concentrated in few in-plane phonons modes along the path of the Brillouin zone Kong et al. (2001); An and Pickett (2001); Yildirim et al. (2001), whereas the remaining e-ph coupling is spread over all other lattice modes in the Brillouin zone.
Due to its pivotal role in ruling e-ph based many-body effects and in the superconducting pairing, the properties of the long-wavelength mode have been extensively investigated, both theoretically and experimentally Yildirim et al. (2001); Bohnen et al. (2001); Hlinka et al. (2001); Goncharov et al. (2001); Postorino et al. (2001); Renker et al. (2002); Quilty et al. (2002); Martinho et al. (2003); Shi et al. (2004); Castro et al. (2006); Shukla et al. (2003); Boeri et al. (2002); Profeta et al. (2003); Lazzeri et al. (2003); Calandra and Mauri (2005); Boeri et al. (2005); Cappelluti (2006); Simonelli et al. (2009); Novko (2018). On the experimental side, Raman spectroscopy has proven particularly suitable for providing fundamental information on the lattice dynamics and on the many-body e-ph processes. Particularly debated is the origin of the large phonon linewidth meV, and of the temperature dependence of both the phonon frequency and linewidth Yildirim et al. (2001); Bohnen et al. (2001); Hlinka et al. (2001); Goncharov et al. (2001); Postorino et al. (2001); Renker et al. (2002); Quilty et al. (2002); Martinho et al. (2003); Shi et al. (2004); Castro et al. (2006); Shukla et al. (2003); Boeri et al. (2002); Profeta et al. (2003); Lazzeri et al. (2003); Calandra and Mauri (2005); Boeri et al. (2005); Cappelluti (2006); Simonelli et al. (2009); Novko (2018). The complexity of identifying the quantum-mechanical origin of these phenomena arises from the concomitance of the e-ph interaction, non-adiabaticity, and lattice anharmonicities, in turn responsible for phonon-phonon scattering and thermal expansion. A possible path for tuning selectively only one of these processes is thus highly desirable, in order to disentangle the different mechanisms in action.
Ultrafast time-resolved optical characterizations of MgB2 with a pump-probe setup were presented in Refs. Xu et al. (2003); Demsar et al. (2003); Baldini et al. (2017), where two different relaxation times were identified in the normal states. In particular, the observed anomalous blueshift at a short time scale of the in-plane plasmon was qualitatively explained in Ref. Baldini et al. (2017) by assuming that the mode behaves as a hot phonon, i.e., a lattice mode with larger population compared with the thermal distribution of the other lattice degrees of freedom (DOFs), in analogy with what was recently observed in graphite and graphene Yan et al. (2009); Berciaud et al. (2010); Chae et al. (2010); Butscher et al. (2007); Wang et al. (2010); Scheuch et al. (2011); Huang et al. (2011); Wu et al. (2012); Ferrante et al. (2018). A similar scenario was suggested in Ref. Demsar et al. (2003). However, the actual observation of hot-phonon physics in MgB2 was quite indirect, and further compelling evidence is needed.
In this Letter we present a detailed theoretical investigation of the time-resolved Raman spectroscopy of the mode in a pump-probe setup. Using ab-initio and quantum-field-theory techniques, we predict that non-equilibrium processes in MgB2 are dominated by strong hot-phonon physics. Several detailed experimental characterizations are suggested which can provide a direct and decisive evidence of the hot-phonon dynamics. It is worth stressing that, unlike graphene where the hot-phonon physics stems from the reduced phase space available for e-ph scattering (due to the vanishing Fermi area at the Dirac points) Yan et al. (2009); Berciaud et al. (2010); Chae et al. (2010); Butscher et al. (2007); Wang et al. (2010); Scheuch et al. (2011); Huang et al. (2011); Wu et al. (2012); Ferrante et al. (2018), the hot-phonon properties in MgB2 are ruled by the strong anisotropy of the e-ph coupling, with the most of the coupling strength being concentrated in few phonon modes at the Brillouin zone center. Such new theoretical paradigm for inducing hot-phonon physics is not limited to MgB2 but it is quite general, and it can be applied to different materials in order to elucidate the time-resolved infrared spectroscopy of the zone-center phonon modes in general. Our work paves the way for a direct experimental check of hot-phonons in MgB2 and in other similar materials characterized by a strongly anisotropic e-ph coupling.
Density-functional theory calculations were performed by using the quantum espresso package Giannozzi et al. (2009). Norm-conserving pseudopotentials were employed with the Perdew-Burke-Ernzerhof exchange-correlation functional Perdew et al. (1996). A Monkhorst-Pack grid in momentum space and a plane-wave cutoff energy of 60 Ry were used for ground-state calculations. The phonon dispersion was calculated on a grid using density-functional perturbation theory (DFPT),Baroni et al. (2001), and the e-ph coupling was computed by using an in-house modified version of the epw code Poncé et al. (2016). Electron and phonon energies, and e-ph coupling matrix elements were interpolated using maximally-localized Wannier functions Marzari et al. (2012). The phonon self-energy for the mode was computed on a electron momentum grid, while the Eliashberg function was obtained on a grid of electron and phonon momenta.
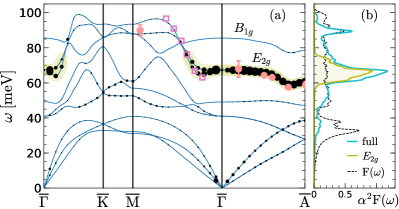
The phonon dispersion and the e-ph coupling strengths are depicted in Fig. 1(a), and the corresponding phonon density of states and Eliashberg function in Fig. 1(b). Our computed phonon dispersions are in good agreement with previous results Liu et al. (2001); Choi et al. (2002a, b); Kong et al. (2001); Golubov et al. (2002); Shukla et al. (2003); Baron et al. (2004); Eiguren and Ambrosch-Draxl (2008), while the total e-ph coupling strength is smaller than the earlier ab-initio values () Liu et al. (2001); Kong et al. (2001); Eiguren and Ambrosch-Draxl (2008); Calandra et al. (2010); Margine and Giustino (2013), but in rather good agreement with experimental estimates Bouquet et al. (2001); Wang et al. (2001). Consistently with earlier works Kong et al. (2001); An and Pickett (2001); Yildirim et al. (2001), large values of the e-ph coupling are mainly concentrated in the branch in the Brillouin zone center along the line. This is reflected in a dominant peak in the Eliashberg function at the corresponding energies meV. As shown below, such remarkable anisotropy is responsible for the hot-phonon scenario, where the zone-center phonon modes can acquire, under suitable conditions (i.e., by using pump-probe techniques), a population much larger than other underlying lattice DOFs.
In order to capture the anisotropy of the e-ph interaction, we model the total Eliashberg function as sum of two terms, , where contains the contribution of the hot modes along and around the path in the relevant energy range meV (green shaded areas in Fig. 1), while accounts for the weakly coupled cold modes in the remnant parts of the Brillouin zone. The resulting e-ph coupling strengths for the hot and cold modes are and , respectively.
With the fundamental input of the anisotropic e-ph coupling, we investigate the rates of the energy transfer between the electron and lattice DOFs in a typical time-resolved pump-probe experiment. As we detail below, energy transfer processes and the hot-phonon physics are driven by the strong anisotropy of the thermodynamical properties of hot and cold modes i.e. by the remarkable difference in specific heats. This physics do not rely thus on the assumption of effective temperatures for the electronic and lattice DOFs. On the other hand, the use of standard three-temperature model appears as a reliable and convenient way to describe these processes in terms of few intuitive quantities Allen (1987); Perfetti et al. (2007); Lui et al. (2010); Dal Conte et al. (2012); Johannsen et al. (2013). The validation of this modelling, compared with the results of a numerical computation using non-thermal distributions, is presented in Ref. bib (for detailed comparison between thermal and non-thermal models see Section S2 and Figs. S2 and S3). Characteristic parameters of our description will be thus the effective electronic temperature , the effective temperature of the hot phonon strongly coupled to the electronic bands, and the lattice temperature that describes the effective temperature of the remaining cold phonon modes:
| (1) | |||||
| (2) | |||||
| (3) |
Here , , and are the specific heat capacities for the electron, hot-phonon, and cold-phonon states, respectively. () is the electron-phonon relaxation rate between electronic states and hot (cold) phonons modes, calculated by means of (). Furthermore is the thermal conductivity of electrons and is a parameter ruling the anharmonic phonon-phonon scattering between the hot and cold phonon components (for further details see Section S1 and Fig. S1 in Ref. bib ). Modelling a typical pump-probe experiment with the photon energy being eV, we assume the pump energy to be transferred uniquely to the electronic DOFs by the term , where is the intensity of the absorbed fraction of the laser pulse (with a Gaussian profile) and is the penetration depth. The anisotropic coupling of the e-ph interaction is thus reflected in a different evolution of the three characteristic temperatures. Starting from an initial thermalized system at K, the energy pumped to the electronic DOFs is transferred faster to the phonons than to the other lattice vibrations, leading to an effective temperature significantly higher than that of the other modes, . Final thermalization between all the lattice DOFs occurs on time scales of several picoseconds, as a result of the weak direct phonon-phonon scattering and of the weak coupling between the electronic states and phonon modes other than the ones. In our calculations, the parameters in Eqs. (1)-(3) (with the exception of , and ) are evaluated numerically from the first-principles calculations bib .
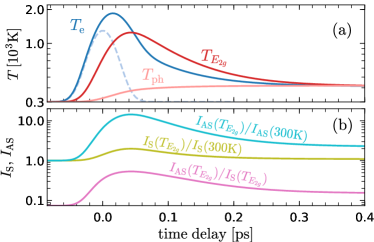
Our calculations predict a very fast increase of [see Fig. 2(a)], reaching the maximum temperature K with a short delay of fs from the maximum energy transfer to the electronic DOFs, consistent with a computed relaxation time fs (see Section S1 in Ref. bib ). Subsequent thermalization between electrons, hot phonons, and the remaining lattice DOFs occurs on a quite longer time scale, ps bib , where all the DOFs thermalize to an average temperature K 111 Note that the time evolution of resembles remarkably the two- behavior discussed in Ref. Demsar et al. (2003), where, however, the idea of a fast electron-electron thermalization was rejected. The outstanding rise of is not expected to depend substantially on the effective electron-electron thermalization (see Ref. bib ). . Note that the strong enhancement of with respect to is not so much due to the difference between and , but rather due to the smaller heat capacity , reflecting the fact that very few modes in are responsible for a similar coupling as many cold lattice modes in .
The preferential energy transfer to a single phonon mode can be revealed via several experimental techniques. One of the most direct ways is measuring the intensities of the Stokes (S) and anti-Stokes (AS) peaks in Raman spectroscopy, which are related to the Bose-Einstein occupation factor via the relations and , respectively. Assuming to work at zero fluence and room temperature, we predict in Fig. 2(b) an increase of the intensity of the Stokes peak up to a factor 2 [], and of the anti-Stokes peak as high as a factor 15 []. At the maximum temperature of the hot phonon, the intensity of the anti-Stokes resonance can be as high as 50% of the intensity of the Stokes peak. The experimental investigation of Stokes and anti-Stokes peak intensities in time-resolved Raman spectroscopy may provide also a direct way to probe the validity of the hot-phonon scenario by simultaneous measurement of the Stokes/anti-Stokes intensities of the Raman active out-of-plane mode with frequency meV. Since this mode is weakly coupled to the electronic states, we expect it to be governed by the cold-phonon temperature , with a drastically different behavior in the time evolution of the Stokes/anti-Stokes peak intensities than the mode (see Section S3 and Fig. S4 in Ref. bib ). These spectral signatures constitute a clear fingerprint of hot-phonon physics, suggesting that time-resolved Raman measurements may provide a tool to unambiguously unravel the thermalization mechanisms for systems out of equilibrium.
As shown in Refs. Yan et al. (2009); Ferrante et al. (2018), the peculiar characteristics of hot-phonon dynamics can be traced also through the -resolved phonon spectral properties. On the theoretical side, these properties can be properly investigated in the Raman spectra of the mode upon computation of the many-body phonon self-energy of the mode at Lazzeri and Mauri (2006). Note that, in the real-time dynamics, the phonon self-energy will depend on the full set of electron and phonon temperatures . The full spectral properties can be thus evaluated in terms of the phonon spectral function as Giustino (2017):
| (4) |
where meV is the harmonic adiabatic phonon frequency as obtained from DFPT and is the phonon self-energy for the modes, where, to avoid double-counting, the non-interacting adiabatic contribution at K is subtracted (for more details on the nonadiabatic phonon self-energy see Ref. bib ). The inclusion of many-body effects on the crystal-lattice dynamics via Eq. (4) is reflected by renormalization of the phonon energy and by the finite phonon linewidth , which may be computed through solution of the following self-consistent equations: , and .
Using such theoretical tools, we evaluate, within the three-temperature model, the time-resolved dynamics of the Raman peak position and of the phonon linewidth, as well as of the full phonon spectral function of the mode in MgB2 as a function of the pump-probe time delay. A similar approach (however, without time dependence) was used in Ref. Ferrante et al. (2018) for graphene, where the effects of the electronic damping due to the electron-electron interaction was explicitly included in the evaluation of the phonon self-energy. This description is however insufficient in the case of MgB2 where the electronic damping is crucially governed by the e-ph coupling itself Cappelluti (2006); Novko (2018). In order to provide a reliable description we evaluate thus the phonon self-energy in a nonadiabatic framework Novko (2018) explicitly retaining the e-ph renormalization effects in the Green’s functions of the relevant intraband contribution (see Section S4 in Ref. bib ). The phonon spectral function is shown in Fig. 3(a)-(b) as function of the time delay, for two different fluences. The corresponding phonon energies and linewidths are summarized in panels (c) and (d).
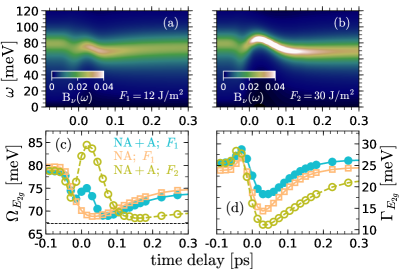
The combined effect of the time evolution of and , results in a non-trivial time-dependence of the spectral properties. Our calculations reveal a counter-intuitive reduction of the phonon linewidth right after photo-excitation, followed by a subsequent increase during the overall thermalization with the cold phonon DOFs. The time dependence of the phonon frequency shows an even more complex behavior, with an initial redshift, followed by a partial blueshift, and by a furthermore redshift.
In order to rationalize these puzzling results, we analyze in detail the temperature dependence of the phonon spectral properties, decomposing the phonon self-energy in its basic components: interband/intraband terms, and in adiabatic (A) and nonadiabatic (NA) processes. For details see Ref. bib , whereas here we summarize the main results. A crucial role is played by the NA intraband term, which is solely responsible for the phonon damping. Following a robust scheme usually employed for the optical conductivity (see Section S4 in Ref. bib ), we can model the effects of the e-ph coupling on the intraband processes in terms of the renormalization function and the e-ph particle-hole scattering rate :
| (5) |
where bib . Phonon optical probes at equilibrium are commonly at room (or lower) temperature in the regime , where the phonon damping . Our calculations predict on the other hand meV, which is close to meV, resulting in meV, in good agreement with the experiments Hlinka et al. (2001); Goncharov et al. (2001); Martinho et al. (2003) and with the previous calculations Cappelluti (2006); Novko (2018). The further pump-induced increase of drives the system into an opposite regime where . In this regime the pump-induced increase of results thus in a reduction of , as observed in Fig. 3(d). A similar change of regime is responsible for the crossover from an Elliott-Yafet to the Dyakonov-Perel spin-relaxation, or for the NMR motional narrowing Boross et al. (2013); Szolnoki et al. (2017). We also note here that the same effects and the change of regime are partially responsible for the overall time-dependence of the phonon frequency [see Fig. 3(c)], where the full result (full blue circles) is compared with the one retaining only the nonadiabatic intraband self-energy (open orange squares). The redshift predicted for the the latter case is a direct effect of the same change of regime responsible for the reduction of the phonon damping. However, in the real part of the self-energy, adiabatic processes (both intra- and inter-band) play also a relevant role bib , giving rise to an additional blueshift (ruled uniquely by ) that partially competes with the redshift induced by nonadiabatic intraband processes. Note that actual magnitude of this anomaly depends on the pump fluence [compare full and open circles in Fig. 3(c)]. This dependence can be also used to trace down such adiabatic processes. For a realistic possibility of detecting these spectral features in time-resolved Raman spectroscopy one needs to face the limitations of the time-energy uncertainty Versteeg et al. (2018). For a time resolution of fs, comparable with the pulse width, one gets a energy resolution of meV. While this limitation would prevent the detection of fine structures, the coherent shift of the peak center and the time-dependence of the phonon linewidth should be clearly observable Fausti et al. (2009) (see also Fig. S5 shown in Ref. bib ). Furthermore, the development of alternative techniques based on quantum/statistical correlations Randi et al. (2017); Tollerud et al. (2019) has shown to provide a promising way to overcome the limitations of the time-energy uncertainty. Therefore, the insights given here along with our ab initio method might be of general importance, especially considering that the theoretical framework for deciphering ultrafast phonon dynamics is at the moment not present in the literature.
In conclusion, in this Letter we have presented a quantitative and compelling evidence that a hot-phonon scenario dominates the ultrafast carrier dynamics of MgB2 in time-resolved pump-probe experiments. We further predict the emergence of specific spectral signatures in time-resolved Raman spectroscopy, which may guide the direct experimental verification of a hot-phonon regime in MgB2. The present analysis is of interest for understanding and controlling the coupling mechanisms in this material, with further relevance for technology. Possible future applications can range from optical probes for sensoring the internal temperature to controlling the heat transfer between electronic and lattice DOFs in order to optimizing dissipation processes and interfaces between superconducting and normal metals.
Acknowledgements.
We thank F. Carbone, E. Baldini, L. Benfatto, D. Fausti, A. Perucchi and P. Postorino for enlightening discussions. D.N. gratefully acknowledges financial support from the European Regional Development Fund for the “Center of Excellence for Advanced Materials and Sensing Devices” (Grant No. KK.01.1.1.01.0001). Financial support by Donostia International Physics Center (DIPC) during various stages of this work is also highly acknowledged. Computational resources were provided by the DIPC computing center.References
- Liu et al. (2001) A. Y. Liu, I. I. Mazin, and J. Kortus, Phys. Rev. Lett. 87, 087005 (2001).
- Choi et al. (2002a) H. J. Choi, D. Roundy, H. Sun, M. L. Cohen, and S. G. Louie, Phys. Rev. B 66, 020513 (2002a).
- Choi et al. (2002b) H. J. Choi, D. Roundy, H. Sun, M. L. Cohen, and S. G. Louie, Nature 418, 758 (2002b).
- Kong et al. (2001) Y. Kong, O. Dolgov, O. Jepsen, and O. Andersen, Phys. Rev. B 64, 020501 (2001).
- Golubov et al. (2002) A. Golubov, J. Kortus, O. Dolgov, O. Jepsen, Y. Kong, O. Andersen, B. Gibson, K. Ahn, and R. Kremer, J. Phys.: Condens. Matter 14, 1353 (2002).
- Giubileo et al. (2001) F. Giubileo, D. Roditchev, W. Sacks, R. Lamy, D. Thanh, J. Klein, S. Miraglia, D. Fruchart, J. Marcus, and P. Monod, Phys. Rev. Lett. 87, 177008 (2001).
- Tsuda et al. (2001) S. Tsuda, T. Yokoya, T. Kiss, Y. Takano, K. Togano, H. Kito, H. Ihara, and S. Shin, Phys. Rev. Lett. 87, 17706 (2001).
- Chen et al. (2001) X. Chen, M. Konstantinović, J. Irwin, D. Lawrie, and J. P. Franck, Phys. Rev. Lett. 87, 157002 (2001).
- Gonnelli et al. (2002) R. Gonnelli, D. Daghero, G. Ummarino, V. Stepanov, J. Jun, S. Kazakov, and J. Karpinski, Phys. Rev. Lett. 89, 247004 (2002).
- Mou et al. (2015) D. Mou, R. Jiang, V. Taufour, S. Bud’ko, P. Canfield, and A. Kaminski, Phys. Rev. B 91, 214519 (2015).
- An and Pickett (2001) J. M. An and W. E. Pickett, 86, 4366 (2001).
- Yildirim et al. (2001) T. Yildirim, O. Gülseren, J. Lynn, C. Brown, T. Udovic, Q. Huang, N. Rogado, K. Regan, M. Hayward, J. Slusky, T. He, M. Haas, P. Khalifah, K. Inumaru, and R. Cava, Phys. Rev. Lett. 87, 037001 (2001).
- Bohnen et al. (2001) K.-P. Bohnen, R. Heid, and B. Renker, Phys. Rev. Lett. 86, 5771 (2001).
- Hlinka et al. (2001) J. Hlinka, I. Gregora, J. Pokorný, A. Plecenik, P. Kúš, L. Satrapinsky, and Š. Beňačka, Phys. Rev. B 64, 140503 (2001).
- Goncharov et al. (2001) A. Goncharov, V. Struzhkin, E.Gregoryanz, J. Hu, R. Hemley, H. k. Mao, G. Lapertot, S. Bud’ko, and P. Canfield, Phys. Rev. B 64, 100509 (2001).
- Postorino et al. (2001) P. Postorino, A. Congeduti, P. Dore, A. Nucara, A. Bianconi, D. D. Castro, S. D. Negri, and A. Saccone, Phys. Rev. B 65, 020507 (2001).
- Renker et al. (2002) B. Renker, K. Bohnen, R. Heid, D. Ernst, H. Schober, M. Koza, P. Adelmann, P. Schweiss, and T. Wolf, Phys. Rev. Lett. 88, 067001 (2002).
- Quilty et al. (2002) J. W. Quilty, S. Lee, A. Yamamoto, and S. Tajima, Phys. Rev. Lett. 88, 087001 (2002).
- Martinho et al. (2003) H. Martinho, C. Rettori, P. Pagliuso, A. Martin, N. Moreno, and J. Sarrao, Solid State Communications 125, 499 (2003).
- Shi et al. (2004) L. Shi, H. Zhang, L. Chen, and Y. Feng, Journal of Physics: Condensed Matter 16, 6541 (2004).
- Castro et al. (2006) D. D. Castro, E. Cappelluti, M. Lavagnini, A. Sacchetti, A. Palenzona, M. Putti, and P. Postorino, Phys. Rev. B 74, 100505 (2006).
- Shukla et al. (2003) A. Shukla, M. Calandra, M. d’Astuto, M. Lazzeri, F. Mauri, C. Bellin, M. Krisch, J. Karpinski, S. M. Kazakov, J. Jun, D. Daghero, and K. Parlinski, Phys. Rev. Lett. 90, 095506 (2003).
- Boeri et al. (2002) L. Boeri, G. Bachelet, E. Cappelluti, and L. Pietronero, Phys. Rev. B 65, 214501 (2002).
- Profeta et al. (2003) G. Profeta, A. Continenza, and S. Massidda, Phys. Rev. B 68, 144508 (2003).
- Lazzeri et al. (2003) M. Lazzeri, M. Calandra, and F. Mauri, Phys. Rev. B 68, 220509 (2003).
- Calandra and Mauri (2005) M. Calandra and F. Mauri, Phys. Rev. B 71, 064501 (2005).
- Boeri et al. (2005) L. Boeri, E. Cappelluti, and L. Pietronero, Phys. Rev. B 71, 012501 (2005).
- Cappelluti (2006) E. Cappelluti, Phys. Rev. B 73, 140505 (2006).
- Simonelli et al. (2009) L. Simonelli, V. Palmisano, M. Fratini, M. Filippi, P. Parisiades, D. Lampakis, E. Liarokapis, , and A. Bianconi, Phys. Rev. B 80, 014520 (2009).
- Novko (2018) D. Novko, Phys. Rev. B 98, 041112 (2018).
- Xu et al. (2003) Y. Xu, M. Khafizov, L. Satrapinsky, P. Kúš, A. Plecenik, and R. Sobolewski, Phys. Rev. Lett. 91, 197004 (2003).
- Demsar et al. (2003) J. Demsar, R. Averitt, A. Taylor, V. Kabanov, W. Kang, H. Kim, E. Choi, and S. Lee, Phys. Rev. Lett. 91, 267002 (2003).
- Baldini et al. (2017) E. Baldini, A. Mann, L. Benfatto, E. Cappelluti, A. Acocella, V. Silkin, S. Eremeev, A. Kuzmenko, S. Borroni, T. Tan, X. Xi, F. Zerbetto, R. Merlin, and F. Carbone, Phys. Rev. Lett. 119, 097002 (2017).
- Yan et al. (2009) H. Yan, D. Song, K. F. Mak, I. Chatzakis, J. Maultzsch, and T. F. Heinz, Phys. Rev. B 80, 121403 (2009).
- Berciaud et al. (2010) S. Berciaud, M. Y. Han, K. F. Mak, L. E. Brus, P. Kim, and T. F. Heinz, Phys. Rev. Lett. 104, 227401 (2010).
- Chae et al. (2010) D.-H. Chae, B. Krauss, K. von Klitzing, and J. H. Smet, Nano Lett. 10, 466 (2010).
- Butscher et al. (2007) S. Butscher, F. Mildea, M. Hirtschulz, E. Malić, and A. Knorr, Appl. Phys. Lett. 91, 203103 (2007).
- Wang et al. (2010) H. Wang, J. Strait, P. George, S. Shivaraman, V. Shields, M. Chandrashekhar, J. Hwang, F. Rana, M. Spencer, C. Ruiz-Vargas, and J. Park, Appl. Phys. Lett. 96, 081917 (2010).
- Scheuch et al. (2011) M. Scheuch, T. Kampfrath, M. Wolf, K. von Volkmann, C. Frischkorn, and L. Perfetti, Appl. Phys. Lett. 99, 211908 (2011).
- Huang et al. (2011) L. Huang, B. Gao, G. Hartland, M. Kelly, and H. Xing, Surf. Sci. 605, 1657 (2011).
- Wu et al. (2012) S. Wu, W.-T. Liu, X. Liang, P. J. Schuck, F. Wang, Y. R. Shen, and M. Salmeron, Nano Lett. 12, 5495 (2012).
- Ferrante et al. (2018) C. Ferrante, A. Virga, L. Benfatto, M. Martinati, D. De Fazio, U. Sassi, C. Fasolato, A. K. Ott, P. Postorino, D. Yoon, G. Cerullo, F. Mauri, A. C. Ferrari, and T. Scopigno, Nat. Commun. 9, 308 (2018).
- Giannozzi et al. (2009) P. Giannozzi, S. Baroni, N. Bonini, M. Calandra, R. Car, C. Cavazzoni, D. Ceresoli, G. L. Chiarotti, M. Cococcioni, I. Dabo, and et al., Journal of Physics: Condensed Matter 21, 395502 (2009).
- Perdew et al. (1996) J. P. Perdew, K. Burke, and M. Ernzerhof, Phys. Rev. Lett. 77, 3865 (1996).
- Baroni et al. (2001) S. Baroni, S. de Gironcoli, A. Dal Corso, and P. Giannozzi, Rev. Mod. Phys. 73, 515 (2001).
- Poncé et al. (2016) S. Poncé, E. Margine, C. Verdi, and F. Giustino, Computer Physics Communications 209, 116 (2016).
- Marzari et al. (2012) N. Marzari, A. A. Mostofi, J. R. Yates, I. Souza, and D. Vanderbilt, Rev. Mod. Phys. 84, 1419 (2012).
- Baron et al. (2004) A. Q. R. Baron, H. Uchiyama, Y. Tanaka, S. Tsutsui, D. Ishikawa, S. Lee, R. Heid, K.-P. Bohnen, S. Tajima, and T. Ishikawa, Phys. Rev. Lett. 92, 197004 (2004).
- Eiguren and Ambrosch-Draxl (2008) A. Eiguren and C. Ambrosch-Draxl, Phys. Rev. B 78, 045124 (2008).
- Calandra et al. (2010) M. Calandra, G. Profeta, and F. Mauri, Phys. Rev. B 82, 165111 (2010).
- Margine and Giustino (2013) E. R. Margine and F. Giustino, Phys. Rev. B 87, 024505 (2013).
- Bouquet et al. (2001) F. Bouquet, R. A. Fisher, N. E. Phillips, D. G. Hinks, and J. D. Jorgensen, Phys. Rev. Lett. 87, 047001 (2001).
- Wang et al. (2001) Y. Wang, T. Plackowski, and A. Junod, Physica C: Superconductivity 355, 179 (2001).
- Allen (1987) P. B. Allen, Phys. Rev. Lett. 59, 1460 (1987).
- Perfetti et al. (2007) L. Perfetti, P. A. Loukakos, M. Lisowski, U. Bovensiepen, H. Eisaki, and M. Wolf, Phys. Rev. Lett. 99, 197001 (2007).
- Lui et al. (2010) C. Lui, K. Mak, J. Shan, and T. Heinz, Phys. Rev. Lett. 105, 127404 (2010).
- Dal Conte et al. (2012) S. Dal Conte, C. Giannetti, G. Coslovich, F. Cilento, D. Bossini, T. Abebaw, F. Banfi, G. Ferrini, H. Eisaki, M. Greven, A. Damascelli, D. van der Marel, and F. Parmigiani, Science 335, 1600 (2012).
- Johannsen et al. (2013) J. C. Johannsen, S. Ulstrup, F. Cilento, A. Crepaldi, M. Zacchigna, C. Cacho, I. C. E. Turcu, E. Springate, F. Fromm, C. Raidel, T. Seyller, F. Parmigiani, M. Grioni, and P. Hofmann, Phys. Rev. Lett. 111, 027403 (2013).
- (59) See Supplemental Material at [URL], which additionally includes Refs. Lin et al. (2008); Balassis et al. (2008); Bauer et al. (2001); Brorson et al. (1990); Fann et al. (1992); Hohlfeld et al. (2000); Saitta et al. (2008); Caruso et al. (2017); Guritanu et al. (2006); Di Castro et al. (2006); Allen (1971); Allen and Silberglitt (1974); Shulga et al. (1991); Norman and Chubukov (2006); Novko (2017), for more details on the temperature dependence of the thermodynamical quantities and of the relaxation times for hot and cold lattice modes; on the validation of the effective temperature model; on the analysis of Stokes and anti-Stokes intensities and the phonon self-energy calculations; and on the energy-time resolution discussion.
- Note (1) Note that the time evolution of resembles remarkably the two- behavior discussed in Ref.\tmspace+.1667emDemsar et al. (2003), where, however, the idea of a fast electron-electron thermalization was rejected. The outstanding rise of is not expected to depend substantially on the effective electron-electron thermalization (see Ref.\tmspace+.1667embib ).
- Lazzeri and Mauri (2006) M. Lazzeri and F. Mauri, Phys. Rev. Lett. 97, 266407 (2006).
- Giustino (2017) F. Giustino, Rev. Mod. Phys. 89, 015003 (2017).
- Boross et al. (2013) P. Boross, B. Dóra, A. Kiss, and F. Simon, Sci. Rep. 3, 3233 (2013).
- Szolnoki et al. (2017) L. Szolnoki, A. Kiss, B. Dóra, and F. Simon, Sci. Rep. 7, 9949 (2017).
- Versteeg et al. (2018) R. Versteeg, J. Zhu, P. Padmanabhan, C. Boguschewski, R. German, M. Goedecke, P. Becker, and P. M. van Loosdrecht, Struct. Dyn. 5, 044301 (2018).
- Fausti et al. (2009) D. Fausti, O. Misochko, and P. van Loosdrecht, Phys. Rev. B 80, 161207 (2009).
- Randi et al. (2017) F. Randi, D. Fausti, , and M. Eckstein, Phys. Rev. B 95, 115132 (2017).
- Tollerud et al. (2019) J. Tollerud, G. Sparapassi, A. Montanaro, S. Asban, F. Glerean, F. Giusti, A. Marciniak, G. Kourousias, F. Billè, F. Cilento, S. Mukamel, and D. Fausti, Proc. Natl. Acad. Sci. 116, 5383 (2019).
- Lin et al. (2008) Z. Lin, L. V. Zhigilei, and V. Celli, Phys. Rev. B 77, 075133 (2008).
- Balassis et al. (2008) A. Balassis, E. V. Chulkov, P. M. Echenique, and V. M. Silkin, Phys. Rev. B 78, 224502 (2008).
- Bauer et al. (2001) E. Bauer, C. Paul, S. Berger, S. Majumdar, H. Michor, M. Giovannini, A. Saccone, and A. Bianconi, Journal of Physics: Condensed Matter 13, L487 (2001).
- Brorson et al. (1990) S. Brorson, A. Kazeroonian, S. Moodera, D. Face, T. Cheng, E. Ippen, M. Dresselhaus, and G. Dresselhaus, Phys. Rev. Lett. 64, 2172 (1990).
- Fann et al. (1992) W. Fann, R. Storz, H. Tom, and J. Bokor, Phys. Rev. B 46, 13592 (1992).
- Hohlfeld et al. (2000) J. Hohlfeld, S.-S. Wellershoff, J. Güdde, U. Conrad, V. Jähnke, and E. Matthias, Chem. Phys. 251, 237 (2000).
- Saitta et al. (2008) A. M. Saitta, M. Lazzeri, M. Calandra, and F. Mauri, Phys. Rev. Lett. 100, 226401 (2008).
- Caruso et al. (2017) F. Caruso, M. Hoesch, P. Achatz, J. Serrano, M. Krisch, E. Bustarret, and F. Giustino, Phys. Rev. Lett. 119, 017001 (2017).
- Guritanu et al. (2006) V. Guritanu, A. Kuzmenko, D. van der Marel, S. Kazakov, N. Zhigadlo, and J. Karpinski, Phys. Rev. B 73, 104509 (2006).
- Di Castro et al. (2006) D. Di Castro, M. Ortolani, E. Cappelluti, U. Schade, N. Zhigadlo, and J. Karpinski, Phys. Rev. B 73, 174509 (2006).
- Allen (1971) P. B. Allen, Phys. Rev. B 3, 305 (1971).
- Allen and Silberglitt (1974) P. B. Allen and R. Silberglitt, Phys. Rev. B 9, 4733 (1974).
- Shulga et al. (1991) S. Shulga, O. Dolgov, and E. Maksimov, Physica C 178, 266 (1991).
- Norman and Chubukov (2006) M. Norman and A. Chubukov, Phys. Rev. B 73, 140501 (2006).
- Novko (2017) D. Novko, Nano Lett. 17, 6991 (2017).