Somatic Mutations Render Human Exome and Pathogen DNA more Similar
Ehsan Ebrahimzadeh1, Maggie Engler2, David Tse2, Razvan Cristescu3, Aslan Tchamkerten4,*
1 Department of Electrical Engineering, UCLA, Los Angeles, California, USA
2 Department of Electrical Engineering, Stanford University, Stanford, California, USA
3 Department of Discovery Medicine, Merck Research Laboratories, Rahway, New Jersey, USA
4 Department of Communications and Electronics, Telecom ParisTech, Paris, France
* aslan.tchamkerten@telecom-paristech.fr
Abstract
Immunotherapy has recently shown important clinical successes in a substantial number of oncology indications. Additionally, the tumor somatic mutation load has been shown to associate with response to these therapeutic agents, and specific mutational signatures are hypothesized to improve this association, including signatures related to pathogen insults. We sought to study in silico the validity of these observations and how they relate to each other. We first addressed the question whether somatic mutations typically involved in cancer may increase, in a statistically meaningful manner, the similarity between common pathogens and the human exome. Our study shows that common mutagenic processes like those resulting from exposure to ultraviolet light (in melanoma) or smoking (in lung cancer) increase, in the upper range of biologically plausible frequencies, the similarity between cancer exomes and pathogen DNA at a scale of to nucleotide sequences (corresponding to peptides of amino acids). Second, we investigated whether this increased similarity is due to the specific mutation distribution of the considered mutagenic processes or whether uniformly random mutations at equal rate would trigger the same effect. Our results show that, depending on the combination of pathogen and mutagenic process, these effects need not be distinguishable. Third, we studied the impact of mutation rate and showed that increasing mutation rate generally results in an increased similarity between the cancer exome and pathogen DNA, again at a scale of amino acids. Finally, we investigated whether the considered mutational processes result in amino-acid changes with functional relevance that are more likely to be immunogenic. We showed that functional tolerance to mutagenic processes across species generally suggests more resilience to mutagenic processes that are due to exposure to elements of nature than to mutagenic processes that are due to exposure to cancer-causing artificial substances. These results support the idea that recognition of pathogen sequences as well as differential functional tolerance to mutagenic processes may play an important role in the immune recognition process involved in tumor infiltration by lymphocytes.
Introduction
Recent clinical advances firmly establish the role of immunotherapy (in particular, checkpoint inhibition targetting the CTLA4 and PD1/PD-L1 pathways [1]) in the treatment of cancer. However, the rates of response vary by indication, outlining the important role of identifying the patients most likely to respond [2, 3, 4, 5]. In parallel, the analysis of the data in large scale genomic efforts including The Cancer Genome Atlas (TCGA [6]) has identified universal characteristics of the tumor and its environment that ellicit potential recognition by the host immune system. In particular, somatic mutational load as inferred by DNA sequencing [7, 8] and cytolytic infiltrate as inferred by immunohistochemistry or RNA sequencing [9] have emerged as hallmarks of an immune-active tumor enviroment. It is thus important to understand the causality and mechanism of action that drives the heterogenous composition of the tumor and its environment and consequently the heterogeneity of response to immunotherapy, in order to select the right patients for treatment, potential combinations, and potential for early intervention.
Multiple recent studies have suggested a strong causal link between the mutational burden of the tumor and clinical response to immunotherapy across multiple indications including Melanoma [10, 11], Non Small Cell Lung Cancer [12], Bladder cancer [13] and Colorectal cancer [14]. In these studies, a strong relationship between neoantigen load (the number of mutations with immunogenic potential) and response to immunotherapy has been identified. Importantly, each of these indications are characterized by distinct mutagenic processes that result in abundant neoantigen load [7, 8]: UV light exposure in Melanoma, smoking in Non Small Cell Lung Cancer, APOBEC activation in Bladder cancer, and MMR defficiency in MSI-h Colorectal cancer. Whether particular mutations or mutational patterns preferentially induce an immunologic phenotype remains an open question [10, 11]. However, several hypotheses have recently been put forward, including the presence of mutations in particular genes [15, 16], or the presence of a transversion signature related to smoking [12]. In particular, Snyder et al. [11] put forward a hypothesis linking cancer exomes with patterns present in common pathogens. Namely, their results with exome analysis of Melanoma patients treated with Ipilimumab, a CTLA4 inhibitor, suggest that somatic mutations in cancer genomes that lead to tetrapeptides similar to those found in common pathogens are more likely to elicit a response to the therapy than common somatic mutations. This association is presumably driven by the innate ability of significant portions of the adaptive immune repertoire to recognize such pathogens.
We took an in-silico approach to evaluate the impact of certain mutagenic processes on the similarity between cancer exomes and pathogen DNAs. Somatic mutations are an inherent natural process related to cell division and aging which in some instances is exacerbated by mutagenic factors. We simulated such mutagenic processes using mixtures of mutational signatures with empirically derived mixing parameters. We used a simple similarity metric between the mutated exome and common pathogen exomes to estimate changes in overall potential immunogenicity of cancer exomes as compared to the normal exome. We considered simulations of mutagenic processes that yield most mutated cancer exomes, namely ultra-violet (UV) light (Melanoma), smoking (Non Small Cell Lung Cancer), and APOBEC activation (Bladder cancer) [9, 7]. Our results suggest that, in the upper range of biologically plausible mutation rates, mutagenic processes resulting from exposure to these common mutagens lead to cancer exomes that are more similar pathogen DNAs at a scale of to nucleotides. These changes are subtle but nevertheless statistically significant and are particularly important in the range of peptide sizes that are relevant for epitope presentation in the human MHC mechanism; MHC presentation typically involves peptides with lengths between 8-18 nucleotides (8-13 for class I MHC and 13-18 for class II MHC [17]).
However, our results also suggest that the increased similarity need not be caused by the specificity of the mutation distribution. Depending on the pathogen, uniformly random mutations (at the same rate) may result in equal increased similarity. Finally, we show that increasing mutation rate generally results in increased similarity between cancer exomes and pathogen DNAs. These conclusions suggest that mutagenic processes might act as a mechanism of pressure that models the mutational spectra observed in tumors by increasing recognition from the host immune system.
Opposite to the aforementioned effect that increases the likelihood that a cancer exome is recognized by the immune system, an antagonist mechanism of pressure on mutational landscape stems from tolerance by the immune system to natural mutagenic processes. To that extent, we establish that exomes across species are generally more resilient, in terms of a functional point of view related to the synonymity of amino-acid changes, to mutagenic processes that are due to exposure to elements of nature than to mutagenic processes that are due to exposure to cancer-causing artificial substances. In particular, we observe that the functionality of the genetic code (allocation of codons to amino-acids) is more resilient to UV light than smoking mutagenic processes at a fixed rate. This suggests the possibility that there are different tissue-dependent evolutionary tolerance levels, modulated by the pathogen recognition apparatus in terms of both immune recognition and cancer development, which for example reflect in the much higher mutational loads and immune infiltrate in Melanoma compared to Lung cancer [9].
1 Methods
We sought to assess whether certain mutagenic processes result in somatic alterations that increase the similarity of the mutated human exome with selected pathogens. Accordingly, we first defined a pairwise similarity metric among DNA sequences of different length and evaluated the similarity between pathogens and the normal human exome. Second, we simulated mutations resulting from different mutagenic processes at different mutation rates acting on the human exome and evaluated the consequent change in similarity of the mutated human exome with respect to the pathogen exomes. Third, we investigated the resiliency of exomes (human exome and model organism exomes) in terms of maintained functionality of the resulting amino-acids and compared the sequences of amino acids of the normal and mutated exomes.
Data and computing resources
We obtained the human normal exome from GRCh38 http://www.ensembl.org/Homo_sapiens/Info/Index
We considered the following list of model organisms: Mus Musculus (Mouse), Saccharomyces Cerevisiae (Yeast), Felis Catus (Cat), Drosophila Melanogaster (Fruitfly), Caenorhabditis Elegans (Nematode), Xenopus, Danio Rerio (Zebrafish), Cavia Porcellus (Pig), Anolis carolinensis (Anolis). Exomes from these organisms were obtained from http://uswest.ensembl.org/biomart/martview/
We considered the following list of viral pathogens: Cytomegalovirus (CMV), Dengue virus, Ebola virus, Epstein-Barr virus (EBV), Human Herpesvirus 6 (HHV), Human Papillomavirus (HPV), Measles virus, Yellow Fever virus. DNA sequences from these pathogens were obtained from http://www.ncbi.nlm.nih.gov/
We considered simulations of mutational signatures resulting from ultra-violet (UV) light (specific to Melanoma), smoking (specific to Non Small Cell Lung Cancer (NSCLC)), and APOBEC activation (specific to Bladder cancer). These simulations were based on the data from [8, Supplementary information, Table S2] restricted to the set of patients with Melanoma cancer, NSCLC, and Bladder cancer.
For simulations we used Python 2.7.6 (libraries random, numpy, and scipy.stats) and ran programs on a shared server with 8 CPUs and 128GB memory.
2 Results
2.1 Pathogen DNA vs. human exome and MHC mechanism
To quantify the similarity between a pathogen DNA, denoted by , and the human exome, denoted by , we considered the following similarity score. For a given integer , the similarity score, denoted by , corresponds to the relative proportion of length- strings in the pathogen DNA that also appear in the human exome at least once, that is
where
Here denotes the length of the pathogen DNA, denotes the pathogen DNA substring starting at position and ending at position , and “” denotes string inclusion. In particular, corresponds to the case where all length- strings in the pathogen DNA also appear in the human exome and corresponds to the case where the pathogen DNA and the human exome have no length- string in common. Observe that can be interpreted as the probability that a randomly and uniformly picked length- string in the pathogen DNA also appears in the human exome. Accordingly, we often refer to as the matching probability. Finally, notice that does not count multiplicity, i.e., strings that appear only once in the human exome and strings that appear multiple times in the human exome are note distinguished
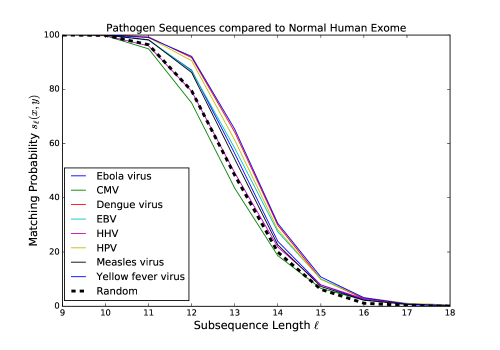
In Fig. 1, each curve represents the matching probability for a specific pathogen DNA and the normal human exome , for . To benchmark these scores we also considered the matching probability with respect to a randomly and uniformly generated “pathogen” sequence, where each nucleotide is equally likely to occur. The average matching probability with respect to such a sequence is represented by the “Random” curve in Fig. 1 and turns out to be independent of its length . This curve is indistinguishable from the confidence interval corresponding to a randomly generated sequence. Supporting material for Fig. 1 is deferred to Section A.1 in the Appendix. We make the following observations:
-
For all pathogens the similarity score is equal to one for , that is length subsequences of the pathogen DNAs all appear in the human exome as well.
-
The similarity scores are non-zero for all pathogens up to length . At the similarity scores is zero for the Ebola virus, the Measles virus, and the Dengue virus.
-
For all the similarity score for pathogen DNAs is higher than for a random sequence, except for CMV () and for HHV ().
-
From there is a steep decrease in the similarity scores, down to less than for . A closer look at the data (see Table A.1.1) reveals that, for all pathogens, the sharpest relative drop of the similarity score occurs from to or from to .
-
The differences in score across pathogens is maximal at .
These in-silico observations are in line with the concept that amino acids are enough for the presentation machinery in terms of both diversity of possible sequences () and differentiation of self from foreign sequences in the MHC machinery. Namely, this length is strikingly similar to the length of peptides studied in the signature determined by [11].
2.2 Impact of somatic mutations on pathogen DNA and human exome similarity score
To assess the impact of somatic mutations on pathogen DNA and human exome similarity score and identify the roles of mutation distribution and mutation rate we proceeded as follows:
-
•
Normal exome vs. cancer exome: we investigated whether cancer somatic mutations render pathogen and human exome more similar, and whether random mutations alone, with uniform distribution across mutations, would produce the same results as (typically non-uniform) cancer-dependent mutations, at the same mutation rate.
-
•
Impact of mutation rate: we investigated whether a higher mutation rate renders pathogen DNA and human exome more similar.
Central to our investigation is a notion of cancer channel described next.
Cancer channel
We simulated the changes induced to the normal exome by cancer specific mutagens in a probabilistic way. The cancer exomes were generated from the normal exome by using cancer-dependent mixtures of mutational signatures with empirical weights derived from data in [8]. Note that even if a cancer typically exhibits a dominant mutational signature, the simulated mutagenic process results in a more realistic combination of such signatures. The similarity scores of the normal exome and cancer exome were then computed for each pathogen. To formalize our analysis, we used concepts from information theory, in particular related to communications over a noisy channel. To a given cancer and mutation rate we associated a transformation, referred to as “cancer channel,” which mimics the typical effects of the mutagenic process that are specific to the cancer at the given mutation rate. Analogously to a communication channel that alterates a transmitted message because of noise (see, e.g.,[18]), a cancer channel alterates a DNA sequence because of somatic mutations. Given a particular cancer and a mutation rate the cancer channel assigns to each nucleotide the probability of being mutated into nucleotide . This probability was derived using data from [8, Supplementary information, Table S2] (see Appendix A.2 in this paper).
To obtain a cancer exome we “passed” the normal human exome through cancer channel as shown in Fig. 2.
Specifically, the cancer exome was generated from so that the probability to obtain from normal exome was given by
Normal vs. cancer specific and random mutations
For given pathogen , cancer , and mutation rate we performed two tests. In Test , we evaluated the statistical significance of the effect of cancer somatic mutations in making human exome more similar to pathogen DNA sequences. In Test , we compared cancer somatic mutations and random mutations in making the human exome more similar to pathogen DNA sequences. Both tests were peformed for -values of , , and . The lowest mutation rate was chosen to be as it represents a good compromise between biological and statistical relevance. It lies in the upper range of the mutation rates observed in actual cancer samples [8] and in the lower range for statistical relevance—see next subsection.
Test 1: For each we independently generated cancer exomes from the normal human exome and computed the corresponding similarity scores . -values were computed for comparing the mean of against using a one-sided t-test with a null hypothesis that the true mean of is no larger than .
Test 2: We replaced the cancer channel by a “random channel” which produced mutations at the same rate but in a uniform manner. For each we independently generated exomes by passing the normal human exome through the random channel and computed the corresponding similarity scores . -values were computed for comparing the mean of against the mean of (obtained in Test ) using a two-sample one-sided t-test with a null hypothesis that the true mean of is no larger than the true mean of —note that directly computing the true mean of over is impossible as it amounts to computing a sum over all possible cancer exomes, and similarly for the mean of .
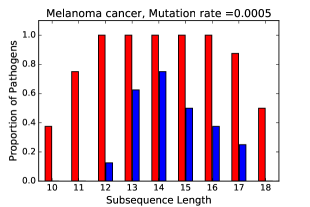
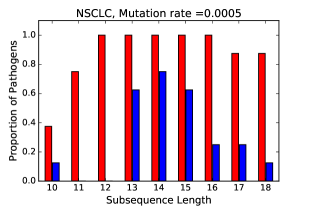
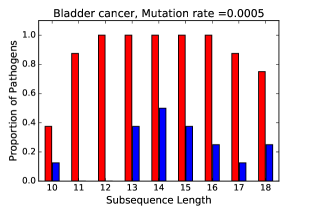
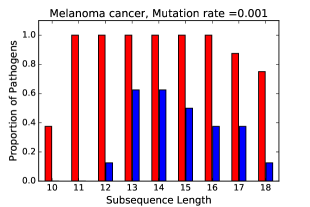
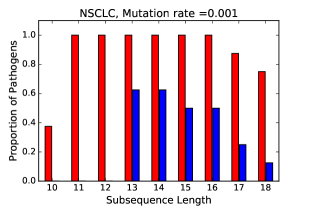
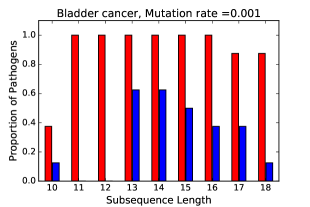
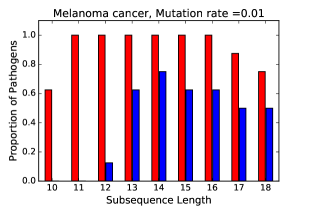
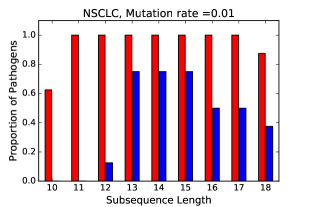
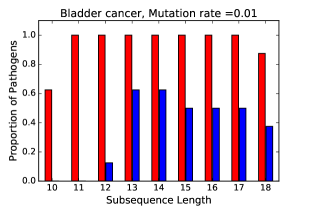
In Fig. 3, each histogram refers to a particular cancer and mutation rate. Red bars refer to Test and blue bars refer to Test . Bar height represents, for any given subsequence length , the proportion of pathogens (out of the considered in this paper) for which the -value is . Related data can be found in the tables of the Appendices A.3 A.4, and A.5 for , , and , respectively. In these tables, the second column refers to , the third column gives a confidence interval for , the fourth column gives the -value for Test and the fifth column gives the -value for Test . We make the following observations:
-
Referring to Test (red bars in Figs. 3), all three mutagenic processes render the human exome more similar to all pathogen DNA sequences at all and . For or the effect of the mutagenic processes on the similarity scores are less conclusive. This suggests that the increase of similarity is particularly relevant in the range of peptide sizes ( amino-acids) that are relevant for epitope presentation in the human MHC presentation. Note, however, that the changes in similarity are small, typically (see tables in Sections A.3-A.5, Columns ).
-
Whether the above change of similarity is due to the specificity of the mutation distribution or random mutations trigger the same effect depends on the pathogen, the length, and the mutation rate. For instance, for Melanoma at the change in similarity due to cancer specific mutations is more pronounced for out of the pathogens, for . By contrast, for all mutagenic processes there appears to be no statistical difference at length .
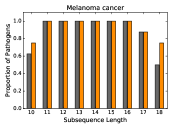
Impact of mutation rate
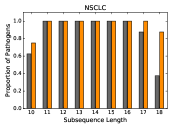
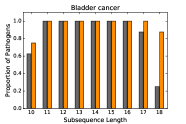
To assess the impact of mutational rate on the similarity between pathogen DNA and human exome, for any given mutagenic process, pathogen DNA, and length we proceeded as follows. We first generated cancer exomes at mutation rate and cancer exomes at mutation rate . Second, we computed the similarity scores of the two sets of cancer exomes relative to the pathogen DNA. -values were computed for comparing the means of the two sets of similarity scores using a two-sample one-sided t-test with a null hypothesis that the true mean of the similarity scores at the lowest rate () is no larger than the true mean of the similarity scores at the higher rate (). We then repeated the experiment for vs. . In Fig. 4, the histograms represent the proportion of pathogens for which the -value is —grey bars refers to the v.s. experiment and the orange bars refer to the v.s. experiment. We obtain the following result:
-
For all combinations of mutagenic processes and pathogens, and for all , a higher mutation rate results in higher similarity score. For results are inconclusive.
2.3 Resiliency of exomes with respect to mutagenic processes
In order to compare the resiliency of the model organism exomes with respect to mutagenic processes, we evaluated the error correction capabilities of the genetic code (the codon allocation to amino-acids) for each combination of model exome and mutagenic process.


Referring to Fig. 5, represents a DNA sequence whose corresponding sequence of amino acids is . This DNA sequence is then passed through a given cancer channel and results in a cancer sequence and a corresponding sequence of cancer amino acids . From and we computed the relative proportion of amino acids that were affected, that is
| (1) |
Finally, averaging over all possible realizations of (and therefore over ), we obtained the average error probability
| (2) |
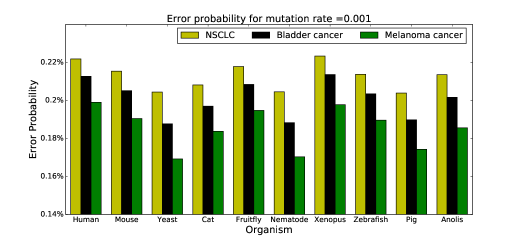
Fig. 6 represents for each combination of model organism, cancer mutation process, and mutation rate . Notice that is not a linear function of . Computation details for are deferred to the Appendix A.6. Referring to Fig. 6, we obtain the following result:
-
Although the proportion of non-synonymous mutations varies across exomes for the three types of mutagenic processes, it is always lowest for melanoma and maximal for lung. Moreover, this ordering holds irrespectively of the intensity of the mutation rate. It should be noted that we evaluated the proportions of non-synonymous mutations for several other organisms as well (including the set of pathogens considered in this paper) and this finding was validated in all cases.
3 Discussion
We employed large scale simulations to model the random (across space) effect of stochastic mutagenic processes on the human normal genome. We believe this is a valid approach since the cancer exome available data does suggest that, while at the granular level mutation rates vary, the mutagenic processes in cancers with large number of mutations affect equally all chromosomal regions of the exome [8]. Essentially, we simplify the analysis using this assumption.
Our in-silico results show that, in general, the typical stochastic mutagenic processes encountered in the major cancer indications with abundant neoantigens do appear to shift the peptide distribution of the modified exome universally towards a landscape that appears more similar to pathogenic insult. Specifically, all three mutagenic processes considered induce subtle but robust shifts in the measure by which we characterized the similarity between the normal human exome and pathogen DNA sequences, at mutation rates in the upper range of the mutation rates observed in actual cancer samples (). Moreover, the range of peptide lengths where this shift happens aligns with the typical length of peptides presented by the human MHC presentation system, suggesting an increased potential for recognition of these types of somatic mutations by a pathogen-trained host immune system.
We also note that for many combinations of pathogen DNA and mutagenic process cases this increase of similarity cannot be solely attributed to the mutation distribution; randomly and uniformly distributed mutations can cause similar shifts in similarity. By contrast, increasing the mutation rate while keeping the underlying mutation distribution fixed always results in an increased similarity betweeen human exome and pathogen DNA at , which again corresponds to the length of peptides presented by the human presentation system. This suggests that the intensity of the mutational rate is an important parameter that directly affects the similarity between cancer exome and pathogen DNA.
We also observe that the effect of the considered mutagenic processes on the likelihood of observing a non-synonymous alteration is strikingly different across processes but consistent across the species studied in our framework (human and model organisms). Melanoma/UV light alterations are the least likely to result in amino acid functional changes, followed by APOBEC-driven alterations and then by smoking alterations, suggesting different error-correcting capabilities of the living exomes towards this various mutagenic insults. This is an attractive observation from an evolutionary perspective: due to universal exposure to sunlight, organisms likely developed similarly universal intrinsic protection from UV light type of modifications to their exomes via the redundancies in the aminoacid codon allocation. Similarly, APOBEC-activation appears to be a universal innate protection mechanism that allows the cell to induce damaging mutations to foreign organisms, while the mutations resulting from tobacco smoking are less likely to have presented evolutionary pressure. In summary, our in-silico approach reveals two competing mechanisms of tolerance pressure on the major mutagenic processes present in human cancers that modulate the potential immune recognition of alterations at the exome level through pathogen similarity and through functional redundancy; the balance between these mechanisms may significantly contribute to the eventual mutational landscape of advanced cancers.
Appendix A Appendices
A.1 Data for Fig. 1
In the table below we listed the similarity scores of each pathogen against the human exome , as a function of the subsequence length .
A.1.1 Matching score of pathogens against human exome
Ebola virus CMV Dengue virus EBV HHV 9 100.0 100.0 100.0 100.0 100.0 10 99.94 99.71 100.0 99.94 99.83 11 98.11 94.88 99.30 98.26 95.96 12 86.99 74.92 91.65 86.74 79.24 13 56.32 43.52 64.19 58.29 49.20 14 23.94 18.64 29.87 27.43 21.84 15 7.82 6.60 9.98 10.05 7.91 16 2.40 2.23 2.81 3.19 2.73 17 0.62 0.77 0.73 1.02 1.05 18 0.12 0.27 0.19 0.33 0.48
HPV Measles virus Yellow fever virus Random 9 100.0 100.0 100.0 100 10 99.97 99.97 100.0 100 11 99.05 98.23 99.05 96.4 12 90.48 86.15 92.10 79.4 13 61.24 54.27 65.28 48.3 14 28.22 22.64 30.54 20 15 9.84 7.29 10.81 6.2 16 3.19 2.19 3.15 1.116 17 1.10 0.68 0.87 0.28 18 0.50 0.19 0.29 0.07
The column “Random” refers to a confidence interval for the similarity score between a randomly generated pathogen sequence , where each nucleotide is independently and uniformly selected with probability , and the normal human exome . To compute this confidence interval we proceeded as follows. The similarity score for a random instance of length is given by
where the ’s are i.i.d. Bernoulli random variables such that
| (3) |
Here denotes the number of distinct length- substrings in the human genome and was computed empirically for :
Taking expectation over yields
A confidence inteval for was computed via Chebyshev’s inequality as follows. We have
| (4) |
Furthermore,
where for the second equality we used the fact that the ’s are identically distributed and that and are independent whenever . Now
and since the ’s are binary random variables
Therefore,
| (5) |
Finally, from (3), (4), and (5) we get
To obtain a confidence interval we picked
| (6) |
which is below for all regardless of the pathogen length .
A.2 Cancer channel
We describe how we obtained cancer channel for a given cancer and mutation rate. For each cancer (Melanoma cancer, NSCLC, Bladder cancer) we considered the set of patients in [8, Supplementary information, Table S2] with that cancer. Then, for every mutation we empirically computed the average proportion of mutations across patients
where denotes the proportion of mutations among all mutations in patient and was computed from [8, Supplementary information, Table S2]. The probability that a nucleotide in the normal exome results in nucleotide in the cancer exome is therefore given by
for and
The parameter denotes the overall mutation rate and denotes the relative number of nucleotide in the exome and was computed from [8, Supplementary information, Table S2].
Remark.
Because in the data from [8, Supplementary information, Table S2] complementary mutations were counted under the same category (e.g., a change from cytosine to tyamine would be treated the same as a change from guanine to adenine), mutation types were considered in pairs. Since the relative proportions of complementary pairs were not given inf, we made the assumption that they were equal. Hence, in the above expression actually corresponds to
where is the complementary pair of .
The second column in the tables of Sections A.3-A.5 represents as a function of . The third column represents a confidence interval for obtained through a standard application of the central limit theorem. This confidence interval is given by
where denotes the average of over the independent trials and where denotes the empirical standard deviation of . The fourth column in the tables of Sections A.3-A.5 gives the -value for Test and the fifth column gives the -value for Test .
A.3
A.3.1 Ebola virus indication
Normal Lung, P-value P-value random 9 100.0 99.99± 1.0 0.5 10 99.94 99.94±0.0002 1.0 11 98.11 98.13±0.0011 0.9999 12 86.99 87.08±0.0022 0.8762 13 56.32 56.45±0.0032 14 23.94 24.03±0.0027 15 7.82 7.86±0.0018 16 2.40 2.41±0.0010 17 0.62 0.63±0.0005 18 0.12 0.12±0.0002 0.4808
Normal Bladder, P-value P-value random 9 100.0 99.99± 1.0 0.5 10 99.94 99.94±0.0002 1.0 11 98.11 98.14±0.0012 0.9872 12 86.99 87.08±0.0022 0.8483 13 56.32 56.45±0.0031 14 23.94 24.02±0.0027 15 7.82 7.85±0.0017 16 2.40 2.41±0.0010 17 0.62 0.63±0.0005 0.0831 18 0.12 0.12±0.0003 0.5661
Normal Mela, P-value P-value random 9 100.0 99.99± 1.0 0.5 10 99.94 99.94±0.0002 1.0 0.0706 11 98.11 98.13±0.0010 1.0 12 86.99 87.07±0.0021 0.9999 13 56.32 56.46±0.0032 14 23.94 24.03±0.0027 15 7.82 7.86±0.0018 16 2.40 2.41±0.0010 17 0.62 0.63±0.0005 18 0.12 0.12±0.0003 0.5378
A.3.2 CMV indication
Normal Lung, P-value P-value random 9 100.0 99.99± 1.0 0.8501 10 99.71 99.72±0.0001 0.9985 11 94.88 94.94±0.0005 1.0 12 74.92 75.05±0.0008 1.0 13 43.52 43.63±0.0008 1.0 14 18.64 18.70±0.0006 1.0 15 6.60 6.62±0.0004 1.0 16 2.23 2.23±0.0002 0.9999 17 0.77 0.77±0.0001 0.9994 18 0.27 0.27±0.0001 0.9999
Normal Bladder, P-value P-value random 9 100.0 99.99± 1.0 0.7875 10 99.71 99.72±0.0001 0.0189 11 94.88 94.95±0.0005 0.9999 12 74.92 75.07±0.0008 1.0 13 43.52 43.64±0.0009 1.0 14 18.64 18.70±0.0007 0.9999 15 6.60 6.62±0.0004 0.9999 16 2.23 2.24±0.0003 0.9760 17 0.77 0.77±0.0001 0.8426 18 0.27 0.27±0.0001 0.4867
Normal Mela, P-value P-value random 9 100.0 99.99± 1.0 0.1131 10 99.71 99.72±0.0001 0.9999 11 94.88 94.94±0.0005 1.0 12 74.92 75.04±0.0008 1.0 13 43.52 43.62±0.0008 1.0 14 18.64 18.69±0.0007 1.0 15 6.60 6.61±0.0004 1.0 16 2.23 2.23±0.0002 1.0 17 0.77 0.77±0.0001 0.9999 18 0.27 0.27±0.0001 0.7213
A.3.3 Dengue virus indication
Normal Lung, P-value P-value random 9 100.0 99.99± 1.0 0.5 10 100.0 99.98± 1.0 0.9714 11 99.30 99.29±0.0010 0.9943 0.9994 12 91.65 91.69±0.0026 0.7855 13 64.19 64.29±0.0041 0.1778 14 29.87 29.94±0.0042 15 9.98 10.01±0.0028 0.0106 16 2.81 2.82±0.0016 0.0929 17 0.73 0.74±0.0008 0.2427 18 0.19 0.19±0.0004 0.9153
Normal Bladder, P-value P-value random 9 100.0 99.99± 1.0 0.5 10 100.0 99.99± 1.0 0.8042 11 99.30 99.30±0.0010 0.3967 12 91.65 91.69±0.0026 0.6794 13 64.19 64.29±0.0042 0.1061 14 29.87 29.93±0.0038 0.0510 15 9.98 10.01±0.0026 0.1582 16 2.81 2.82±0.0016 0.1172 17 0.73 0.74±0.0008 0.1540 18 0.19 0.19±0.0004 0.0110 0.9427
Normal Mela, P-value P-value random 9 100.0 99.99± 1.0 0.5 10 100.0 99.99± 1.0 0.5910 11 99.30 99.29±0.0010 0.9987 0.9998 12 91.65 91.69±0.0027 0.9877 13 64.19 64.29±0.0043 14 29.87 29.94±0.0041 15 9.98 10.02±0.0027 16 2.81 2.82±0.0015 0.0267 17 0.73 0.74±0.0009 0.2552 18 0.19 0.19±0.0005 0.0911 0.9770
A.3.4 EBV indication
Normal Lung, P-value P-value random 9 100.0 99.99± 1.0 0.9525 10 99.94 99.94± 0.9863 11 98.26 98.29±0.0004 1.0 12 86.74 86.82±0.0008 1.0 13 58.29 58.39±0.0011 1.0 14 27.43 27.49±0.0010 1.0 15 10.05 10.07±0.0008 1.0 16 3.19 3.20±0.0005 0.9999 17 1.02 1.02±0.0003 0.9999 18 0.33 0.33±0.0002 0.9997
Normal Bladder, P-value P-value random 9 100.0 99.99± 1.0 0.7931 10 99.94 99.94± 0.2122 11 98.26 98.29±0.0004 0.9999 12 86.74 86.83±0.0009 1.0 13 58.29 58.40±0.0011 1.0 14 27.43 27.49±0.0010 1.0 15 10.05 10.07±0.0008 1.0 16 3.19 3.20±0.0006 0.9999 17 1.02 1.02±0.0003 0.9999 18 0.33 0.33±0.0002 0.9997
Normal Mela, P-value P-value random 9 100.0 99.99± 1.0 0.2818 10 99.94 99.94± 0.9409 11 98.26 98.28±0.0004 1.0 12 86.74 86.82±0.0008 1.0 13 58.29 58.38±0.0011 1.0 14 27.43 27.48±0.0010 1.0 15 10.05 10.06±0.0008 1.0 16 3.19 3.20±0.0005 1.0 17 1.02 1.02±0.0003 1.0 18 0.33 0.33±0.0002 0.8882 0.9999
A.3.5 HHV indication
Normal Lung, P-value P-value random 9 100.0 99.99± 1.0 0.5 10 99.83 99.83±0.0001 0.9998 11 95.96 96.02±0.0006 1.0 12 79.24 79.36±0.0013 1.0 13 49.20 49.32±0.0015 14 21.84 21.91±0.0011 15 7.91 7.94±0.0007 16 2.73 2.74±0.0004 17 1.05 1.05±0.0003 18 0.48 0.48±0.0003
Normal Bladder, P-value P-value random 9 100.0 99.99± 1.0 0.0510 10 99.83 99.83±0.0001 0.9294 11 95.96 96.02±0.0006 0.9999 12 79.24 79.37±0.0014 0.9773 13 49.20 49.32±0.0015 14 21.84 21.91±0.0012 15 7.91 7.94±0.0007 16 2.73 2.74±0.0005 17 1.05 1.05±0.0003 18 0.48 0.48±0.0002
Normal Mela, P-value P-value random 9 100.0 99.99± 1.0 0.7979 10 99.83 99.83±0.0001 0.9999 11 95.96 96.01±0.0006 1.0 12 79.24 79.36±0.0015 1.0 13 49.20 49.32±0.0015 14 21.84 21.91±0.0013 15 7.91 7.94±0.0007 16 2.73 2.74±0.0005 17 1.05 1.05±0.0003 18 0.48 0.48±0.0004 0.0614 0.0148
A.3.6 HPV indication
Normal Lung, P-value P-value random 9 100.0 99.98±0.0 1.0 nan 10 99.97 99.96±0.0002 1.0 0.3552 11 99.05 99.04±0.0012 0.9761 0.9939 12 90.48 90.54±0.0032 0.0528 13 61.24 61.37±0.0048 14 28.22 28.30±0.0042 15 9.84 9.88±0.0030 16 3.19 3.20±0.0017 0.0111 17 1.10 1.10±0.0010 0.4128 18 0.50 0.50±0.0006 0.5864
Normal Bladder, P-value P-value random 9 100.0 99.98±0.0 1.0 nan 10 99.97 99.96±0.0002 1.0 0.8341 11 99.05 99.04±0.0011 0.9898 0.9969 12 90.48 90.54±0.0030 0.5926 13 61.24 61.36±0.0049 14 28.22 28.29±0.0040 15 9.84 9.88±0.0029 16 3.19 3.20±0.0017 0.0160 17 1.10 1.10±0.0010 0.8741 18 0.50 0.50±0.0005 0.7670
Normal Mela, P-value P-value random 9 100.0 99.98±0.0 1.0 nan 10 99.97 99.96±0.0003 1.0 0.2953 11 99.05 99.04±0.0011 0.9943 0.9980 12 90.48 90.54±0.0030 13 61.24 61.38±0.0046 14 28.22 28.31±0.0041 15 9.84 9.88±0.0030 16 3.19 3.20±0.0018 17 1.10 1.10±0.0010 0.3923 18 0.50 0.50±0.0006 0.6700
A.3.7 Measles virus indication
Normal Lung, P-value P-value random 9 100.0 99.99± 1.0 0.5 10 99.97 99.96±0.0002 1.0 0.9512 11 98.23 98.25±0.0012 0.9931 12 86.15 86.24±0.0025 0.0257 13 54.27 54.40±0.0035 14 22.64 22.72±0.0030 15 7.29 7.32±0.0019 16 2.19 2.20±0.0011 0.0878 17 0.68 0.68±0.0006 0.7775 0.9909 18 0.19 0.19±0.0003 0.1692 0.4103
Normal Bladder, P-value P-value random 9 100.0 99.99± 1.0 0.5 10 99.97 99.96±0.0002 1.0 0.8931 11 98.23 98.25±0.0012 0.9887 12 86.15 86.24±0.0027 0.6929 13 54.27 54.40±0.0034 0.0118 14 22.64 22.72±0.0029 15 7.29 7.32±0.0020 0.3013 16 2.19 2.20±0.0011 0.4939 17 0.68 0.68±0.0006 0.0737 0.8014 18 0.19 0.19±0.0003 0.6188 0.7503
Normal Mela, P-value P-value random 9 100.0 99.99± 1.0 0.5 10 99.97 99.96±0.0002 1.0 0.9656 11 98.23 98.25±0.0012 0.9999 12 86.15 86.24±0.0025 0.5577 13 54.27 54.40±0.0034 14 22.64 22.72±0.0030 15 7.29 7.32±0.0020 0.1858 16 2.19 2.20±0.0011 0.4911 17 0.68 0.68±0.0006 0.2713 0.9212 18 0.19 0.19±0.0003 0.9773 0.9687
A.3.8 Yellow fever virus indication
Normal Lung, P-value P-value random 9 100.0 99.99± 1.0 0.5 10 100.0 99.98±0.0001 1.0 0.7992 11 99.05 99.05±0.0011 0.9959 12 92.10 92.16±0.0028 0.7110 13 65.28 65.38±0.0042 14 30.54 30.61±0.0040 15 10.81 10.83±0.0028 16 3.15 3.16±0.0017 0.3423 17 0.87 0.87±0.0009 0.0814 18 0.29 0.29±0.0005 0.1116
Normal Bladder, P-value P-value random 9 100.0 99.99± 1.0 0.5 10 100.0 99.98±0.0001 1.0 0.4066 11 99.05 99.05±0.0011 0.9801 12 92.10 92.16±0.0027 0.7498 13 65.28 65.38±0.0041 0.0445 14 30.54 30.61±0.0042 0.0112 15 10.81 10.83±0.0028 0.2486 16 3.15 3.16±0.0017 0.6824 17 0.87 0.87±0.0009 0.0726 18 0.29 0.29±0.0006
Normal Mela, P-value P-value random 9 100.0 99.99± 1.0 0.5 10 100.0 99.98±0.0001 1.0 0.3586 11 99.05 99.05±0.0011 0.9999 12 92.10 92.16±0.0025 0.9998 13 65.28 65.38±0.0043 0.0127 14 30.54 30.61±0.0040 15 10.81 10.83±0.0028 0.0410 16 3.15 3.16±0.0016 0.2823 17 0.87 0.87±0.0009 0.2685 18 0.29 0.29±0.0005 0.0670
A.4
A.4.1 Ebola virus indication
Normal Lung, P-value P-value random 9 100.0 99.99± 1.0 0.5 10 99.94 99.94±0.0003 1.0 0.3328 11 98.11 98.16±0.0015 0.9999 12 86.99 87.16±0.0031 0.2037 13 56.32 56.58±0.0045 14 23.94 24.11±0.0040 15 7.82 7.88±0.0025 16 2.40 2.42±0.0014 17 0.62 0.63±0.0008 18 0.12 0.12±0.0004 0.0393
Normal Bladder, P-value P-value random 9 100.0 99.99± 1.0 0.5 10 99.94 99.94±0.0003 0.9999 11 98.11 98.17±0.0015 0.9999 12 86.99 87.16±0.0031 0.4714 13 56.32 56.57±0.0043 14 23.94 24.10±0.0038 15 7.82 7.88±0.0025 16 2.40 2.42±0.0014 17 0.62 0.63±0.0008 18 0.12 0.12±0.0004 0.0521
Normal Mela, P-value P-value random 9 100.0 99.99± 1.0 0.5 10 99.94 99.94±0.0002 1.0 0.8304 11 98.11 98.16±0.0015 1.0 12 86.99 87.15±0.0032 0.9989 13 56.32 56.59±0.0045 14 23.94 24.12±0.0039 15 7.82 7.89±0.0025 16 2.40 2.42±0.0014 17 0.62 0.63±0.0007 18 0.12 0.12±0.0004 0.1217
A.4.2 CMV indication
Normal Lung, P-value P-value random 9 100.0 99.99± 1.0 0.6082 10 99.71 99.73±0.0002 0.9999 11 94.88 95.01±0.0007 1.0 12 74.92 75.18±0.0011 1.0 13 43.52 43.74±0.0012 1.0 14 18.64 18.75±0.0010 1.0 15 6.60 6.63±0.0006 1.0 16 2.23 2.24±0.0003 1.0 17 0.77 0.77±0.0002 0.9999 18 0.27 0.27±0.0001 0.9987
Normal Bladder, P-value P-value random 9 100.0 99.99± 1.0 0.5183 10 99.71 99.73±0.0002 0.0255 11 94.88 95.02±0.0007 0.9999 12 74.92 75.21±0.0011 1.0 13 43.52 43.76±0.0012 1.0 14 18.64 18.76±0.0010 1.0 15 6.60 6.64±0.0007 0.9999 16 2.23 2.24±0.0004 0.9999 17 0.77 0.77±0.0002 0.5676 18 0.27 0.27±0.0001 0.3313
Normal Mela, P-value P-value random 9 100.0 99.99± 1.0 0.7682 10 99.71 99.73±0.0002 0.9999 11 94.88 95.00±0.0007 1.0 12 74.92 75.16±0.0011 1.0 13 43.52 43.72±0.0012 1.0 14 18.64 18.73±0.0010 1.0 15 6.60 6.63±0.0006 1.0 16 2.23 2.24±0.0004 1.0 17 0.77 0.77±0.0002 0.9999 18 0.27 0.27±0.0001 0.7692
A.4.3 Dengue virus indication
Normal Lung, P-value P-value random 9 100.0 99.99± 1.0 0.5 10 100.0 99.98± 1.0 0.3914 11 99.30 99.31±0.0014 0.9896 12 91.65 91.75±0.0038 0.9918 13 64.19 64.40±0.0060 14 29.87 30.01±0.0056 15 9.98 10.04±0.0039 16 2.81 2.83±0.0023 17 0.73 0.74±0.0012 0.4424 18 0.19 0.19±0.0005 0.0456 0.9791
Normal Bladder, P-value P-value random 9 100.0 99.99± 1.0 0.5 10 100.0 99.98±0.0001 1.0 0.8145 11 99.30 99.31±0.0014 0.9694 12 91.65 91.75±0.0036 0.9986 13 64.19 64.39±0.0059 14 29.87 30.01±0.0057 15 9.98 10.04±0.0039 16 2.81 2.83±0.0021 0.0433 17 0.73 0.74±0.0012 0.5961 18 0.19 0.19±0.0006 0.8638
Normal Mela, P-value P-value random 9 100.0 99.99± 1.0 0.5 10 100.0 99.98± 1.0 0.4457 11 99.30 99.30±0.0013 0.9999 12 91.65 91.75±0.0035 0.9999 13 64.19 64.41±0.0061 14 29.87 30.02±0.0055 15 9.98 10.05±0.0037 16 2.81 2.83±0.0023 0.2108 17 0.73 0.74±0.0012 0.3675 18 0.19 0.19±0.0006 0.7893
A.4.4 EBV indication
Normal Lung, P-value P-value random 9 100.0 99.99± 1.0 0.1418 10 99.94 99.95±0.0001 0.7993 11 98.26 98.31±0.0005 1.0 12 86.74 86.91±0.0012 1.0 13 58.29 58.49±0.0016 1.0 14 27.43 27.54±0.0015 1.0 15 10.05 10.08±0.0012 1.0 16 3.19 3.20±0.0008 1.0 17 1.02 1.03±0.0004 0.9999 18 0.33 0.33±0.0002 0.9999
Normal Bladder, P-value P-value random 9 100.0 99.99± 1.0 0.2185 10 99.94 99.95±0.0001 0.1288 11 98.26 98.31±0.0005 0.9999 12 86.74 86.92±0.0012 1.0 13 58.29 58.50±0.0016 1.0 14 27.43 27.55±0.0014 1.0 15 10.05 10.09±0.0012 1.0 16 3.19 3.20±0.0008 1.0 17 1.02 1.03±0.0004 0.9999 18 0.33 0.33±0.0003 0.9999
Normal Mela, P-value P-value random 9 100.0 99.99± 1.0 0.0412 10 99.94 99.95±0.0001 0.9878 11 98.26 98.31±0.0005 1.0 12 86.74 86.90±0.0012 1.0 13 58.29 58.47±0.0016 1.0 14 27.43 27.52±0.0014 1.0 15 10.05 10.07±0.0011 1.0 16 3.19 3.20±0.0008 1.0 17 1.02 1.02±0.0004 1.0 18 0.33 0.33±0.0002 0.9238 1.0
A.4.5 HHV indication
Normal Lung, P-value P-value random 9 100.0 99.99± 1.0 0.2959 10 99.83 99.84±0.0002 1.0 11 95.96 96.07±0.0008 1.0 12 79.24 79.48±0.0018 1.0 13 49.20 49.45±0.0021 14 21.84 21.98±0.0018 15 7.91 7.97±0.0010 16 2.73 2.75±0.0007 17 1.05 1.06±0.0005 18 0.48 0.48±0.0004
Normal Bladder, P-value P-value random 9 100.0 99.99± 1.0 0.5000 10 99.83 99.84±0.0002 0.9739 11 95.96 96.08±0.0008 1.0 12 79.24 79.49±0.0018 0.9999 13 49.20 49.45±0.0023 14 21.84 21.98±0.0018 15 7.91 7.97±0.0010 16 2.73 2.75±0.0007 17 1.05 1.06±0.0004 18 0.48 0.48±0.0005
Normal Mela, P-value P-value random 9 100.0 99.99± 1.0 0.8155 10 99.83 99.84±0.0002 1.0 11 95.96 96.06±0.0008 1.0 12 79.24 79.47±0.0020 1.0 13 49.20 49.45±0.0022 14 21.84 21.99±0.0017 15 7.91 7.97±0.0011 16 2.73 2.75±0.0007 17 1.05 1.06±0.0004 18 0.48 0.48±0.0005
A.4.6 HPV indication
Normal Lung, P-value P-value random 9 100.0 99.98± 1.0 0.5 10 99.97 99.96±0.0004 1.0 0.4823 11 99.05 99.05±0.0016 0.9992 12 90.48 90.61±0.0044 0.0447 13 61.24 61.48±0.0068 14 28.22 28.39±0.0062 15 9.84 9.91±0.0042 16 3.19 3.22±0.0024 17 1.10 1.11±0.0015 0.0765 18 0.50 0.50±0.0009 0.3499
Normal Bladder, P-value P-value random 9 100.0 99.98± 1.0 0.5 10 99.97 99.96±0.0003 1.0 0.2536 11 99.05 99.06±0.0016 0.9969 12 90.48 90.61±0.0044 0.2479 13 61.24 61.47±0.0067 14 28.22 28.38±0.0061 15 9.84 9.91±0.0040 16 3.19 3.21±0.0025 17 1.10 1.10±0.0014 0.4720 18 0.50 0.50±0.0008 0.8303
Normal Mela, P-value P-value random 9 100.0 99.98± 1.0 0.5 10 99.97 99.96±0.0003 1.0 0.4093 11 99.05 99.05±0.0016 0.9998 12 90.48 90.62±0.0043 13 61.24 61.50±0.0069 14 28.22 28.40±0.0059 15 9.84 9.92±0.0040 16 3.19 3.22±0.0025 17 1.10 1.11±0.0014 0.0188 18 0.50 0.50±0.0008 0.3983
A.4.7 Measles virus indication
Normal Lung, P-value P-value random 9 100.0 99.99± 1.0 0.5 10 99.97 99.97±0.0003 1.0 0.4318 11 98.23 98.28±0.0017 0.9998 12 86.15 86.34±0.0036 0.5411 13 54.27 54.53±0.0050 14 22.64 22.79±0.0043 15 7.29 7.34±0.0028 0.1535 16 2.19 2.20±0.0015 0.3683 17 0.68 0.68±0.0008 0.0104 0.4496 18 0.19 0.19±0.0004 0.9896 0.7992
Normal Bladder, P-value P-value random 9 100.0 99.99± 1.0 0.5 10 99.97 99.97±0.0003 1.0 0.3667 11 98.23 98.28±0.0017 0.9969 12 86.15 86.34±0.0035 0.1666 13 54.27 54.52±0.0050 14 22.64 22.78±0.0042 15 7.29 7.34±0.0029 0.9235 16 2.19 2.20±0.0016 0.5732 17 0.68 0.68±0.0009 0.2049 0.7833 18 0.19 0.19±0.0004 0.3444 0.1426
Normal Mela, P-value P-value random 9 100.0 99.99± 1.0 0.5 10 99.97 99.97±0.0002 1.0 0.1908 11 98.23 98.27±0.0015 0.9999 12 86.15 86.34±0.0037 0.9581 13 54.27 54.53±0.0047 14 22.64 22.78±0.0041 15 7.29 7.34±0.0027 0.9399 16 2.19 2.20±0.0016 0.2985 17 0.68 0.68±0.0009 0.3218 0.8489 18 0.19 0.19±0.0004 0.8608 0.4713
A.4.8 Yellow fever virus indication
Normal Lung, P-value P-value random 9 100.0 99.99± 1.0 0.5 10 100.0 99.98±0.0001 1.0 0.9805 11 99.05 99.07±0.0015 0.9999 12 92.10 92.21±0.0038 0.9061 13 65.28 65.48±0.0059 0.6362 14 30.54 30.68±0.0056 0.1009 15 10.81 10.86±0.0040 0.2397 16 3.15 3.17±0.0024 0.7796 17 0.87 0.87±0.0013 0.0412 18 0.29 0.29±0.0007 0.1197
Normal Bladder, P-value P-value random 9 100.0 99.99± 1.0 0.5 10 100.0 99.98±0.0001 1.0 0.9826 11 99.05 99.07±0.0015 0.8695 12 92.10 92.21±0.0038 0.9591 13 65.28 65.47±0.0062 0.8768 14 30.54 30.67±0.0058 0.6535 15 10.81 10.85±0.0040 0.3259 16 3.15 3.17±0.0024 0.7424 17 0.87 0.88±0.0013 18 0.29 0.29±0.0008 0.0134
Normal Mela, P-value P-value random 9 100.0 99.99± 1.0 0.5 10 100.0 99.98±0.0001 1.0 0.9725 11 99.05 99.06±0.0015 0.9999 12 92.10 92.20±0.0038 0.9993 13 65.28 65.48±0.0059 0.4637 14 30.54 30.68±0.0057 0.1347 15 10.81 10.86±0.0039 0.0967 16 3.15 3.17±0.0023 0.0534 17 0.87 0.87±0.0014 18 0.29 0.29±0.0007 0.0580
A.5
A.5.1 Ebola virus indication
Normal Lung, P-value P-value random 9 100.0 99.99± 1.0 0.5 10 99.94 99.96±0.0005 0.9989 11 98.11 98.61±0.0035 1.0 12 86.99 88.54±0.0080 0.9074 13 56.32 58.74±0.0125 14 23.94 25.48±0.0119 15 7.82 8.41±0.0079 16 2.40 2.57±0.0045 17 0.62 0.68±0.0025 18 0.12 0.14±0.0013 0.0210
Normal Bladder, P-value P-value random 9 100.0 99.99± 1.0 0.5 10 99.94 99.96±0.0005 0.8464 11 98.11 98.62±0.0036 1.0 12 86.99 88.54±0.0083 0.8328 13 56.32 58.63±0.0124 14 23.94 25.40±0.0112 15 7.82 8.38±0.0076 16 2.40 2.56±0.0044 17 0.62 0.68±0.0024 18 0.12 0.14±0.0013
Normal Mela, P-value P-value random 9 100.0 99.99± 1.0 1.0 10 99.94 99.96±0.0005 0.9999 11 98.11 98.55±0.0035 1.0 12 86.99 88.45±0.0081 1.0 13 56.32 58.78±0.0130 14 23.94 25.58±0.0113 15 7.82 8.46±0.0075 16 2.40 2.59±0.0044 17 0.62 0.68±0.0024 18 0.12 0.14±0.0013
A.5.2 CMV indication
Normal Lung, P-value P-value random 9 100.0 99.99± 1.0 0.4631 10 99.71 99.84±0.0004 1.0 11 94.88 95.97±0.0017 1.0 12 74.92 77.22±0.0031 1.0 13 43.52 45.49±0.0035 1.0 14 18.64 19.54±0.0029 1.0 15 6.60 6.89±0.0019 1.0 16 2.23 2.31±0.0011 1.0 17 0.77 0.79±0.0007 1.0 18 0.27 0.28±0.0004 1.0
Normal Bladder, P-value P-value random 9 100.0 99.99± 1.0 0.1164 10 99.71 99.85±0.0004 0.2682 11 94.88 96.06±0.0017 1.0 12 74.92 77.45±0.0031 1.0 13 43.52 45.67±0.0036 1.0 14 18.64 19.63±0.0029 1.0 15 6.60 6.93±0.0020 1.0 16 2.23 2.33±0.0012 1.0 17 0.77 0.79±0.0007 0.9999 18 0.27 0.28±0.0004 0.9996
Normal Mela, P-value P-value random 9 100.0 99.99± 1.0 0.4026 10 99.71 99.83±0.0004 1.0 11 94.88 95.88±0.0017 1.0 12 74.92 76.94±0.0032 1.0 13 43.52 45.20±0.0036 1.0 14 18.64 19.39±0.0029 1.0 15 6.60 6.84±0.0020 1.0 16 2.23 2.30±0.0011 1.0 17 0.77 0.78±0.0007 1.0 18 0.27 0.28±0.0004 0.9999
A.5.3 Dengue virus indication
Normal Lung, P-value P-value random 9 100.0 99.99± 1.0 0.5 10 100.0 99.98±0.0002 1.0 0.9511 11 99.30 99.45±0.0033 1.0 12 91.65 92.69±0.0094 0.9996 13 64.19 66.20±0.0159 14 29.87 31.21±0.0169 15 9.98 10.52±0.0119 16 2.81 2.99±0.0072 17 0.73 0.78±0.0035 0.0167 18 0.19 0.20±0.0019 0.9490
Normal Bladder, P-value P-value random 9 100.0 99.99± 1.0 0.5 10 100.0 99.98±0.0002 1.0 0.3175 11 99.30 99.47±0.0033 0.9999 12 91.65 92.69±0.0094 0.9999 13 64.19 66.12±0.0163 14 29.87 31.12±0.0166 15 9.98 10.49±0.0114 16 2.81 2.97±0.0066 17 0.73 0.78±0.0037 0.6529 18 0.19 0.20±0.0018 0.9154
Normal Mela, P-value P-value random 9 100.0 99.99± 1.0 10 100.0 99.98±0.0002 1.0 0.9623 11 99.30 99.43±0.0032 1.0 12 91.65 92.60±0.0094 1.0 13 64.19 66.19±0.0168 14 29.87 31.23±0.0163 15 9.98 10.53±0.0114 16 2.81 2.98±0.0068 17 0.73 0.78±0.0035 0.8850 18 0.19 0.20±0.0019 0.9918
A.5.4 EBV indication
Normal Lung, P-value P-value random 9 100.0 99.99± 1.0 0.4341 10 99.94 99.97±0.0002 0.9999 11 98.26 98.69±0.0013 1.0 12 86.74 88.26±0.0032 1.0 13 58.29 60.10±0.0047 1.0 14 27.43 28.38±0.0043 1.0 15 10.05 10.34±0.0033 1.0 16 3.19 3.28±0.0025 1.0 17 1.02 1.04±0.0014 1.0 18 0.33 0.33±0.0008 1.0
Normal Bladder, P-value P-value random 9 100.0 99.99± 1.0 0.1901 10 99.94 99.97±0.0002 0.2963 11 98.26 98.71±0.0012 1.0 12 86.74 88.35±0.0033 1.0 13 58.29 60.16±0.0046 1.0 14 27.43 28.42±0.0044 1.0 15 10.05 10.37±0.0034 1.0 16 3.19 3.29±0.0024 1.0 17 1.02 1.05±0.0015 1.0 18 0.33 0.33±0.0010 1.0
Normal Mela, P-value P-value random 9 100.0 99.99± 1.0 0.3681 10 99.94 99.97±0.0002 1.0 11 98.26 98.66±0.0013 1.0 12 86.74 88.11±0.0033 1.0 13 58.29 59.85±0.0046 1.0 14 27.43 28.16±0.0042 1.0 15 10.05 10.23±0.0033 1.0 16 3.19 3.24±0.0022 1.0 17 1.02 1.03±0.0013 1.0 18 0.33 0.32±0.0008 1.0 1.0
A.5.5 HHV indication
Normal Lung, P-value P-value random 9 100.0 99.99± 1.0 0.7781 10 99.83 99.90±0.0004 1.0 11 95.96 96.87±0.0020 1.0 12 79.24 81.36±0.0050 1.0 13 49.20 51.48±0.0060 14 21.84 23.18±0.0050 15 7.91 8.42±0.0031 16 2.73 2.89±0.0021 17 1.05 1.09±0.0015 18 0.48 0.49±0.0017
Normal Bladder, P-value P-value random 9 100.0 99.99± 1.0 0.5638 10 99.83 99.90±0.0004 0.9999 11 95.96 96.93±0.0021 1.0 12 79.24 81.48±0.0051 1.0 13 49.20 51.50±0.0067 14 21.84 23.15±0.0051 15 7.91 8.41±0.0033 16 2.73 2.89±0.0021 17 1.05 1.10±0.0016 18 0.48 0.49±0.0017
Normal Mela, P-value P-value random 9 100.0 99.99± 1.0 0.8672 10 99.83 99.89±0.0004 1.0 11 95.96 96.79±0.0021 1.0 12 79.24 81.22±0.0052 1.0 13 49.20 51.50±0.0069 14 21.84 23.26±0.0055 15 7.91 8.48±0.0034 16 2.73 2.91±0.0022 17 1.05 1.11±0.0015 18 0.48 0.49±0.0017
A.5.6 HPV indication
Normal Lung, P-value P-value random 9 100.0 99.98± 1.0 0.1587 10 99.97 99.96±0.0007 1.0 0.9984 11 99.05 99.23±0.0039 0.9999 12 90.48 91.75±0.0114 13 61.24 63.56±0.0183 14 28.22 29.77±0.0175 15 9.84 10.55±0.0124 16 3.19 3.45±0.0076 17 1.10 1.19±0.0046 18 0.50 0.53±0.0025
Normal Bladder, P-value P-value random 9 100.0 99.98± 1.0 0.5 10 99.97 99.97±0.0007 1.0 0.9724 11 99.05 99.24±0.0039 0.9999 12 90.48 91.71±0.0111 13 61.24 63.34±0.0182 14 28.22 29.65±0.0180 15 9.84 10.48±0.0121 16 3.19 3.43±0.0072 17 1.10 1.17±0.0042 18 0.50 0.52±0.0024 0.5377
Normal Mela, P-value P-value random 9 100.0 99.98± 1.0 0.1587 10 99.97 99.96±0.0007 1.0 0.9999 11 99.05 99.21±0.0038 1.0 12 90.48 91.77±0.0115 13 61.24 63.70±0.0181 14 28.22 29.96±0.0179 15 9.84 10.64±0.0124 16 3.19 3.48±0.0072 17 1.10 1.19±0.0043 18 0.50 0.53±0.0025
A.5.7 Measles virus indication
Normal Lung, P-value P-value random 9 100.0 99.99± 1.0 0.5 10 99.97 99.98±0.0004 0.9998 11 98.23 98.70±0.0037 1.0 12 86.15 87.87±0.0094 0.9934 13 54.27 56.70±0.0140 14 22.64 23.98±0.0127 15 7.29 7.73±0.0084 16 2.19 2.29±0.0049 0.5766 17 0.68 0.69±0.0027 0.3373 18 0.19 0.19±0.0013 0.5424 0.0179
Normal Bladder, P-value P-value random 9 100.0 99.99± 1.0 0.5 10 99.97 99.98±0.0004 0.9992 11 98.23 98.71±0.0037 1.0 12 86.15 87.88±0.0091 0.3703 13 54.27 56.57±0.0138 14 22.64 23.86±0.0124 15 7.29 7.69±0.0078 0.5972 16 2.19 2.28±0.0049 0.9990 17 0.68 0.69±0.0026 0.7406 18 0.19 0.19±0.0014 0.5426 0.0220
Normal Mela, P-value P-value random 9 100.0 99.99± 1.0 1.0 10 99.97 99.98±0.0004 0.9999 11 98.23 98.65±0.0038 1.0 12 86.15 87.81±0.0096 1.0 13 54.27 56.61±0.0131 14 22.64 23.92±0.0121 15 7.29 7.71±0.0082 0.0134 16 2.19 2.27±0.0048 0.9999 17 0.68 0.68±0.0026 0.0137 0.9609 18 0.19 0.19±0.0014 0.9999 0.9017
A.5.8 Yellow fever virus indication
Normal Lung, P-value P-value random 9 100.0 99.99± 1.0 0.5 10 100.0 99.98±0.0002 1.0 0.6664 11 99.05 99.30±0.0034 1.0 12 92.10 93.10±0.0094 1.0 13 65.28 67.19±0.0169 14 30.54 31.81±0.0176 15 10.81 11.26±0.0119 16 3.15 3.32±0.0070 0.3854 17 0.87 0.94±0.0039 18 0.29 0.31±0.0022
Normal Bladder, P-value P-value random 9 100.0 99.99± 1.0 0.5 10 100.0 99.98±0.0003 1.0 0.9609 11 99.05 99.30±0.0034 0.9999 12 92.10 93.11±0.0096 0.9999 13 65.28 67.09±0.0173 0.9999 14 30.54 31.75±0.0164 0.0112 15 10.81 11.25±0.0116 0.0579 16 3.15 3.32±0.0068 0.1432 17 0.87 0.94±0.0038 18 0.29 0.32±0.0023
Normal Mela, P-value P-value random 9 100.0 99.99± 1.0 10 100.0 99.98±0.0003 1.0 0.9888 11 99.05 99.26±0.0036 1.0 12 92.10 93.01±0.0090 1.0 13 65.28 67.03±0.0170 1.0 14 30.54 31.77±0.0166 15 10.81 11.26±0.0121 16 3.15 3.33±0.0073 17 0.87 0.95±0.0040 18 0.29 0.32±0.0023
A.6 Error probability data for Fig. 6
To compute in (2) we proceeded as follows. We have
| (7) |
where the summation ranges over amino acid positions. Let us compute —for the other terms we proceed in the same way. Observe that is a function of the first three nucleotides of the normal exome . To emphasize this, let us write as . Similarly, is a function of the first three nucleotides of the cancer genome and we write it as . Therefore, we have
| (8) |
where is the cancer channel defined in the Appendix A.2.
Acknowledgements
The authors would like to thank Ka Kit Lam for early discussions on this work.
References
- [1] Hoos. Development of Immuno-Oncology Drugs – from CTLA4 to PD1 to thte next generations. Nature Reviews Drug Discovery. 2016;15:235–247.
- [2] Mariathasan S, Turley SJ, Nickles D, Castiglioni A, Yuen K, Wang Y, et al. TGF attenuates tumour response to PD-L1 blockade by contributing to exclusion of T cells. Nature. 2018;554(7693):544.
- [3] Chowell D, Morris LG, Grigg CM, Weber JK, Samstein RM, Makarov V, et al. Patient HLA class I genotype influences cancer response to checkpoint blockade immunotherapy. Science. 2018;359(6375):582–587.
- [4] Riaz N, Havel JJ, Makarov V, Desrichard A, Urba WJ, Sims JS, et al. Tumor and microenvironment evolution during immunotherapy with nivolumab. Cell. 2017;171(4):934–949.
- [5] Łuksza M, Riaz N, Makarov V, Balachandran VP, Hellmann MD, Solovyov A, et al. A neoantigen fitness model predicts tumour response to checkpoint blockade immunotherapy. Nature. 2017;551(7681):517.
- [6] The Cancer Genome Atlas. cancergenomenihgov;.
- [7] Alexandrov LB, Nik-Zainal S, Wedge DC, Aparicio SA, Behjati S, Biankin AV, et al. Signatures of mutational processes in human cancer. Nature. 2013;500(7463):415–421.
- [8] Lawrence MS, Stojanov P, Polak P, Kryukov GV, Cibulskis K, Sivachenko A, et al. Mutational heterogeneity in cancer and the search for new cancer-associated genes. Nature. 2013;499(7457):214–218.
- [9] Rooney MS, Shukla SA, Wu CJ, Getz G, Hacohen N. Molecular and genetic properties of tumors associated with local immune cytolytic activity. Cell. 2015;160(1):48–61.
- [10] Van Allen EM, Miao D, Schilling B, Shukla SA, Blank C, Zimmer L, et al. Genomic correlates of response to CTLA-4 blockade in metastatic melanoma. Science. 2015;350(6257):207–211.
- [11] Snyder A, Makarov V, Merghoub T, Yuan J, Zaretsky JM, Desrichard A, et al. Genetic basis for clinical response to CTLA-4 blockade in melanoma. New England Journal of Medicine. 2014;371(23):2189–2199.
- [12] Rizvi NA, Hellmann MD, Snyder A, Kvistborg P, Makarov V, Havel JJ, et al. Mutational landscape determines sensitivity to PD-1 blockade in non–small cell lung cancer. Science. 2015;348(6230):124–128.
- [13] Rosenberg Jea. Atezolizumab in patients with locally advanced and metastatic urothelial carcinoma who have progressed following treatment with platinum-based chemotherapy: a single-arm, multicentre, phase 2 trial. The Lancet. 2016;387:1909–1920.
- [14] Le DT, Uram JN, Wang H, Bartlett BR, Kemberling H, Eyring AD, et al. PD-1 blockade in tumors with mismatch-repair deficiency. New England Journal of Medicine. 2015;372(26):2509–2520.
- [15] et al H. Genomic and Transcriptomic Features of Response to Anti-PD-1 Therapy in Metastatic Melanoma. Cell. 2016;165:35–44.
- [16] Eroglu Z, Zaretsky JM, Hu-Lieskovan S, Kim DW, Algazi A, Johnson DB, et al. High response rate to PD-1 blockade in desmoplastic melanomas. Nature. 2018;.
- [17] Wieczorek M, Abualrous ET, Sticht J, Álvaro-Benito M, Stolzenberg S, Noé F, et al. Major histocompatibility complex (MHC) class I and MHC class II proteins: conformational plasticity in antigen presentation. Frontiers in immunology. 2017;8:292.
- [18] Cover TM, Thomas JA. Elements of information theory. John Wiley & Sons; 2012.