NSense: A People-centric, non-intrusive Opportunistic Sensing Tool for Contextualizing Nearness
Abstract
In the context of social well-being and context awareness several eHealth applications have been focused on tracking activities, such as sleep or specific fitness habits, with the purpose of promoting physical well-being with increasing success. Sensing technology can, however, be applied to improve social well-being, in addition to physical well-being. This paper addresses NSense, a tool that has been developed to capture and to infer social interaction patterns aiming to assist in the promotion of social well-being. Experiments carried out under realistic settings validate the NSense performance in terms of its capability to infer social interaction context based on our proposed computational utility functions. Traces obtained during the experiments are available via the CRAWDAD international trace repository.
Index Terms:
opportunistic sensing, wireless, social interaction; proxemics; social well-being promotion.I Introduction
As technology becomes more pervasive, low-cost sensing devices such as smartphones are carried around by a large number of people, thus giving rise to the opportunity of capturing diverse aspects of the human routine and to take advantage of inferred patterns to improve several social and behavioral aspects, thus promoting better living/well-being. For instance, today there are several tools that bring awareness to our fitness routine, or even to our daily activity patterns, e.g., by looking into sleep, motion, as well as other activity and behavioral patterns. There are also several frameworks that attempt to gather healthcare data in the cloud so as to assist in a better prevention of diseases, or in a better control of conditions, such as asthma.
Derived from advances in communication and in particular, in networked systems, today the available technology can be relied upon to take advantage of sensing as well as of direct communication via short-range wireless technology (e.g. Bluetooth; Wi-Fi Direct) to assist in better classifying our daily routines, in a way that is not necessarily intrusive, and in a way that does not endanger one’s personal sphere. Such advantages are relevant in the context of promoting well-being in its multiple dimensions (social, cognitive/mental, and physical), and improving our daily routines (e.g. by stimulating social cohesion).
NSense (Nearness Sense) has been devised as a software-based solution to promote social well-being (and consequently, to assist in the development of frameworks and strategies that may provide benefits to mental and to cognitive well-being), by exploring individual and collective nearness contextualization. In the category of non-intrusive sensing, NSense is one of the first middleware solutions that exploits the notion of nearness via the use of short-range wireless technology (Wi-Fi Direct, Bluetooth) together with other sensors while integrating an efficient sampling and storage strategy (e.g., not recurring always to geo-positioning information; reducing microphone sampling), thus achieving a sound balance in terms of storage and battery drainage while performing behavior inference locally in the personal device, without relying to external computational devices (e.g., cloud). Moreover, aiming to ensure a large scale deployment, NSense is designed based on a modular software architecture, which allows an easy integration of other sensors.
This paper is structured as follows. Section II goes over related work explaining how NSense introduces benefits in the context of social well-being. Section III discusses our perspective on contextualizing nearness, proposing as valid markers for such context two utility functions: social interaction, that infers the interaction of devices over time; propinquity, that measures the probability of social interaction occurring over time, i.e., the probability of social ties to grow stronger over time and space. The NSense software architecture is briefly presented in Section IV which covers the computational and specification aspects of this tool. Section V is dedicated to an evaluation of NSense in terms of its capability to capture nearness under realistic conditions. Section VI concludes the paper with a summary of findings as well as ongoing research directions.
II Related Work
There are different proposals aiming at exploiting sensing data produced by smartphones to infer individual behavior. Such proposals can be divided into two major families, namely, participatory sensing [1], where the user actively engages in the data collection activity; opportunistic sensing [2], where the data collection stage is fully automated with no user involvement, i.e., in a non-intrusive fashion. While participatory and opportunistic sensing have complementary properties, we believe that a pure opportunistic sensing approach is more suitable to support large scale deployments and application diversity.
Most of the available sensing solutions are focused on the inference of individual behavior. CenceMe [3] has been designed to allow users to share their sensing experience with trusted circles on social networks. Such experience relates with activities such as running; walking; disposition; contextual surroundings. EmotionSense [4] aims at correlating how the user feels with user activities, and BeWell [5] aims at tracking the impact of sleep, physical activity, and social interaction on the user’s well-being, where social interaction is based on phone usage (SMS and calls). Both CenceMe and BeWell fall into the category of non-intrusive sensing. BeWell integrates speech activity detection to provide a better contextualization of the user’s social context. Nevertheless, the inference of conversational activities done by BeWell is not enough to reliably assess a user social context in terms of how socially engaged the owner of the device is with different individuals in a given setting (i.e., home, school, work).
Sociometer [6] focuses on the notion of social engagement given by proximity and conversational activities to understand how users interact. Sociometer is a mark in terms of better understanding cues concerning social context and the fact that activity recognition can be correlated with social engagement. Nevertheless, Sociometer falls into the category of intrusive tools, where social interaction is derived from infra-red proximity technology, which requires clear line-of-sight, while social engagement can still take place with obstacle between users and/or without users being facing one another.
Similarly to Sociometer, SociableSense [7] aims at inferring individual behavior in the context of office environments. SocialSense is based on a smartphone platform, thus being less intrusive. SociableSense adaptively controls the sampling rate of accelerometer, Bluetooth, and microphone sensors in order to estimate the user’s sociability, and strength of relationship with colleagues.
With NSense, we aim at inferring nearness based on the user’s daily routine and social interaction over time and space.
III Inferring Nearness
III-A Terminology and Notation
This section provides terminology that is required for a better understanding of the paper. NSense is middleware that has been designed to run on a personal sensing device such as a smartphone. As such, a user corresponds to the device owner and carrier. A device is owned by a person only, and the identification of the device is associated to its owner only.
Propinquity [8] is used in this work as an indicator of the probability of devices (and hence, their carriers) to strengthen over time their nearness. Propinquity refers to the physical and/or psychological proximity between people. It has been studied mostly to understand how interpersonal relations develop within the same space. For instance, people living in the same floor of a building attain a higher propinquity than those living on different floors. Two people sharing similar beliefs also attain a higher propinquity than those that do not share beliefs. Hence, propinquity is a property that is highly relevant to consider when defining, in networked systems, social interaction contextualization. Owners of devices that are in close range to each other, or that meet often, are expected to have a higher propinquity than owners of devices that do not meet often. Other aspects, such as environmental sound, or distance between devices, can assist in inferring propinquity.
Social interaction provides an indication on how much owners of devices have been interacting over time and space, derived from aspects such as the distance between such devices; the sound level activity around the devices; the type of movement of the devices.
Propinquity and social interaction assist in tracking nearness derived from the natural networking footprint that devices and their human carriers leave around. In other words, these two utility functions are relevant to develop solutions that capture nearness in a way that is non-intrusive and that does not jeopardize in any way the personal sphere of citizens.
The parameters considered by NSense in the definition of a nearness context concern node degree; node motion; social strength; relative distance; and ambient sound level. The node degree at an instant is commonly used to characterize several aspects of networked systems. A deterministic variable, , provides an indication is the node is moving based on the motion on a three accelerometer axis. The social strength of node towards node in a specific hourly sample , for day , [9] is derived from contact duration between nodes and during a specific time window in a passive way. The relative distance between devices and , , corresponds to an exponential moving average of the euclidean distance between the two nodes, following a propagation loss model. Finally, the environmental sound , measured by the device based on a sound activity detection algorithm, is used to classify the environmental sound context based on noise levels with the help of the deterministic variable .
III-B Relating Classified Activities with Nearness
This section explains how the different parameters are sensed by NSense and how we believe that such sensing can assist in inferring, with a reasonable level of accuracy, a nearness context, eventually leading to ways to stimulate nearness, if intended. A more detailed explanation of NSense, its pipelines, as well as aspects concerning classification of activities and our perspective concerning relation to nearness is available via a more detailed technical report [10].
Nearness considers both psychological (social) proximity as well as physical proximity aspects. It is here assumed that the level of social proximity derived from portable devices carries a correspondence to the level of social interaction that devices can capture via sensing interfaces. It is also assumed that the classification of aspects related to individual behavior, such as distance towards neighboring devices, motion, as well as environmental sound level assists in a more accurate classification of nearness aspects.
A nearness context is therefore modeled by relying on the two utility functions explained in the previous section. While the social interaction utility function provides a realistic measure on how social interaction is occurring, based on physical proximity metrics, the propinquity function operates as a reinforcement that social interaction grows with time - stronger times are formed when propinquity is higher, over time and space [8].
For the purpose of relying on non-intrusive opportunistic sensing, it is assumed that devices hold the proposed set of sensors, and that their owners allow data capture in accordance with the aspects that have been described in the previous sections. Table I illustrates a potential correlation between the different activities sensed, and how such sensing can impact on the modeled propinquity as well as on the modeled social interaction.
| Activity | Parameter | 1 | 2 | 3 |
|---|---|---|---|---|
| Social strength (Proximity) | High | High | Low | |
| Sound activity detection | Quiet | Alert | Quiet | |
| Relative Distance | Short | Large | Short | |
| Motion | Stationary | Stationary | Moving | |
| Social Interaction | Avg | Low | Low | |
| Propinquity | High | High | High | |
| Nearness | - | Avg | Avg | Avg |
For the sake of explanation, in the provided examples we assume that the social strength has either high or low values, while the level of sound is determined by either quiet or alert values. Likewise, the relative distance is considered to be either short or large. In terms of motion nodes are classified as being stationary or moving.
On a first case (cf. Table I, (1)) two nodes and meet frequently and hence their social strength is high. They are close by (short distance, e.g., 10 meters) as well as stationary. The sound activity level surrounding them is low (quiet). This seems to imply that there are conditions to strengthen nearness for the people carrying the devices. For instance, this could occur if two strangers share frequently the same bus ride. While if instead social interaction would be high, then it could be the case of two friends quietly reading at the same table on a coffee-shop. It should be highlighted that currently NSense is simply detecting environmental sound levels only.
In case 2 it is assumed that the distance changes, thus impacting both propinquity as well as social interaction. Nearness remains average, as propinquity has a high value.
In terms of the impact of motion in the inferrence of a nearness context (case 3), we assume that when distances between nodes are kept short, independently of whether moving or not, propinquity is high. For this specific example, social interaction is low as the social strength between the devices is also low. Nearness between the people can nevertheless still be classified as average.
These simplistic examples aim at explaining why a nearness context requires considering both social interaction as well as propinquity heuristics. For the next sections, to quantify propinquity we consider Eq. 1.
| (1) |
Propinquity has been modelled to be directly proportional to the social strength, and inversely proportional to the distance and motion of the node. Based on our analysis as well as on prior work [8], the current sound level activity is not relevant to model propinquity, as this function assists in understanding how social interaction can become stronger (stronger ties). We have then modeled social interaction as in Eq. 2, where is the standard deviation for a normal distribution based on , and is the mean for such distribution.
| (2) |
IV NSense Architecture
The high-level architecture of NSense is illustrated in Figure 1, where dashed squares represent modules that are not yet implemented (self-reporting and inference of anxiety levels) or that have been implemented but are not considered in this paper (roaming behavior classification [11]).
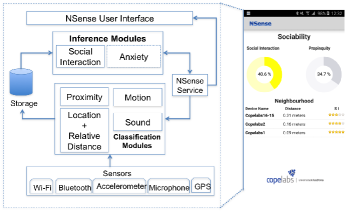
NSense is an open-source tool licensed under LGPLv3.0 [12] and has been designed to rely on data captured via multiple sensors (Wi-Fi, Bluetooth, accelerometer, microphone), data which is then worked via utility functions that classify activity in terms of social proximity; relative distance; location; motion; as well as surrounding sound level.
Activity classification is then used to infer about the behavior of the person carrying/owning a device. For the purpose of this paper the NSense implementation and experiments have been focused on social interaction contextualization only.
The NSense Service is the component responsible for initiating all of the software modules as well as all configured sensors, ensuring the modularity necessary for the easy plug-in of future sensors and classification modules. The NSense service is also responsible for controlling data access in the local SQLite database, as well as, if required, to dump data in a remote database.
The values required for the inference of behavior are computed by independent classification modules named pipelines, where a pipeline corresponds to a set of operations performed by a classification module done over a set of sensors. Classification modules that use more than one sensor, as is the case of the location module, and sensors that are used by several modules, as is the case of Wi-Fi.
Each pipeline captures raw data from a set of sensors and, without storing it, transforms such data via the application of specific utility functions into people-centric actions: ranking of preferred locations; level of surrounding noise; relative distance towards current neighboring devices, social strength towards any encountered devices; motion status of the device. Only the result of the pipeline computation is kept on the database, thus reducing storage and energy consumption required in opportunistic sensing.
The operation of NSense is based on four pipelines, each one encompassing sensing and classification activities. The location pipeline, based on the MTracker tool [11], performs non-intrusive classification of the location of the device. This classification is based on the visited wireless networks, combined with information collected from the network operator and GPS, as well as the relative distance between neighboring devices based on Wi-Fi direct.
The proximity pipeline relies on data captured via Bluetooth to estimate the social strength of a device towards all other encountered devices. This classification is based on the duration of each encounter. The social strength is the NSense variable that provides information about the user’s hourly routine through different days. Although the proximity pipeline considers only the Bluetooth interface, the next version of NSense will also consider data captured via Wi-Fi direct.
The motion and sound activity detection pipelines follow an Activity Recognition Chain (ARC) model, which comprises stages for data acquisition, signal pre-processing and segmentation, feature extraction and selection, training, and classification. The motion pipeline relies on data captured via the accelerometer to perform a classification of the type of movement activity in terms of being stationary or moving, capturing the percentage of time that a device is either stationary or moving. The sound activity detection pipeline captures the level of environmental sound derived from the sound amplitude, to classify in a deterministic way the environmental sound level.
V Performance Analysis
This section covers experimentation that we have done with NSense in order to evaluate a nearness context based on the proposed propinquity and social interaction functions, over time and space. The purpose of this performance analysis is to show that the functions are robust enough to characterize nearness under realistic settings. The experiments consider 4 Samsung S3 devices running Android 4.2, having NSense installed as background service. Over different days and time periods, the devices have been carried by users that share affiliation. The devices are identified as USense2, USense3, USense4, and USense5111The designation of the devices used in the experiment reflect the nomenclature that NSense had at the time of the experiments, i.e., USense.. The devices continuously sensed data which has been recorded every minute for different time periods. For instance, during the first experiment we have considered a 7-hour period, while on the second experiment we have considered a 50-hour period. On the last experiment we have considered a smaller subset of traces extracted over 3 hours. The experiments have been repeated several times over different days, for 3 weeks.222Traces are available via CRAWDAD, http://crawdad.org/copelabs/usense/, or http://copelabs.ulusofona.pt/scicommons/index.php/publications/show/844.
On a first set of experiments (Experiment I) we have analyzed the capability and robustness of the functions proposed to capture the correlation of the different sensed activities over time and space, for a short period of time (7 hours, from 8 a.m. to 3 p.m. GMT). Then, on a second set of experiments (Experiment II) we have increased such period to 50 hours to understand whether or not the functions would still be robust. In both sets of experiments the results are presented from the perspective of a specific node, even though data has been obtained from the perspective of all nodes. On a third set of experiments (Experiment III) we have analyzed properties of social proximity and propinquity derived from experiments between 2 nodes, for a period of 3 hours.
V-A Experiment I: Nearness Inference Context, Short Time Period
On a first scenario we have considered the perspective of USense2 device in regards to the three other devices over a period of 22 hours, of which we have extracted a period of 7 hours, from 8a.m. to 3p.m, having samples been obtained every minute. Results presented in Figure 2 concern the perspective of device USense2 towards USense5 333Due to space constrains, we have selected representative examples of all the experiments carried out. The full set of results is available via [10].. The carriers of these devices share affiliation. For each figure, the X-axis represents the hours, while the Y-axis provides the results attained in a logarithmic scale.
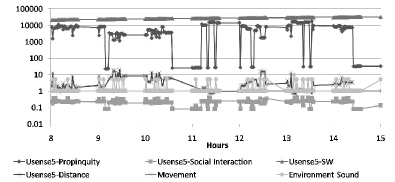
Propinquity and social interaction remain stable, while the social weight slightly increases over time. For the instants when distance increases, propinquity lowers, as the probability of having nodes around is lower. A downgrade in social interaction is also observable, even though such downgrade is less significant than in propinquity, when both sound levels go down, and distance increases, as this means that the device may be getting isolated. Sound impacts social interaction more than propinquity, as sound is relevant to understand whether or not the owners of close-by devices are truly interacting.
The social weight between the devices varies slightly over the period observed. The social weight measures the interaction over time and takes into consideration the fact that the devices may have frequently met in the past. While propinquity and social interaction consider the current instant.
V-B Experiment II: Nearness Inference Context, Long Time Period
Experiment II concerns a longer period of observation, based on another source node, USense5. Data has been captured over a 50 hour period, and while on the prior set of experiments the source node (USense2) was stationary most of the time, in this experiment USense5 has been carried around. Samples have been collected again every minute between 23.11.2015, 2 p.m. GMT, and 25.11.2015, 4 p.m. GMT; however, for achieving a better visualization, the results shown in the charts of Figure 3 are shown per hour. For computing distance over time, the readings that could not be obtained were discarded.The X-axis corresponds to hours, where hour 0 corresponds to 23.11.2015, 2 p.m., and hour 50 corresponds to 25.11.2015, 4 p.m. The results in the Y-axis are presented in logarithmic scale.
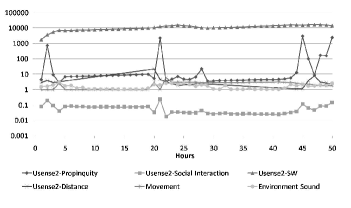
The variations in social interaction and propinquity as well as in social weight tell us that the two devices have been interacting on the first two observed hours (period between 23.11.2015, 2 p.m. and 4 p.m.). Between hours 5 and 20 the device has been stationary and distance readings towards Usense2 were not available. This means that the two devices were not interacting during that period as captured by the two proposed functions (propinquity and social interaction). Then, at hour 21 propinquity increases, due to the fact that the devices met again and are at a quite close range. Between hours 20 and 30 (24.11.2015, 10 a.m. and 24.11.2015, 8 p.m.) the devices interact. However, the environmental sound seems to be low. This implies that nearness is high (and hence, propinquity varies), and yet, social interaction may be low (devices are in close range and yet, environmental sound is low). During the night period the interaction varies little as expected, resuming around hour 45 (around 25.11.2015, 10 a.m.).
V-C Experiment III: Asymmetry in a Nearness Context
One aspect that we want to understand is whether or not the social interaction and propinquity patterns can be correlated based on individual neighbor’s perspective as well as based on a global perspective of nodes interacting. In other words: if the carriers of two devices are interacting, then both devices should exhibit similar nearness patterns, in terms of propinquity and social interaction.
Hence, considering again the raw traces extracted during Experiment II, Figure 4 covers results for a 3-hour observation period, between hours 2 and 5 (24.11.2015, 4 p.m. and 7 p.m.), a period which has been randomly selected from the specific periods where 2 devices, USense3 and USense5 interacted the most over the period of 50 hours of Experiment II. Figure 4a) holds results of USense5 towards all of its neighbors, while Figure 4b) holds results concerning USense3 towards all of its neighbors.
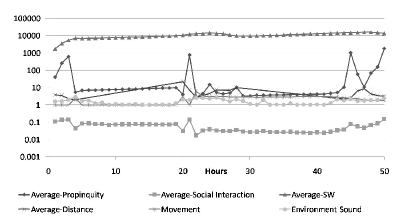
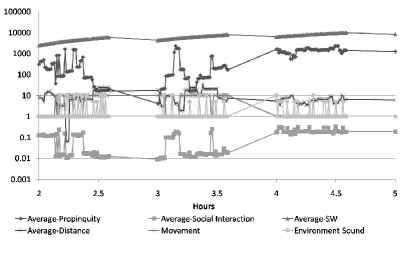
In all experiments performed under this scenario we have observed symmetry in terms of social interaction. Similarly, for this particular case, the captured social interaction pattern holds symmetry. However, in what concerns propinquity, such property is now weaker. For instance, between hours 2 and 2.5, propinquity exhibits more variability for USense3 than for USense5. The reason for this concerns the fact that propinquity is more significantly affected by distance fluctuations. This is an aspect that we expected to further analyze in future research, as our tool exhibited some limitations (delay) in computing the distance between neighboring nodes.
VI Conclusions and Future Work
This paper discusses a tool that can assist in a non-intrusive way a contextualization of nearness, based on two specific utility functions that model social interaction and propinquity. Social interaction modeling is relevant to understand whether or not nearness exists at an instant in time; propinquity is relevant to assist in a longer-term characterization of such nearness as well as in assisting to detect abnormal patterns of behavior (e.g. isolation).
The paper presents a tool, NSense, that has been used under realistic conditions to validate the proposed concepts of social interaction and propinquity. We have validated such tool under realistic settings, showing that the proposed functions are sound for short-time periods (e.g., 7 hours) as well as for longer time periods (50 hours) and relevant in a characterization of nearness. Results obtained corroborate that a nearness context can be based on the proposed functions, as they assist in understanding patterns of social interaction; resting periods; abnormal patterns (e.g., social isolation). The proposed functions are relevant in terms of local (end-user device) inference, and robust over time. We believe that the results that they provide can be improved by adequate individual training, an aspect that is being already addressed. A second conclusion to draw from the experiments carried out is that nodes interacting exhibit symmetric patterns of social interaction. While for the case of propinquity, the pattern symmetry involving nodes that interact regularly seem to be weaker - an aspect that we believe may be improved by creating a method that computes the direct distance via Wi-Fi quicker.
As ongoing work, we expect to explore this nearness context modeling to, together with stronger psychological assessment and validation, assist in promoting social interaction between familiar strangers. A second line of work that we are developing concerns the fundamental role that social interaction and propinquity may have as early indicators of social anxiety.
VII Acknowledgment
Thanks are due to the COPELABS CitySense project. The paper acknowledges support from the H2020 UMOBILE project, grant number 645124.
VIII References
References
- [1] N. D. Lane, S. B. Eisenman, M. Musolesi, E. Miluzzo, and A. T. Campbell, “Urban Sensing Systems: Opportunistic or Participatory?,” Feb. 2008.
- [2] N. D. Lane, E. Miluzzo, H. Lu, D. Peebles, Tanzeem Choudhury, and A. T. Campbell, “A Survey of Mobile Phone Sensing,” IEEE Communications Magazine, 2010.
- [3] E. Miluzzo, N. D. Lane, S. B. Eisenman, and A. T. Campbell, “CenceMe: Injecting Sensing Presence into Social Networking Applications,” in Proceedings of the 2Nd European Conference on Smart Sensing and Context, EuroSSC’07, (Berlin, Heidelberg), pp. 1–28, Springer-Verlag, 2007.
- [4] K. K. Rachuri, M. Musolesi, C. Mascolo, P. J. Rentfrow, C. Longworth, and A. Aucinas, “EmotionSense: A Mobile Phones Based Adaptive Platform for Experimental Social Psychology Research,” in Proceedings of the 12th ACM International Conference on Ubiquitous Computing, UbiComp ’10, (New York, NY, USA), pp. 281–290, ACM, 2010.
- [5] N. D. Lane, M. Lin, M. Mohammod, X. Yang, H. Lu, G. Cardone, S. Ali, A. Doryab, E. Berke, A. T. Campbell, and T. Choudhury, “BeWell: Sensing Sleep, Physical Activities and Social Interactions to Promote Wellbeing,” Mob. Netw. Appl., vol. 19, pp. 345–359, June 2014.
- [6] T. Choudhury and A. Pentland, “Sensing and Modeling Human Networks Using the Sociometer,” in Proceedings of the 7th IEEE International Symposium on Wearable Computers, ISWC ’03, (Washington, DC, USA), pp. 216—-, IEEE Computer Society, 2003.
- [7] K. K. Rachuri, C. Mascolo, M. Musolesi, and P. J. Rentfrow, “SociableSense: Exploring the Trade-offs of Adaptive Sampling and Computation Offloading for Social Sensing,” in Proceedings of the 17th Annual International Conference on Mobile Computing and Networking, MobiCom ’11, (New York, NY, USA), pp. 73–84, ACM, 2011.
- [8] R. Reagans, “Close Encounters: Analyzing How Social Similarity and Propinquity Contribute to Strong Network Connections,” Organization Science, vol. 22, pp. 835–849, Aug. 2011.
- [9] W. Moreira, M. de Souza, P. Mendes, and S. Sargento, “Study on the Effect of Network Dynamics on Opportunistic Routing,” in Proceedings of the 11th International Conference on Ad-Hoc Networks and Wireless (AdHoc Now 2012), July 2012.
- [10] R. C. Sofia, S. Firdose, L. A. Lopes, W. Moreira, and P. Mendes, “NSense: A People-centric, non-intrusive Opportunistic Sensing Tool for Contextualizing Social Interaction - Technical Report, COPE-SITI-TR-16-02,” tech. rep., COPELABS, ULHT, 2016.
- [11] R. Sofia, “A Tool to Estimate Roaming Behavior in Wireless Architectures,” in inProc. WWIC 2015, 2015.
- [12] F. Saeik, L. Lopes, P. Reddy, W. Moreira, R. Sofia, and P. Mendes, “USENSE - Android App on Google Play,” 2015.