email:mariaangela.raj@oacn.inaf.it 22institutetext: University of Naples “Federico II”, C.U, Monte Santangelo, Via Cinthia, 80126, Naples, Italy 33institutetext: School of Physics and Astronomy, Sun Yat-sen University Zhuhai Campus, 2 Daxue Road, Tangjia, Zhuhai, Guangdong 519082, P.R. China 44institutetext: Division of Astronomy, Department of Physics, University of Oulu, Oulu, Finland 55institutetext: Kapteyn Astronomical Institute, University of Groningen, PO Box 800, 9700 AV Groningen, The Netherlands 66institutetext: School of Physics and Astronomy, Cardiff University, Queen’s Building, The Parade, Cardiff, CF24 3AA, Wales, UK 77institutetext: European Southern Observatory, Karl-Schwarzschild-Strasse 2, D-85748 Garching bei Munchen, Germany 88institutetext: European Southern Observatory, Alonso de Cordova 3107, Vitacura, Santiago, Chile 99institutetext: Instituto de Astrofìsica de Canarias, C Via Lactea s/n, 38200 La Laguna, Canary Islands, Spain 1010institutetext: Departamento de Astrofìsica, Universidad de La Laguna, E-38200 La Laguna, Tenerife, Spain 1111institutetext: INAF-Astronomical Abruzzo Observatory, Via Maggini, 64100, Teramo, Italy 1212institutetext: Department of Astrophysics, University of Vienna, Türkenschanzstrasse, 17, 1180 Vienna, Austria
The Fornax Deep Survey with VST
Abstract
Context. We present the study of a magnitude limited sample (16.6 mag) of 13 late type galaxies (LTGs), observed inside the virial radius, 0.7 Mpc, of the Fornax cluster within the Fornax Deep Survey (FDS).
Aims. The main objective is to use surface brightness profiles and colour maps to obtain information on the internal structure of these galaxies and find signatures of the mechanisms that drive their evolution in high-density environment, which is inside the virial radius of the cluster.
Methods. By modelling galaxy isophotes, we extract the azimuthally averaged surface brightness profiles in four optical bands. We also derive colour profiles, and relevant structural parameters like total magnitude, and effective radius. For 10 of the galaxies in this sample, we observe a clear discontinuity in their typical exponential surface brightness profiles, derive their “break radius”, and classify their disc-breaks into Type II (down-bending) or Type III (up-bending).
Results. We find that Type-II galaxies have bluer average () colour in their outer discs while Type-III galaxies are redder. The break radius increases with stellar mass and molecular gas mass while decreases with molecular gas-fractions. The inner and outer scale-lengths increase monotonically with absolute magnitude, as found in other works. For galaxies with CO(1-0) measurements, there is no detected cold gas beyond the break radius (within the uncertainties). In the context of morphological segregation of LTGs in clusters, we also find that, in Fornax, galaxies with morphological type 5 T9 (60 % of the sample) are located beyond the high-density, ETG-dominated regions, however there is no correlation between and the disc-break type. We do not find any correlation between the average () colours and cluster-centric distance, but the colour-magnitude relation holds true.
Conclusions. The main results of this work suggest that the disc breaks of LTGs inside the virial radius of the Fornax cluster seem to have arisen through a variety of mechanisms (e.g. ram-pressure stripping, tidal disruption), which is evident in their outer-disc colours and the absence of molecular gas beyond their break radius in some cases. This can result in a variety of stellar populations inside and outside the break radii.
Key Words.:
Galaxies: clusters: individual: Fornax – Galaxies: irregular – Galaxies: spiral – Galaxies: structure – Galaxies: evolution – Galaxies: photometry1 Introduction
Spiral galaxies and irregular galaxies, which fall under the late type galaxies (hereafter, LTGs) morphology classification, have been primarily studied in the past, mostly concerning the formation of grand design structures e.g. spiral arms (Lin & Shu, 1964). These galaxies are rich in atomic and molecular gas and because of that, they are actively forming stars. Their stellar and (cold and diffuse) gaseous discs are known to be sensitive to the effect of the environment and their evolution (star formation history) is slower (Boselli & Gavazzi, 2006) than that of early type galaxies (lenticular and elliptical galaxies; hereafter ETGs). This makes them interesting probes of a cluster environment (e.g. Blanton & Moustakas, 2009; Hwang et al., 2010).
Studying the effect of the environment (e.g. field vs cluster), where LTGs are located, is vital for unravelling the formation of their unique substructures (e.g. Boselli & Gavazzi, 2006). Moreover, LTGs are ideal systems to study stellar population gradients (bulge and disc, inner and outer regions) which may have come about as a consequence of external processes (e.g. Bell & de Jong, 2000; Gadotti & Dos Anjos, 2001). The relative abundance of galaxies with respect to their morphological types has been shown to be related to the density of their local environment with a fraction of 80 % of LTGs in the field, 60 % in clusters, and 0% in the core of rich clusters (Dressler, 1980; Whitmore, 1993). Their infall into a cluster environment makes their interstellar medium prone to hydrodynamic interactions with the hot intracluster gas (e.g. Binney & Tremaine, 1987), and their peculiar morphologies have been the topic of interest, especially concerning their structure formation and star formation regulation through a series of intracluster processes like ram pressure stripping (Gunn & Gott, 1972), star formation quenching (e.g. Abadi et al., 1999), or galaxy-galaxy harassment (e.g. Moore et al., 1996).
Studies have shown that the first stage of evolution of LTGs, as they enter a dense environment, is characterised by the formation of a strong bar, and an open spiral pattern in the disc (Moore et al., 1998; Mastropietro et al., 2005). Further on, their spiral arms and rings can be wiped out by tidal interactions, as shown by galaxy formation and evolution simulations (Mastropietro et al., 2005). Recently, though, numerical simulations (Hwang et al., 2018) have shown that interactions with other galaxies, especially ETGs, in high-density cluster regions can also cause an LTG to lose its cold gas but still have more star formation activity during the collision phase (cold gas interacting with the hot gas of the cluster). Thus, the location of a galaxy in the cluster is a primary parameter to correlate with formation of structure in galaxies. One of the several methods used is to investigate this evolution through the detailed study of the surface brightness profiles and their morphology classification based on their substructures (e.g., lopsided or warped disc, bars, peanut shaped bulges, spiral arms).
Particular insight can be gained from quantitative studies of the light distribution of stellar discs down to the faintest regions, exploring the formation of their substructures and evolutionary paths (e.g. Courteau, 1996; Trujillo et al., 2002). Light distributions of disc galaxies are characterised by an exponential decline (de Vaucouleurs, 1959). However, this so-called decline in edge-on spiral galaxies does not continue to its last measured point, but rather truncates after a certain radial scale-length (van der Kruit, 1979). The origin of these truncations can be explained though several models suggesting that accretion of external material in the discs of galaxies can produce extended discs which can be interpreted as truncations (e.g. Larson, 1976). de Jong (1996) predicted that there is substantial age gradients across these discs, which are not observed yet.
Alternatively, a truncation orginates by quenching of star formation activity due to the fall of gas density below a threshold for local instability e.g. interaction with other galaxies, tidal effect of the environment, stochastic fluctuations due to internal dynamics (Fall & Efstathiou, 1980; Schaye, 2004). This star-formation threshold is also associated with disc breaks in light profiles of galaxies (e.g. Martin & Kennicutt, 2001).
Truncations should not be confused with disc breaks. Originally, the former was found to occur in edge-on galaxies at 4.20.5 scale-lengths (van der Kruit & Searle, 1981a, b), while the latter occurs around 2.50.6 scale-lengths (Pohlen & Trujillo, 2006). Kregel & van der Kruit (2004) found that the surface brightness at the estimated truncation radius was 25.30.6 mag arcsec2 (-band). On the other hand, disc breaks were found in the surface brightness range 23-25 mag /arcsec2 (Pohlen & Trujillo, 2006). In some cases, disc breaks and truncations can co-exist, but the mechanisms causing them are different (Martín-Navarro et al., 2012). Depending on the shape of the surface- brightness profiles, disc breaks are classified into (i) Type I-no break (ii) Type II-downbending break (iii) Type III-upbending break (see Erwin et al., 2005; Pohlen & Trujillo, 2006; Erwin et al., 2008).
Different mechanisms have been proposed to explain the origin of disc breaks. Type II disc breaks occur as a consequence of star-formation threshold (Fall & Efstathiou, 1980; Schaye, 2004), while Type III disc breaks have been associated to minor/major mergers (e.g. Younger et al., 2007; Borlaff et al., 2014). Furthermore, disc breaks are located at closer radial distances to the centre in face-on galaxies than in edge-on systems. Internal mechanisms owing to the formation of bars and rings in spiral galaxies can also cause disc breaks (Muñoz-Mateos et al., 2013). As such, there has been research on disc breaks in galaxies of different morphologies (e.g. Pohlen & Trujillo, 2006) as well as a function of the environment i.e. field vs cluster (Pranger et al., 2017).
Clusters are suitable for the study of discs in LTGs as they allow to map the dynamical processes of the galaxies in a dense environment. After Virgo, the Fornax cluster is the nearest and second most massive galaxy concentration within 20 Mpc, with a virial mass of M = (Drinkwater et al., 2001). Fornax is dynamically more evolved than Virgo, as most of its bright ( mag) cluster members (Ferguson, 1989) are ETGs which are mainly located in its core (Grillmair et al., 1994; Jordán et al., 2007). However, the mass assembly of the Fornax cluster is still ongoing (Scharf et al., 2005) and the intra-cluster light (ICL) in its core indicates interactions between cluster members (Iodice et al., 2017a; Pota et al., 2018; Spiniello et al., 2018). Iodice et al. (2017a) found that this ICL is the counterpart in the diffuse light of the overdensity in the blue intra-cluster globular clusters (D’Abrusco et al., 2016; Cantiello et al., 2018) and a fraction of the ICL population are low-mass dwarf galaxies (Venhola et al., 2017). The observed number density drop of low surface-brightness (LSB) galaxies below a cluster-centric distance r = 0.6 deg (180 kpc) by Venhola et al. (2017) is a proof of the effect of the dense environment on the evolution of galaxies. In the same regions, the high-velocity planetary nebulae (PNe, Spiniello et al. 2018) and globular clusters (GCs, Pota et al. 2018) show that this ICL component is unbound to galaxies, possibly after gravitational interactions, and is dynamically old. All of these findings indicate that Fornax is an evolved, yet active environment and a rich reservoir for the study of the evolution and the structure of the galaxies in a cluster environment, specifically, inside the virial radius of the Fornax cluster. The aim of this work is to study the structure of the LTGs inside the cluster and address the diverse evolutionary paths these systems can take after falling into a cluster. In particular, by taking advantage of the deep Fornax Deep Survey (FDS) data, we can map the light distribution down to unprecedented limits in the Fornax cluster. This allows us to detect any asymmetries in the outskirts of the discs as well as tidal tails or streams that would indicate possible interactions. By analysing their surface brightness distribution, we aim at identifying disc-breaks and finding any correlations with the location of galaxies inside the cluster.
In this study, we present the analysis of LTGs i.e. spiral galaxies selected from Ferguson (1989), which are brighter than 16.6 mag inside the virial radius of the Fornax cluster. We give a short summary of the FDS in Sect. 2. We describe the procedure and method to derive the radial profiles, colours, and structural parameters like effective radius and total magnitude in Sect. 3. We give a detailed description of the algorithm we have developed to derive break radii in Sect. 4. A surface photometry analysis of each galaxy presented in this work is described in Appendix A, with their corresponding images in surface brightness, colour maps and profiles, with surface brightness profiles shown in Appendix B. We summarise our results in Sect. 5 and 6, and discuss the formation of structures caused by secular evolution and the effect the environment in Sect. 7. Conclusions and future perspectives are given in Sect. 8. The methodologies of some of this work are presented in Appendix C.
| Field | band | band | band | band | ||||
| depth | depth | depth | depth | |||||
| [arcsec] | [] | [arcsec] | [] | [arcsec] | [] | [arcsec] | [] | |
| (1) | (2) | (3) | (4) | (5) | ||||
| F2 | 1.21 | 26.89 | 1.11 | 28.35 | 0.90 | 27.78 | 0.79 | 26.75 |
| F4 | 1.18 | 26.95 | 1.39 | 28.45 | 1.19 | 27.76 | 0.70 | 27.01 |
| F5 | 1.33 | 27.33 | 1.15 | 28.54 | 1.39 | 27.85 | 1.08 | 26.97 |
| F6 | 1.11 | 27.43 | 0.84 | 28.47 | 1.08 | 27.73 | 1.21 | 26.82 |
| F7 | 1.04 | 27.3 | 0.83 | 28.56 | 0.95 | 27.81 | 1.42 | 26.62 |
| F12 | 1.15 | 27.44 | 0.83 | 28.49 | 1.04 | 27.84 | 1.17 | 26.79 |
| F15 | 1.30 | 27.12 | 1.13 | 28.35 | 0.90 | 27.89 | 0.97 | 26.87 |
| F16 | 1.31 | 27.27 | 1.26 | 28.43 | 0.94 | 27.84 | 1.08 | 26.96 |
| F17 | 1.27 | 27.1 | 1.11 | 28.29 | 0.87 | 27.96 | 1.01 | 26.92 |
2 The Fornax Deep Survey: Data
The Fornax Deep Survey, observed with the ESO VLT Survey Telescope (Schipani et al., 2012) is a deep, multi-band imaging () survey of the Fornax cluster, covering 26 square degrees around the core of the cluster (Iodice et al., 2017b). This work focuses on the central 9 square degrees () which cover most of the cluster area inside the virial radius, Mpc (Drinkwater et al., 2001). FDS observations are part of the Guaranteed Time Observation surveys, FOCUS (P.I. R. Peletier) and VEGAS (P.I. E.Iodice, Capaccioli et al. 2015) acquired with the ESO VLT Survey Telescope (VST) operating from Cerro Paranal. VST is a 2.6 m wide-field optical survey telescope with a wide-field camera, OmegaCam (Kuijken, 2011), that covers a 1x1 degree2 field of view, and has a mean pixel scale of 0.21 arcsec /pixel. A thorough description of the observing procedure, data reduction pipelines, calibration, and quality-assessment of the final data products were presented by Venhola et al. (2017, 2018) and Iodice et al. (2016, 2017a). The data presented in this work were obtained during several visitor mode runs in dark time for bands and in grey time for - band (see Iodice et al. 2019b for details on the observed FDS fields). Data were reduced with two pipelines: (i) VST-Tube (Grado et al., 2012; Capaccioli et al., 2015); (ii) Astro-WISE (Valentijn et al., 2007). The VST-Tube was used to reduce data for the central 9 square degrees, while Astro-WISE was used for the data reduction of 26 square degrees. We use both data products in this work.
The FDS fields were acquired using a step-dither observing strategy, which consists of a cycle of short exposures of 150s each, centred on the core and its adjacent fields ( 1 deg) in the Fornax cluster. Fields with few or no bright objects were used to derive an average sky frame for each night and in all bands, which is scaled and subtracted from each science frame. This method has proven to provide an accurate estimation of the sky background around bright and extended galaxies (see Iodice et al., 2016, 2017a, 2019b; Venhola et al., 2017, 2018). For each field, we obtained 76 exposures of 150s each in u band, 54 in g and r bands, and 35 in i band, thus resulting in a total exposure time of 3.17 hr in u band, 2.25 hr in g and r bands, and 1.46 hr in i band. Images with seeing FWHM 1.5 arcsec were used in the final production of co-added frames (see Iodice et al. 2019b for exposure times of each filter). The FWHM (arcsec) and depth () of FDS fields in each filter () are given in Tab. 1 (see Venhola et al., 2018).
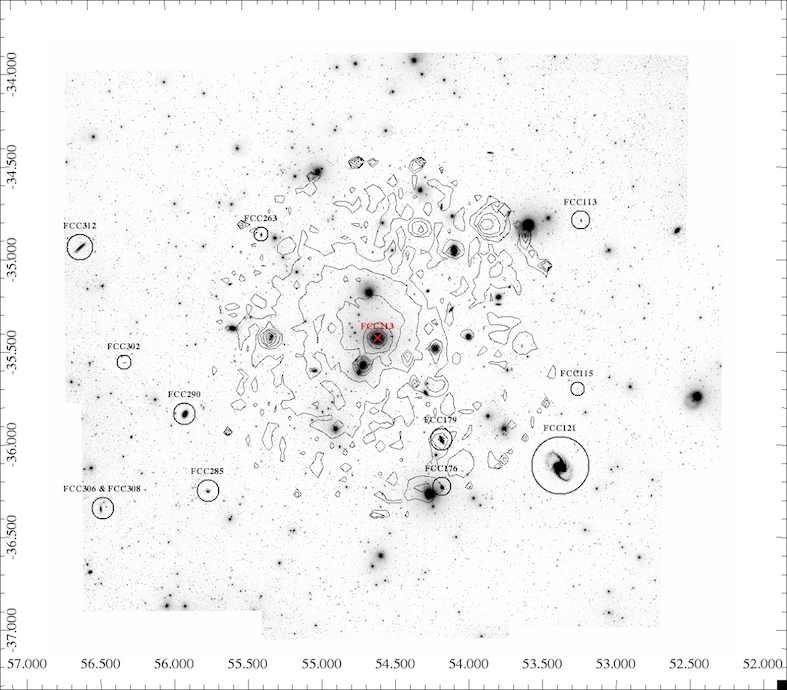
The -band mosaic covering 9 square degrees around the core of the Fornax cluster, with marked circles indicating the galaxies studied and presented in this paper, is shown in Fig 1.
This is a complete sample in 16.6 mag consisting of 13 LTGs inside the virial radius of the Fornax cluster (see Tab. 1). The sample of spiral galaxies has been selected from Ferguson (1989), with morphological type T 1. To be consistent with the catalog we refer to (from Ferguson, 1989) and keeping in mind that the morphological classification changes over time, we use a generic term, i.e., address the galaxies in our sample as LTGs. This work is complementary to that of Iodice et al. (2019b) on ETGs.
A detailed description of each galaxy in the sample is given in Appendix A.
| object | Morph type | radial velocity | FDS Field | Names | |||
|---|---|---|---|---|---|---|---|
| h:m:s | d:m:s | km/s | mag | ||||
| (1) | (2) | (3) | (4) | (5) | (6) | (7) | (8) |
| FCC113 | 03 33 06.8 | -34 48 29 | ScdIII pec | 1388 | 14.8 | F15-16 | ESO358-G15 |
| FCC115 | 03 33 09.2 | -35 43 07 | Sdm(on edge) | 1700 | 16.6 | F16 | ESO358-G16 |
| FCC121 | 03 33 36.4 | -36 08 25 | SB(s)b | 1635 | 10.32 | F16-F17 | NGC1365, ESO358-G17 |
| FCC176 | 03 36 45.0 | -36 15 22 | SBa (SAB(s)a) | 1414 | 13.74 | F12-F17 | NGC1369, ESO358-G34 |
| FCC179 | 03 36 46.3 | -35 59 58 | Sa | 868 | 12.09 | F11-F12 | NGC1386, ESO358-G35 |
| FCC263 | 03 41 32.6 | -34 53 17 | SBcdIII | 1724 | 14.04 | F6 | ESO358-G51 |
| FCC267 | 03 41 45.4 | -33 47 31 | SmIV | 834 | 16.1 | F4-F5 | |
| FCC285 | 03 43 02.2 | -36 16 24 | SdIII | 886 | 14.1 | F7 | NGC1437A, ESO358-G54 |
| FCC290 | 03 43 37.1 | -35 51 13 | ScII | 1387 | 12.41 | F6-F7 | NGC1437, ESO358-G58 |
| FCC302 | 03 45 12.1 | -35 34 15 | Sdm (on edge) | 803 | 15.5 | F2-F6 | ESO358-G060 |
| FCC306 | 03 45 45.3 | -36 20 48 | SBmIII | 886 | 15.6 | F7 | |
| FCC308 | 03 45 54.7 | -36 21 25 | Sd | 1487 | 13.97 | F7 | NGC1437B, ESO358-G61 |
| FCC312 | 03 46 18.9 | -34 56 37 | Scd | 1929 | 12.83 | F2-F6 | ESO358-G63 |
3 Analysis: Surface Photometry
In this section, we give a brief description of the method we adopt, following Iodice et al. (2017a, 2019b), to derive galaxy parameters: total magnitude, effective radius and stellar mass to light ratio (M/L) ratio.
3.1 Method: Isophote Fitting
We extracted azimuthally averaged intensity profiles for each object from the sky-subtracted images in four respective bands, using the ellipse (Jedrzejewski, 1987) task in IRAF 444IRAF is distributed by the National Optical Astronomy Observatories, which are operated by the Association of Universities for Research in Astronomy, Inc., under cooperative agreement with the National Science Foundation (for a thorough explanation of this method, see Iodice et al., 2019b).
The main steps are as follows:
-
1.
Create masks for bright objects (galaxy and stars) around our galaxy of interest
-
2.
Fit isophotes in elliptical annuli, starting from the centre of the galaxy, up to its outer edge in the FDS field (out to 0.5 deg). We keep the geometric centre of symmetry fixed while the ellipticity and position angle are free parameters. For lopsided galaxies (FCC113 and FCC285) and barred galaxies (FCC263 and FCC121), we use the galactic centre of one band as the same centre for other bands so that the same regions are mapped in the study and characterisation of their structures.
-
3.
From the intensity profiles, we (i) estimate the limiting radius corresponding to the outer most annulus (see Tab. 3) 555Note that is different from the depth of the image., where the galaxy’s light blends into the average background level 666The average background level is the residual after subtracting the sky frame, this results in a value close to zero (see Iodice et al., 2016). and (ii) derive the residual sky background from the outer annuli of all galaxies in each band.
| object | ||
| arcsec | mag/arcsec2 | |
| (1) | (2) | (3) |
| FCC113 | 42.23 | 25.7 0.19 |
| FCC115 | 36.04 | 25.5 0.11 |
| FCC121 | 436.7 | 26.6 0.32 |
| FCC176 | 86.4 | 26.5 0.4 |
| FCC179 | 139.2 | 25.83 0.3 |
| FCC263 | 71.41 | 25.7 0.15 |
| FCC267 | 42.23 | 26.82 0.4 |
| FCC285 | 86.4 | 26.0 0.07 |
| FCC290 | 139.2 | 26.44 0.03 |
| FCC302 | 51.1 | 26.94 0.21 |
| FCC306 | 22.75 | 25.8 0.1 |
| FCC308 | 115.0 | 26.3 0.13 |
| FCC312 | 153.1 | 25.13 0.14 |
3.2 Products: total magnitude, effective radius, colour, and stellar mass to light ratio
We adopt the procedure of Iodice et al. (2019b) to derive parameters: total magnitude, effective radius, colour, stellar mass to light ratio, for all galaxies in our sample.
-
1.
The resulting output of the isophote fit is used to provide their respective intensity profiles, from which we derive the azimuthally averaged surface brightness (SB) profiles. This is followed by a correction for the residual background level estimated at , in each band for all the galaxies in our sample. The error estimates on magnitudes take into account the uncertainties on the photometric calibration and sky subtraction (see Capaccioli et al., 2015; Iodice et al., 2016, 2019b).
-
2.
From the azimuthally averaged SB profiles, we derive colour profiles for each galaxy (Appendix B). We also show the colour maps for each of these galaxies (Appendix B), obtained from the images.
-
3.
From the isophote fits, we use a growth curve analysis to derive total magnitude and effective radius in each band for all galaxies (see Tab. 4).
-
4.
We derive average () and () colours for each of these galaxies from the radial profiles (see Tab. 4).
-
5.
From the average () colour, we estimate the stellar mass by using the empirical relation = 1.15 + 0.70()- 0.4 from Taylor et al. (2011), where is the absolute magnitude in - band 888The empirical relation proposed by Taylor et al. (2011) assumed a Chabrier IMF.. According to Taylor et al. (2011), this relation provides an estimate of the stellar mass-to-light ratio with 1 accuracy of 0.1 dex. The value for each galaxy of the sample is given in Tab. 5.
A full illustration of the surface brightness profiles, colour profiles and maps for individual galaxies are shown in Appendix B.
| object | ||||||||
|---|---|---|---|---|---|---|---|---|
| mag | mag | mag | mag | arcsec | arcsec | arcsec | arcsec | |
| (1) | (2) | (3) | (4) | (5) | (6) | (7) | (8) | (9) |
| FCC113 | ||||||||
| FCC115 | ||||||||
| FCC121 | ||||||||
| FCC176 | ||||||||
| FCC179 | ||||||||
| FCC263 | ||||||||
| FCC267 | ||||||||
| FCC285 | ||||||||
| FCC290 | ||||||||
| FCC302 | ||||||||
| FCC306 | ||||||||
| FCC308 | ||||||||
| FCC312 |
| object | |||||||
|---|---|---|---|---|---|---|---|
| deg | mag | kpc | mag | mag | |||
| (1) | (2) | (3) | (4) | (5) | (6) | (7) | (8) |
| FCC113 | 1.21 | -16.74 | 1.98 | 0.02 | 0.56 | ||
| FCC115 | 1.05 | -15.78 | 1.59 | 0.01 | 0.35 | ||
| FCC121 | 1.06 | -22.58 | 12.74 | 6.49 | 0.77 | ||
| FCC176 | 0.82 | -19.85 | 4.55 | 0.68 | 0.99 | ||
| FCC179 | 0.55 | -20.7 | 2.68 | 1.58 | 1.06 | ||
| FCC263 | 0.79 | -18.08 | 2.06 | 0.04 | 0.3 | ||
| FCC267 | 1.73 | -15.24 | 1.92 | 0.01 | 0.74 | ||
| FCC285 | 1.17 | -17.43 | 4.90 | 0.02 | 0.33 | ||
| FCC290 | 1.05 | -20.49 | 4.64 | 0.64 | 0.52 | ||
| FCC302 | 1.30 | -15.92 | 2.76 | 0.01 | 0.41 | ||
| FCC306 | 1.69 | -15.21 | 0.94 | 0.003 | 0.29 | ||
| FCC308 | 1.69 | -17.49 | 4.46 | 0.04 | 0.55 | ||
| FCC312 | 1.59 | -20.89 | 11.30 | 1.48 | 0.83 |
4 Analysis: the break radius
One of the main novelties of this work is the algorithm we have developed to derive break radii of galaxies. It is based on concepts used in literature to derive break radii (e.g. Pohlen & Trujillo, 2006), but it is fully automatised and reproducible, as it is based on coded rules to define the break radius and bootstraps the results over a variety of initial conditions for the best-fitting procedure.
In this section, we illustrate the main steps to derive the break radius from surface brightness profiles, and provide a detailed description of the algorithm we use.
4.1 Surface brightness profile deconvolution
We derive the break radius from surface brightness profiles in the -band as this is one of the highest transmission OmegaCam filters and least-affected by dust absorption, which could be quite high in LTGs.
Since the break radius is derived on the disc regions of LTGs, it is important to account for the effect of the contamination from their bright cores, which scatters their light in the regions around them because of the effect of the point spread function (PSF). The mathematical effect introduced by the PSF over the measured 2D light distribution is equivalent to a convolution of a matrix of the intrinsic intensity values (the surface brightness) and a 2D kernel (the matrix corresponding to the PSF). In order to correct this, we need to invert this operation i.e., perform a deconvolution, assuming the kernel is given.
The first step of deconvolution (assuming the kernel is given) is to accurately measure the PSF out to a radial distance comparable to that of the galaxies’ discs. Capaccioli et al. (2015) found that the scattered light can considerably affect the local light profiles in VST images of galaxies of various sizes in different ways. To fully account for the broadening effect of the seeing on their sample of galaxy images, they characterized the PSF from the VST images.
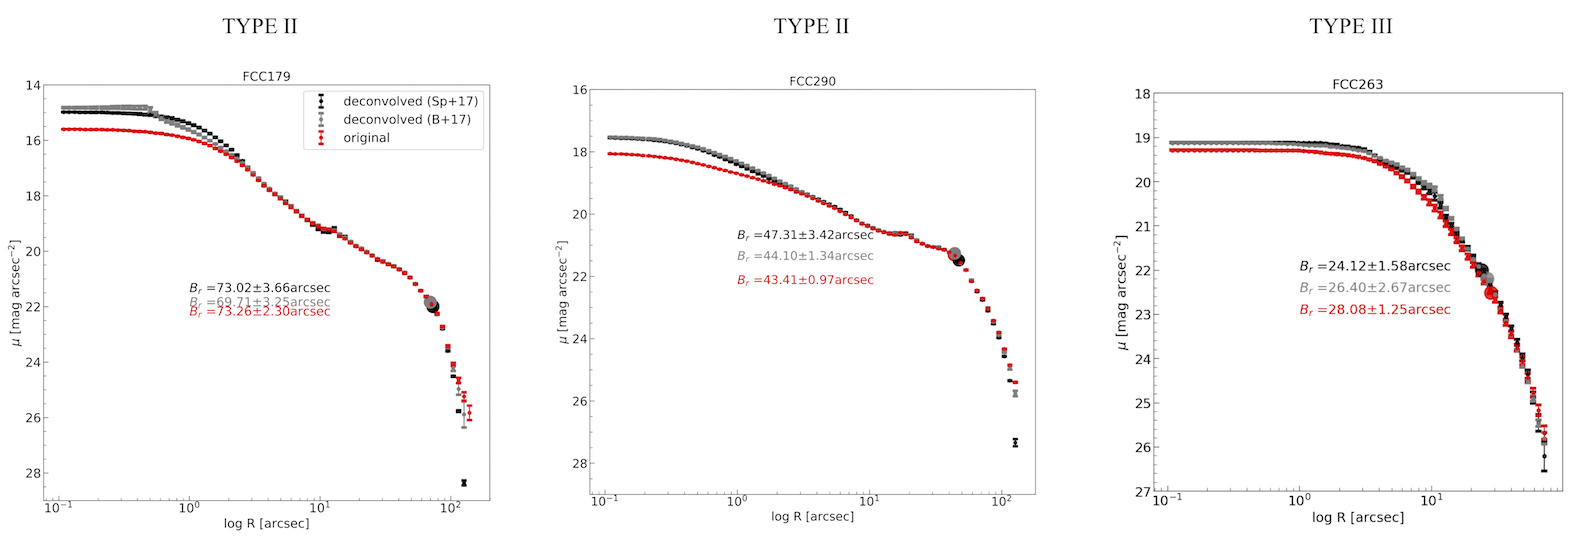
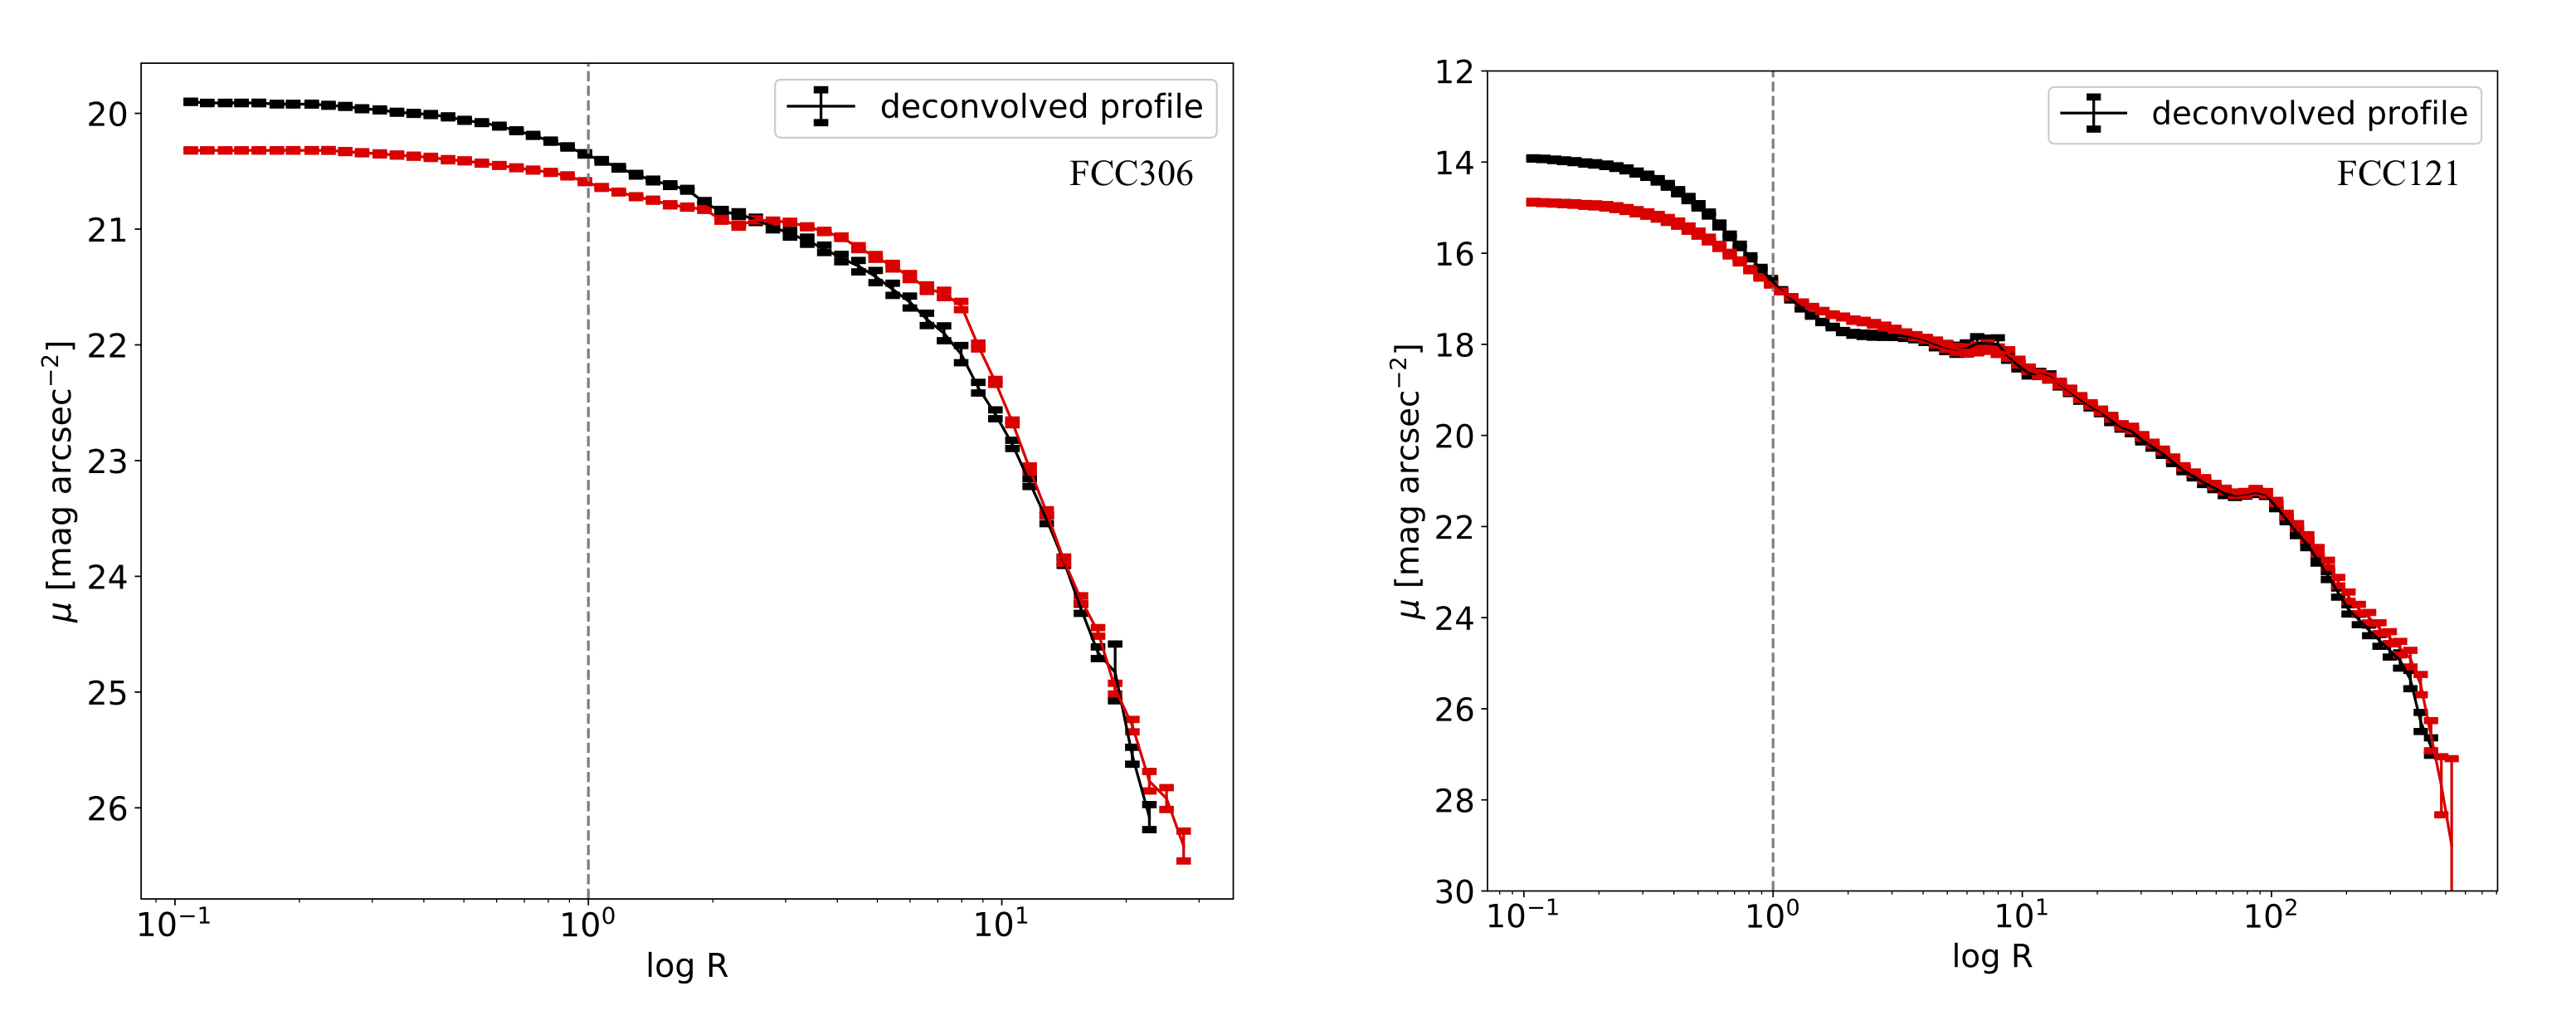
The sample presented in this work consists of galaxies of different angular extent (see Fig. 2. FCC306 is the smallest galaxy in our sample (Re =0.94 Kpc in -band) and FCC121 is the largest galaxy, (Re =12.74 Kpc in -band). From Fig. 2, it is clear that the effect of the PSF (1 arcsec) scatters the light from the central regions to the outer regions. The effect mitigates outside the typical size of the PSF, where, for the conservation of the flux, the light scattered from the core makes the observed profile brighter than the intrinsic (deconvolved) profile. Finally, the effect of the PSF is completely canceled far away from the center, typically outside 10 arcsec. Thus, in order to minimise the effect of the PSF on our structural analysis, we deconvolve galaxies with the PSF, by using the Lucy-Richardson algorithm (Lucy, 1974; Richardson, 1972), as done by Spavone et al. (2017, hereafter SP+17). A full description of the deconvolution method used for VST data is presented by Spavone et al. (in prep). The robustness of the deconvolution algorithm is demonstrated in Appendix C.1, where we compare the performance against the method from Borlaff et al. (2017).
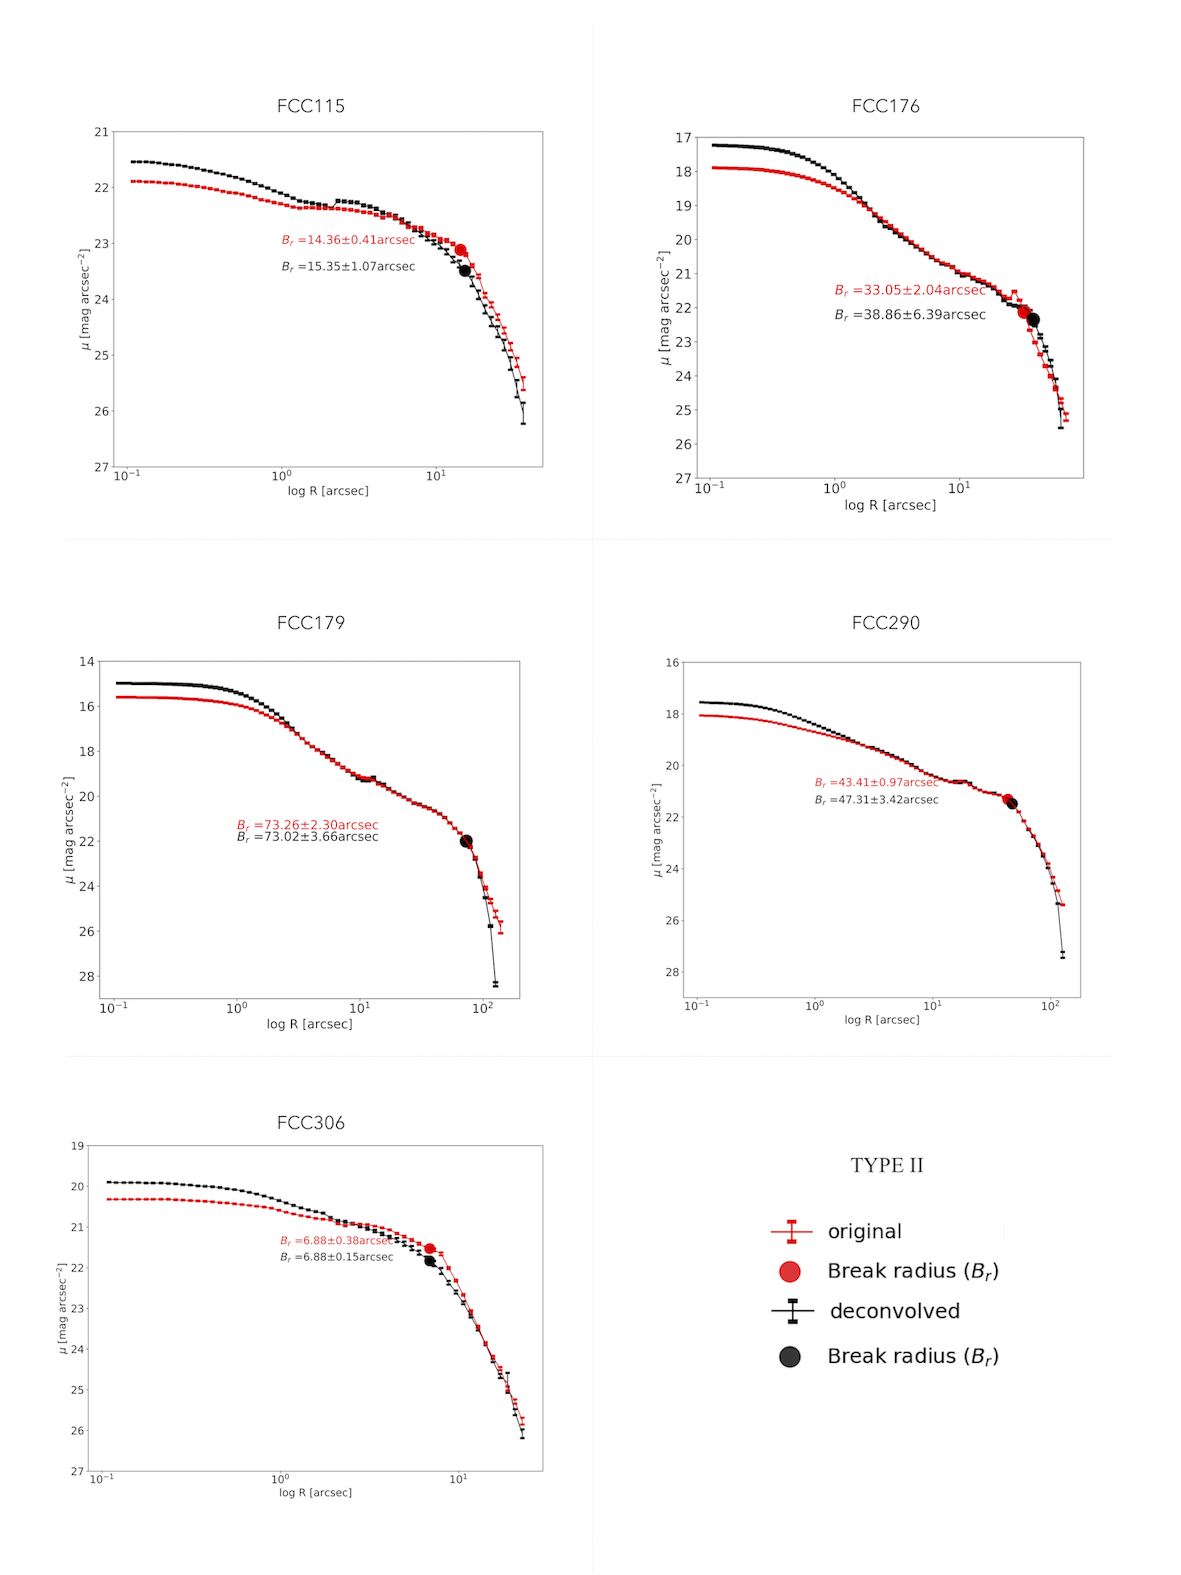
The surface brightness profiles and break radii are derived from the deconvolved images in - band. We also derive the deconvolved profiles in and bands. The deconvolved profiles (-band) are given in Fig.3 and Fig.4, and deconvolved () colour profiles are shown in Appendix. B.
4.2 Algorithm: Break radius
Since discs of LTGs show exponential SB profiles, which become linear in the log-linear plane, the break radius can be defined as the radius where the logarithmic SB, defined as =-2.5 log , where is the SB as a function of the radius , shows a discontinuity in the slope. The presence of this discontinuity is first guessed by fitting the disc with a single linear model using the following equation,
| (1) |
where is the slope of the linear fit and is the intercept. The best fit is performed via least square linear fitting of 1D surface brightness profile in band (deconvolved). The least square approximation of the linear system is based on the Euclidean norm of the squared residuals.
This is followed by evaluating the residuals of the best fit. If the residuals show monotonic deviations from the best fit (rms residuals 0.5 mag)111111The residuals in irregular galaxies correspond to the presence of wiggles in their profiles. We check this before concluding that it is associated with disc-breaks. that increase with radius, it suggests that the profile has a break and needs a second component. Then, two linear fits are implemented, using Eq. 1. In order to take into account different intervals in radius i.e., before and after the discontinuity, we have developed a procedure which automatically defines these intervals (radial ranges) to determine the break radius (). The linear fits are performed outside the bulge component. For most galaxies, the region where the bulge dominates was taken from Salo et al. (2015). Though we initially consider the whole profile (including inner components), we exclude the breaks detected in the inner regions as they are connected to component-transition rather than disc-breaks (e.g. Laine et al., 2014, 2016).
Since the aim of this multi-linear fit approach is to study the disc regions of LTGs and detect any break in this component, it cannot be considered as a tool to decompose the observed profiles into different sub-components. In fact, it makes use of a simple linear regression to define the regions where there is a significant slope change121212This also accounts for a slope error 0.05. in the light profiles of LTGs to measure the transition point.
In more detail, the first step is to estimate the radial range where the disc component is defined (i.e., an inner disc limit, , and an outer disc limit, ). This is done by an initial guess of the disc scale-lengths ( and ), from which the range is derived by varying ‘’ 131313Here is defined as the number of SB points obtained from ellipse, using a semi-major axis (pixels) step of 0.1 (1.0 + ) number of data points ( = ; = , we used n=2). The procedure is repeated for the second sub-component and so on (in case there is more than one evident break radius, known from the residuals of the fit).
We stress here that the determination of the fitting range only extends to the limiting radius .
Once the domains of the different disc components are defined, a linear least square fit is done to each of these ranges ( and ), producing best fits141414This combination is obtained by rule of product i.e., ranges for the upper and lower limits of the radial scale-lengths for the inner and outer ranges. The and parameters (in Eq.1) of each of these best linear regression fits are stored and used to estimate the point of intersection, otherwise called the break radius ().
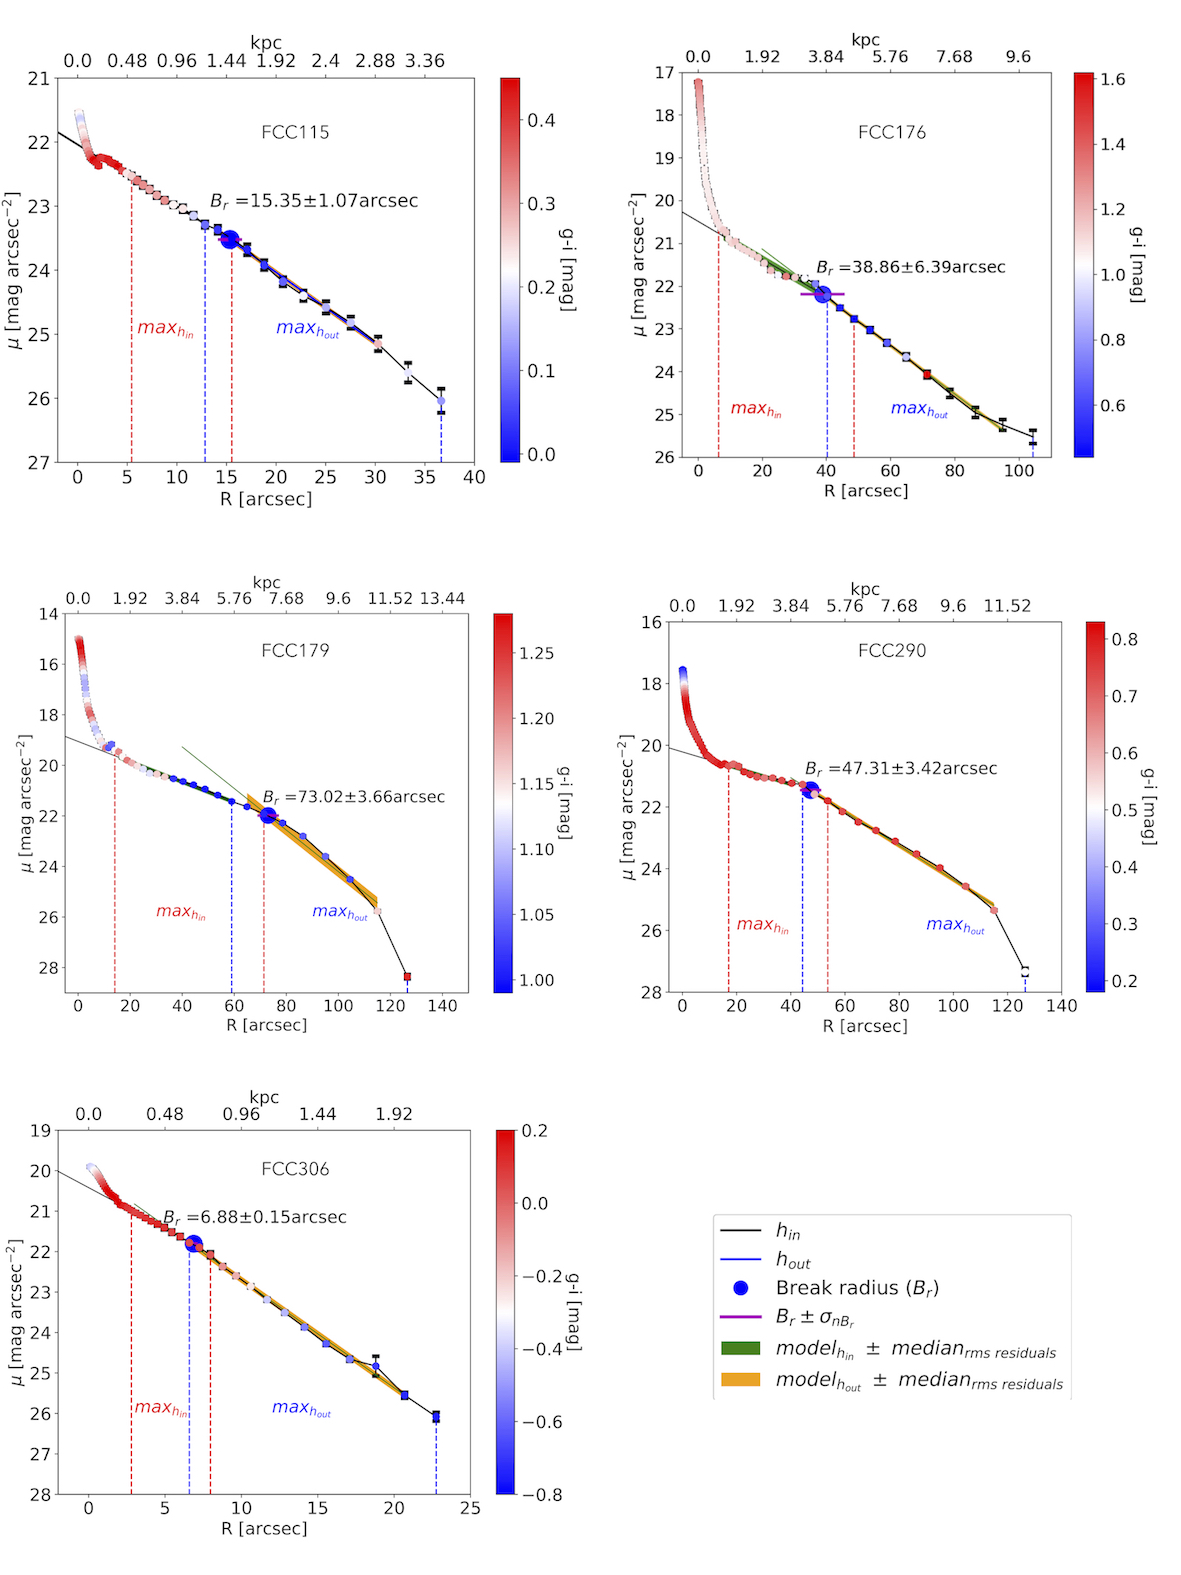
The combinations of the fitting for the ranges and are chosen such that they do not coincide and all points of the disc regions on the surface brightness profile are considered. The selection of these combinations is different from the selection of and where these represent the total range considered for and , but not for the fitting itself. This in turn produces estimates of the break radius. The median of intersecting points is chosen as the final break radius. The rms residuals (the numerical rank of the scaled Vandermonde matrix) for each linear regression fit are computed and the median of this is shown as the range of variance of the fitted models’ scale-lengths and (see Fig.3 and Fig. 4). To show the regions of variance of the intersecting point from the best fits, the standard deviation of break radii () is marked as a significant error on the estimation of the break radius. This procedure is repeated by varying the initial guess of the disc scale-lengths until a minimal standard deviation of the break radii is obtained, resulting in the best selection for and .
The regions (here, and obtained from the best fit iteration) are given as the disc scale-lengths and and are used to derive the average () colour of and .
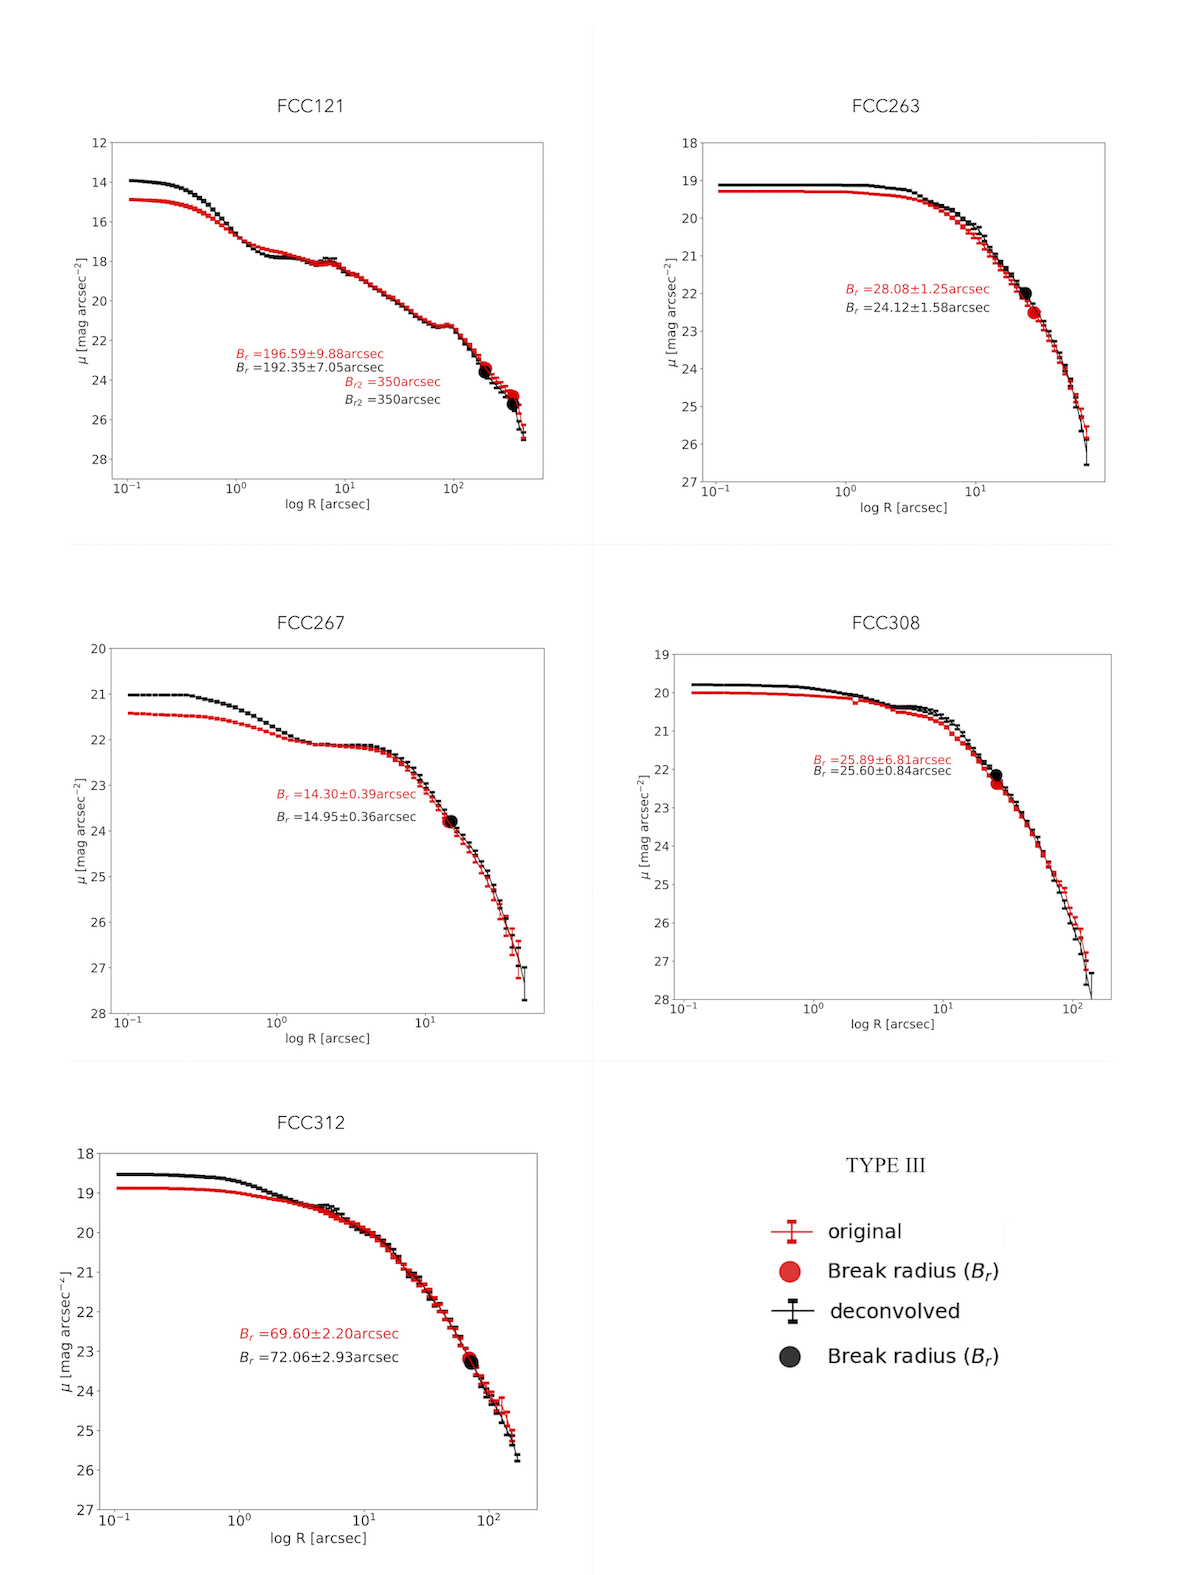
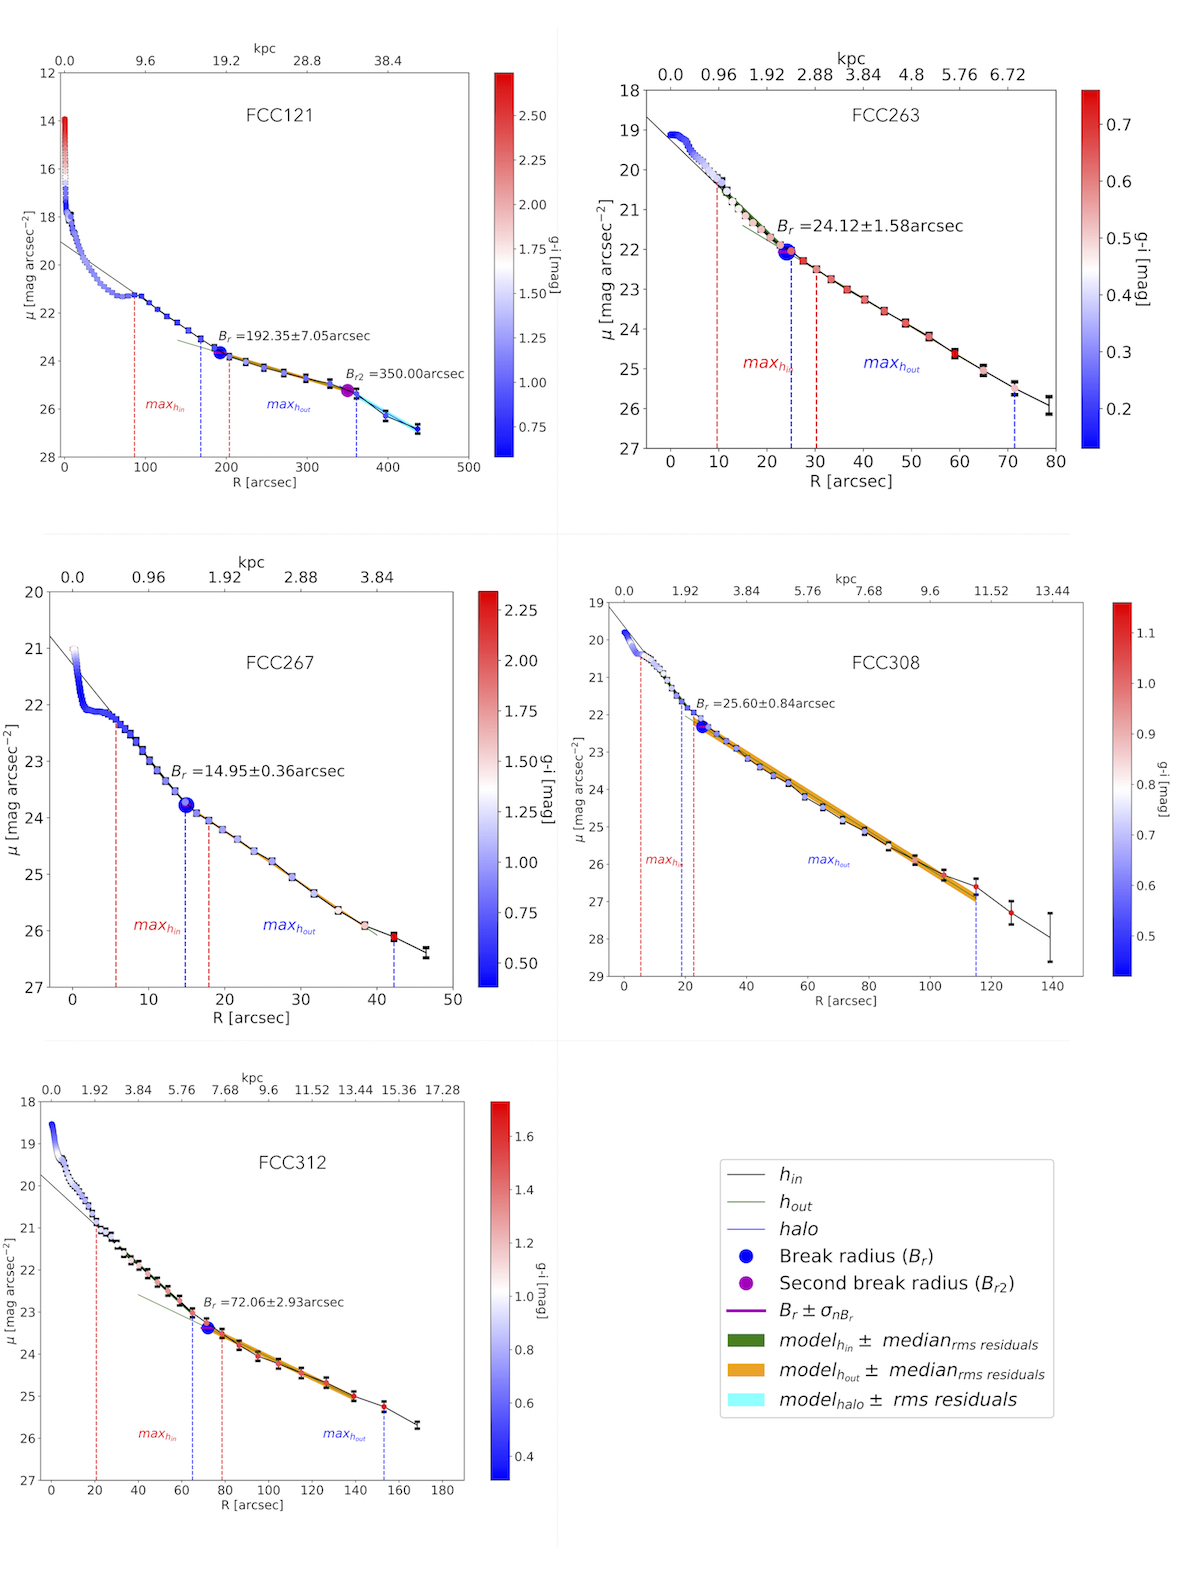
The break radius (in arcsec and kpc) of 10 galaxies with their , surface brightness at the break , and average () colour (derived from deconvolved profiles) for the inner and outer discs are listed in Tab. 6, with their deconvolved surface brightness profiles (in - band), shown in Fig. 3 and Fig. 4. We also apply the algorithm on irregular galaxies: FCC113, FCC285, and FCC302. In such cases, we do not detect disc-breaks, but rather wiggles and bumps associated to the irregularities (star forming regions) present in these galaxies. This is also checked by subtracting the small-scale wiggles from the profiles of these galaxies, and applying the algorithm on the obtained profile. These three galaxies show a Type-I profile.
Most of the galaxies in the sample show clear evidence of a single break radius, however we cannot exclude that further substructures are present beyond their outer disc scale-lengths.
For example, FCC121 shows a second break (see Fig. 4) at mag arcsec-2, which is well detected by the algorithm but it is not discussed in our analysis. This second break could be associated with the truncation radius that occurs in the outermost optical extent of a galaxy (see e.g. Martín-Navarro et al., 2012). Also, we need a minimum of 3 data points to produce fits (with a lower limit of =1), that is within the . For this reason, we do not derive a second break for some galaxies of the sample (e.g. FCC267, FCC308) though it seems to be present in their profiles.
An example of the best fits with minimal standard deviation, produced by the algorithm is shown in Appendix C. Parameters of the best fit for LTGs with disc breaks are given in Tab. 7.
For all galaxies, the break radii (inner and outer disc-breaks as in the case of FCC121) are located within regions where the effects of PSF-convolution are negligible. This is proven by deriving the break radius from deconvolved profiles and the results (original vs deconvolved profiles) are the same, as shown in Appendix. 29 and 30.
| object | Hubble | Break | ||||||||
|---|---|---|---|---|---|---|---|---|---|---|
| [arcsec] | [kpc] | [arcsec] | [] | [arcsec] | [mag] | [arcsec] | [mag] | Type (T) | Type | |
| (1) | (2) | (3) | (4) | (5) | (6) | (7) | (8) | |||
| FCC113 | - | - | - | - | - | - | - | - | 6 | I |
| FCC115 | 15.35 | 1.47 | 1.07 | 23.52 | 6.84 | 0.25 0.03 | 16.15 | 0.12 0.03 | 8 | II |
| FCC121 | 192.35 | 18.46 | 7.05 | 23.65 | 63.9 | 0.88 0.02 | 175.7 | 1.09 0.04 | 3 | III+II |
| FCC176 | 38.86 | 3.73 | 6.39 | 22.20 | 28.66 | 1.10 0.02 | 54.73 | 0.76 0.2 | 1 | II |
| FCC179 | 73.02 | 7.01 | 3.66 | 21.98 | 43.47 | 1.10 0.02 | 50.08 | 1.05 0.02 | 1 | II |
| FCC263 | 24.12 | 2.32 | 1.58 | 22.06 | 14.42 | 0.49 0.02 | 37.39 | 0.63 0.02 | 2 | III |
| FCC267 | 14.95 | 1.43 | 0.39 | 23.83 | 8.52 | 0.76 0.03 | 22.11 | 1.26 0.13 | 9 | III |
| FCC285 | - | - | - | - | - | - | - | - | 7 | I |
| FCC290 | 47.31 | 4.54 | 3.42 | 21.45 | 23.22 | 0.72 0.03 | 70.66 | 0.71 0.02 | 4 | II |
| FCC302 | - | - | - | - | - | - | - | - | 8 | I |
| FCC306 | 6.88 | 0.66 | 0.15 | 21.81 | 2.92 | 0.09 0.01 | 14.1 | -0.39 0.07 | 9 | II |
| FCC308 | 25.60 | 2.46 | 0.84 | 22.32 | 14.11 | 0.71 0.02 | 92.25 | 0.75 0.04 | 7 | III |
| FCC312 | 72.06 | 6.91 | 2.93 | 23.38 | 42.17 | 1.16 0.05 | 67.79 | 1.54 0.03 | 7 | III |
5 Morphological segregation of LTGs inside the virial radius of the Fornax cluster
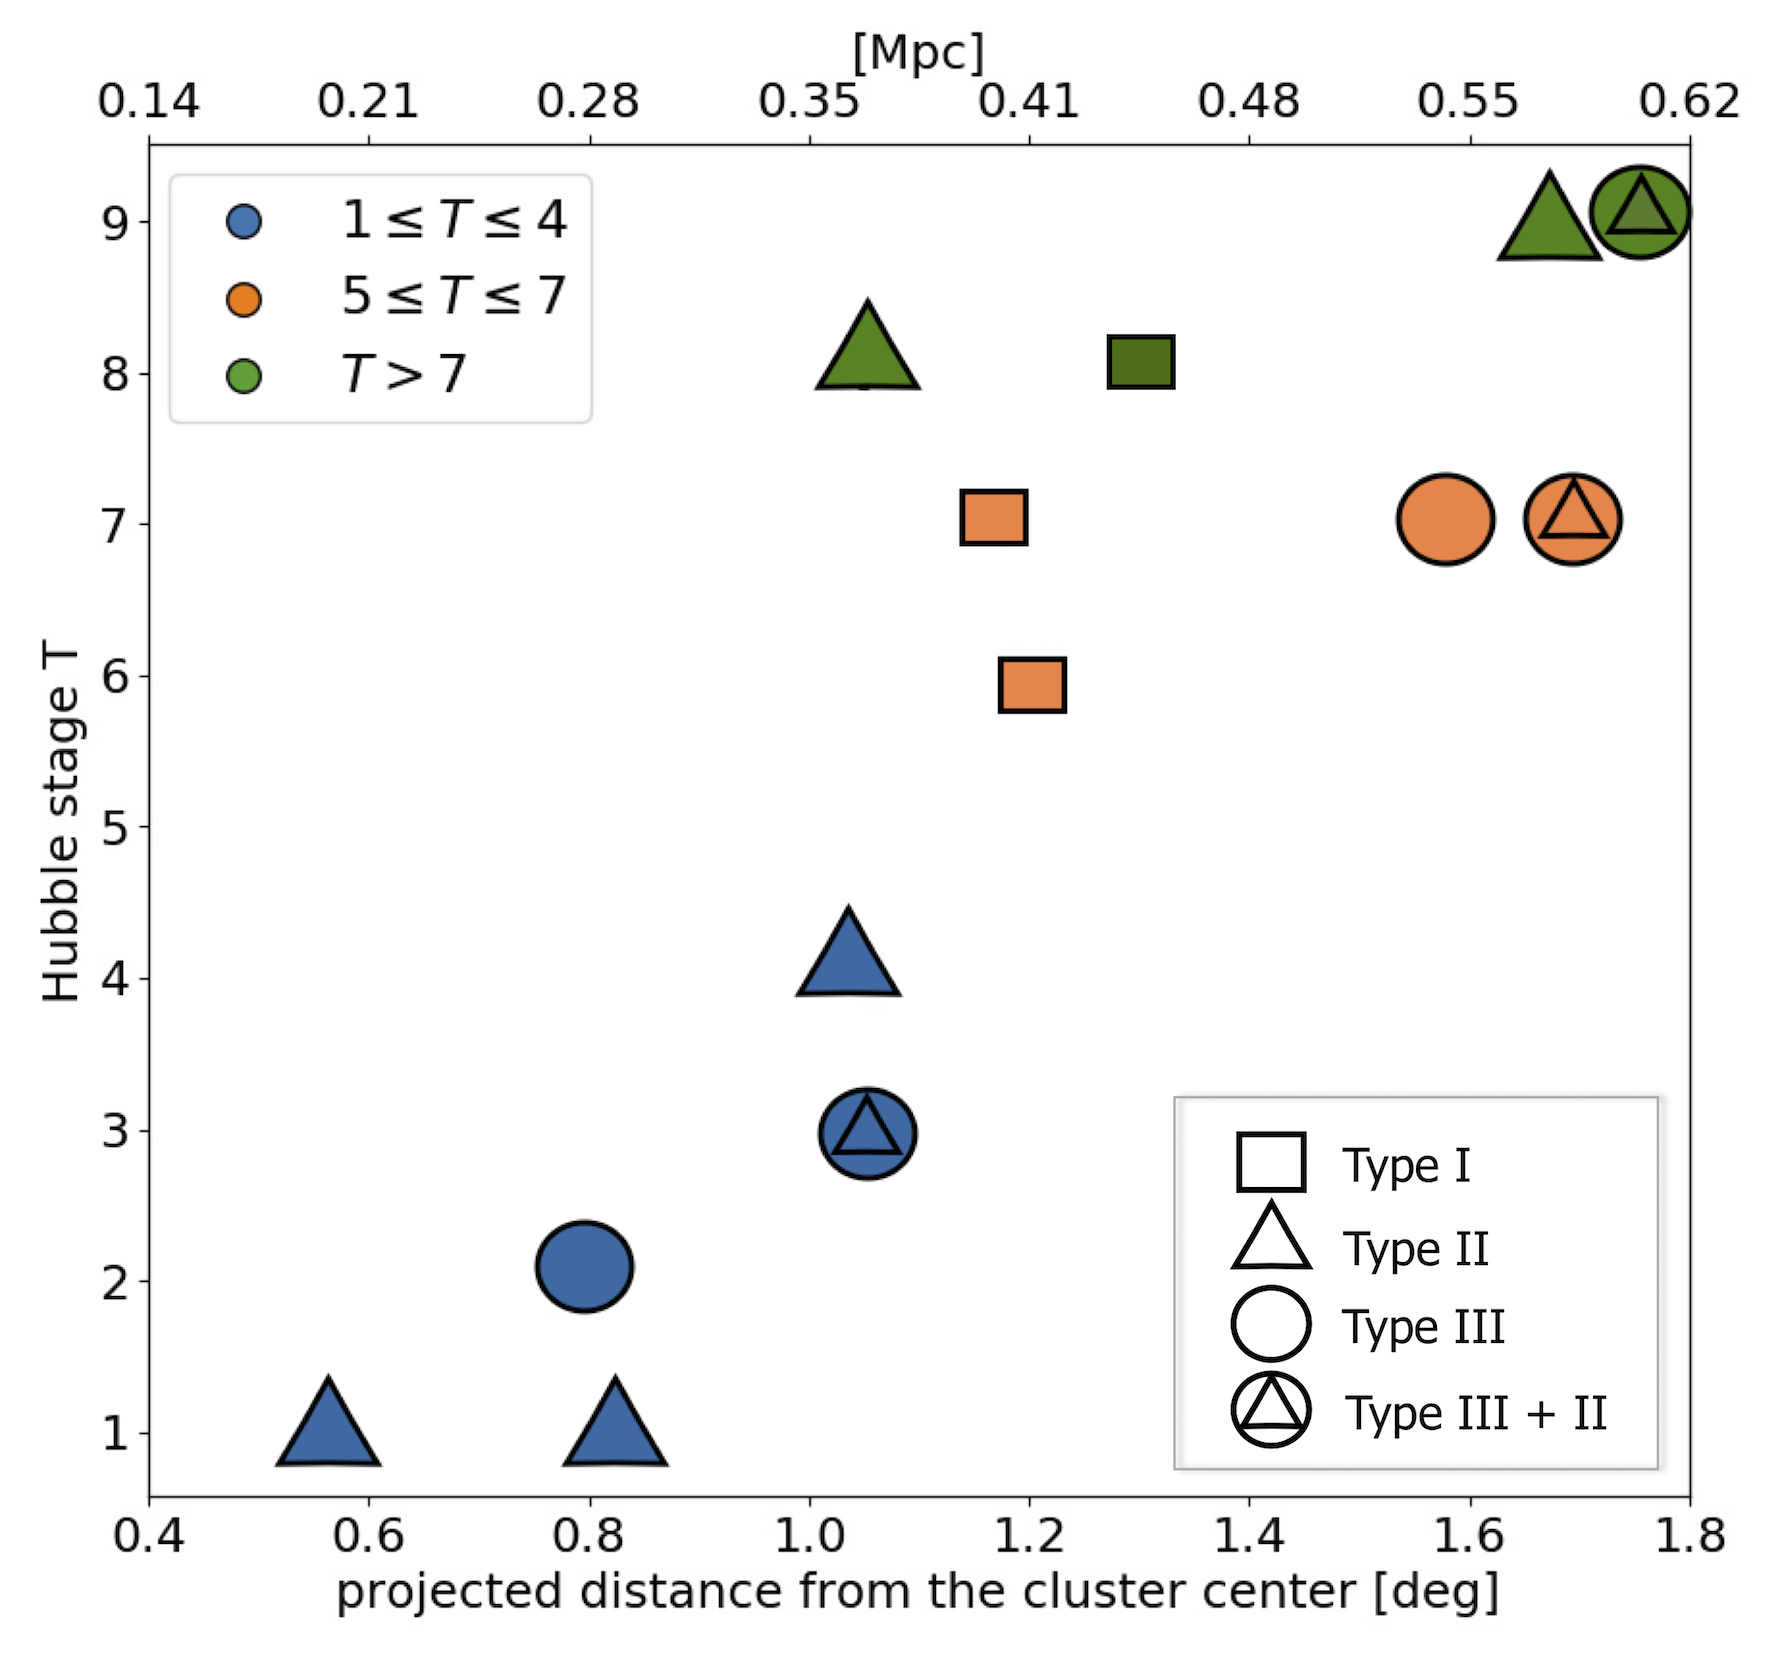
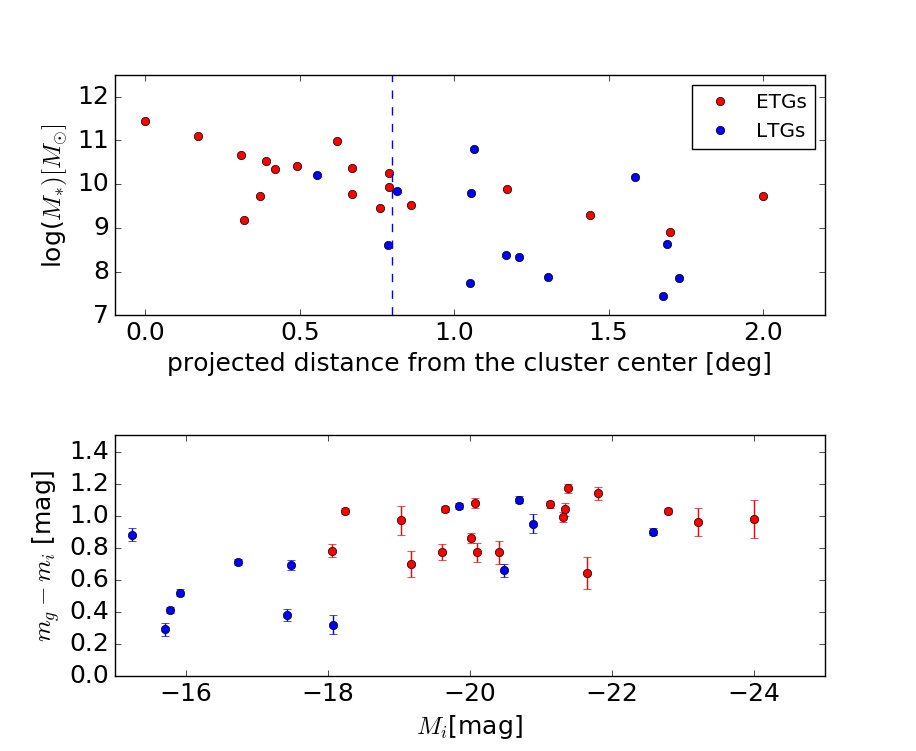
The sample of LTGs inside the virial radius of the Fornax cluster is heterogeneous in morphology as measured by their T-type Hubble classes. These are shown as a function of the projected distance in Fig. 5. The correlation is not as tight as previously reported in other similar environments e.g., Virgo (Binggeli et al., 1987) and other clusters (Whitmore, 1993). Here, the projected distances have been used as a primary parameter to discern the formation and evolution of the galaxies’ substructures as a function of the cluster environment. However, one must also take into account other environment-independent mechanisms like pre-processing (e.g. Fujita, 2004), which are independent of the local environment. In this section, we analyse the morphological structures of the galaxies in our sample by grouping them into bins of Hubble stage as a function of projected cluster-centric distance (), shown in Fig. 5.
The LTGs in Fornax with morphological type are FCC121, FCC176, FCC179, FCC263, and FCC290. These galaxies are located within 1.1 deg from the cluster centre (see Fig. 1 and 5), corresponding to 0.54 . Overall, they are among the most luminous ( 14 mag, refer Tab. 2) LTGs in our sample. They show regular spiral or barred-spiral structures with clear grand design features. Three of the above mentioned galaxies (FCC176, FCC179, FCC263) are, in projection, located within the X-ray halo of NGC 1399 (see Fig. 1).
FCC176 and FCC179 are redder than other LTGs inside the virial radius (see Fig. 7) with the former devoid of atomic and molecular gas (Fuller et al., 2014; Schröder et al., 2001) and the latter shows dust and molecular gas in its spiral arms. FCC121 and FCC290 are located beyond the X-ray halo with morphological type . FCC290 has spiral arms only inside 1 (see Appendix 19). FCC121 has grand design spiral structure with a bar.
Galaxies with morphological type are FCC113, FCC285, FCC308, and FCC312. These galaxies are located beyond 1.1 deg. The former two galaxies (FCC113 and FCC285) are lopsided with luminosities 14 15 mag and the latter two (FCC308, FCC312) have boxy discs with 14 mag. FCC113 and FCC285 exhibit irregular star-forming regions, which are evident in their SB images (Appendix. 11 and 18). They are located on either sides of the cluster centre with their asymmetric discs elongated towards the cluster centre (see Fig. 1). FCC308 and FCC312 have irregular star-forming regions in their ill-defined spiral arms. Their thick discs also have flares which are signs of minor mergers (e.g Knierman et al., 2012).
The very late morphological type galaxies are FCC115, FCC302, FCC306, FCC267. FCC115 and FCC302 are edge-on galaxies (making it hard to determine their true morphological T-type), while FCC306 is a bright dwarf galaxy (Drinkwater et al., 2001). FCC267 has a double nucleus or a dust-obscured bar (see Appendix 17). These galaxies have irregular star-forming regions and lumosities in the range 15 16.6 mag (refer Tab. 2). All the galaxies in this group are located beyond 1 deg. None of the aforementioned () have visible, regular spiral structures with star-forming regions, unlike the galaxies at smaller cluster-centric distances.
Despite our small heterogeneous sample of LTGs, we can still infer that the overall morphological segregation of galaxies inside the virial radius strongly suggests that the number density of ETGs is higher near the cluster centre ( 0.8 deg 0.27 Mpc, Iodice et al. 2019b), where only the massive LTGs of earlier types () are found (see Fig. 6: top panel). Galaxies with morphological type 5 9 ( 60 % of the sample) are located beyond 1 deg 0.36 Mpc i.e. beyond the high-density (ETG-dominated) regions defined by Iodice et al. (2019b).
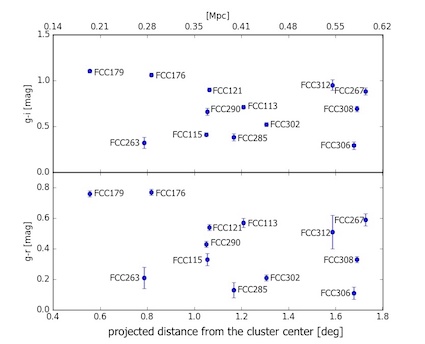
We do not find any trends between average ( and ) colours as a function of cluster-centric distance (see Fig. 7), as observed by Iodice et al. (2019b) for ETGs. From the colour-magnitude relation diagram (Fig. 6), we find a positive correlation as expected and a clear segregation in colours from the bright ETGs in the cluster (see Fig. 6: lower panel).
6 Analysis of the disc breaks
In this section, we analyse disc breaks by investigating possible correlations with some global properties such as colours, total magnitudes, stellar mass, molecular gas, and with the galaxy’s location in the cluster. Since the sample is limited to 13 galaxies, the results cannot be considered on a statistical basis. However, it represents the complete sample of bright LTGs in the Fornax core and the analysis of their disc properties will provide important information on the assembly history of the cluster.
In Fig. 5, we show the different disc-break types are distributed as a function of the cluster-centric distance. There is no evident correlation between the morphological type (T) and the disc-break type. On the whole, we can give the same conclusion about the distribution of different disc-break types inside the virial radius, i.e. Type II and Type III breaks are found in galaxies at both small and large cluster-centric distances. It is worth noting that Type I galaxies (only 3 galaxies) are found around 1.2 deg ( Mpc).
The surface brightness at the break radius in Type II discs is in the range 22.5 24 (see Fig 8).
On average, these galaxies have bluer () colours in their outer discs () in comparison to their inner discs () (see Fig 9 and refer Tab. 6). FCC179 and FCC290 have bluer outer discs (than their inner discs), with a difference mag, which is above the error (refer Tab. 6). However, their inner discs have dust and this can cause the observed red colour. FCC115 and FCC306 are very late type galaxies that are bluer on average (see Fig. 7) with the former being the faintest in the sample and the latter, a bright dwarf.
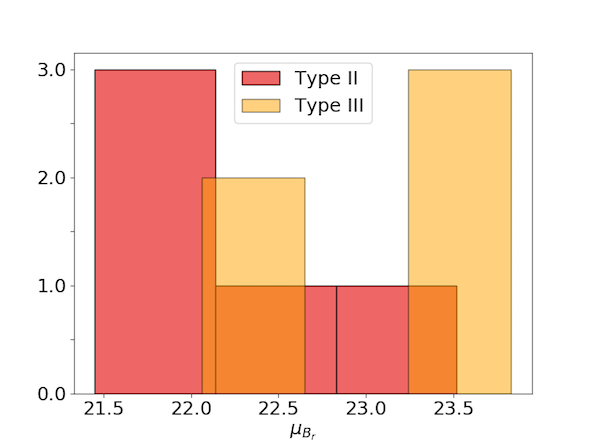
Type III disc-breaks have surface brightness levels in the range 21.5 23 (see Fig. 8), i.e., more luminous than the of Type II disc-breaks.
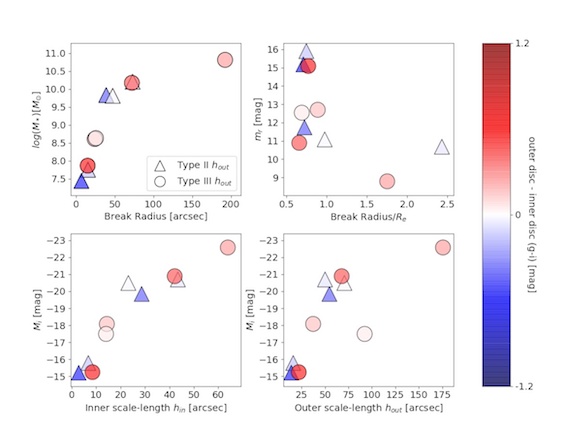
These galaxies have redder () outer discs than their inner discs (see Fig. 9 and Tab. 6). Most of the Type III galaxies show signs of merger events taken place in the past e.g., FCC263 with disturbed molecular gas (Zabel et al., 2019), tidal tails 171717Galaxies with tidal tails were classified as Type IIIa by Watkins et al. (2019) in FCC308 and FCC312 , double nuclei in FCC267, which can produce up-bending profiles. The redder colour may be accounted for the transfer of stellar mass to the outer disc during interactions (Younger et al., 2007). The redder outer discs may also be associated with the exhaustion of gas via ram-pressure stripping (see e.g. Steinhauser et al., 2016; Pranger et al., 2017).
We find a positive correlation between stellar mass and the break radius (see Fig.9: top left panel). This trend is expected and has been shown before in literature (e.g Pohlen & Trujillo, 2006). In comparison to the results by Pohlen & Trujillo (2006), we also find that luminous galaxies have larger inner disc scale-lengths as shown in Fig. 9 (bottom panel). This trend is still evident in the plot of the total magnitude as a function of the break radius normalised to the effective radius (see Fig. 9: top right panel), where most of our sample galaxies have break radius in the range of 0.5 1.25 , while the two brightest galaxies have .
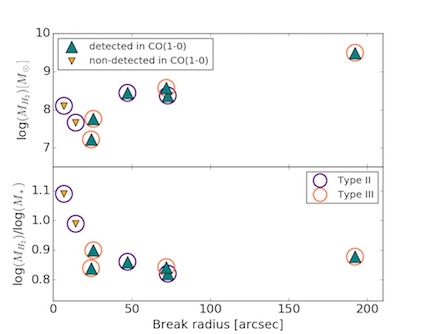
We used the molecular gas mass derived from CO (1-0) emission, as part of the ALMA Fornax cluster Survey (Zabel et al., 2019) to obtain molecular gas-fractions () and plot them against the break radius for eight galaxies in our sample, of which six are detected in CO(1-0), and two are non-detected (see Fig. 10). The in the latter cases is the 3 upper limit. We also plot the CO maps in contours on our -band images along with the break radius (see Appendix B). From this, we find that the molecular gas (CO) detection is within the uncertainties of the break radius. Since molecular gas is a prerequisite for star formation, the break radius could also be a sign of a ‘break in star formation’ (see Roškar et al., 2008; Sánchez-Blázquez et al., 2009; Christlein et al., 2010). Fig. 10 shows that galaxies with larger break radius have higher molecular gas mass, and lower gas-fractions.
7 Summary of the results and Discussion
Inside the virial radius of the Fornax cluster ( Mpc), there are 13 LTGs brighter than mag. In this work, we investigate the structure of this small, yet complete sample of 13 LTGs and in doing so, analyse any possible correlations with their position in the cluster. One aim is to study the disc component and hence, we have developed an algorithm to define and measure break radii in their surface brightness profiles (Sect. 6).
The main results of this work are summarised below:
-
1.
From Fig. 5, it is evident that our sample of LTGs is heterogeneous in morphology. Still we find that galaxies with morphological type T 4 located at smaller cluster-centric distances. Among these, FCC176 and FCC179 (morphological type T=1) seem to be in a transition phase to S0/SB0. Later morphological types (5 9, 60 % of the sample) are located at 1 deg 0.36 Mpc i.e. beyond the high-density of ETG-dominated regions ( 0.8 deg 0.27 Mpc). Most of these show signatures of tidal interactions in the form of lopsidedness (FCC113 and FCC285), thick discs and tidal tails (FCC308 and FCC312) or double nuclei/dust-obscured bar (FCC267).
-
2.
There is an equal fraction (38%) of Type II and Type III discs in the sample, while only three galaxies (23%) show a classical Type I exponential disc. There is no evident correlation between and the type of disc-break. Type II galaxies have bluer outer discs( mag), while Type III galaxies have redder outer discs( mag). Brighter and massive galaxies have larger break radii. For galaxies detected in CO(1-0), the molecular gas is within the break radius.
In the following sections, we discuss the results mentioned above in order to address the evolution of LTGs inside the virial radius of the Fornax cluster.
7.1 Evolution of LTGs inside the virial radius of the Fornax cluster
The Fornax cluster has been considered as a classic example of a virialised cluster with regular galaxy distribution (Grillmair et al., 1994; Jordán et al., 2007). This cluster is dynamically more evolved than the Virgo cluster with a high fraction of ETGs in its core (Grillmair et al., 1994; Jordán et al., 2007; Iodice et al., 2019b). Inside its virial radius, Iodice et al. (2019b) found that the ETGs are not spherically distributed around NGC 1399, rather, they are located along a stripe i.e. N-S direction in the West side of NGC1399 (also refer to Fig. 1). Along this direction, signatures of an ICL component have been found (Iodice et al., 2017b), mirrored by globular clusters (GC) density substructures (D’Abrusco et al., 2016; Cantiello et al., 2018), and supported by kinematical measurements by PNe (Spiniello et al., 2018) and GCs (Pota et al., 2018). All of this suggests that there are interactions between Fornax cluster members (Iodice et al., 2017b) and among galaxies with the overall cluster potential (Spiniello et al. 2018; Pota et al. 2018). This “stripe” along the W-NW direction of NGC1399, otherwise called as W-NW sub-clump, may have resulted from the accretion of a galaxy-group during the build-up of the cluster, hence creating what has been perceived to be an asymmetry (Iodice et al., 2019b). To further substantiate this accretion and the consequences on its surroundings, all the LTGs brighter than 16.6 mag, presented in this work, are not located spatially anywhere near this sub-clump of ETGs. In fact, these LTGs are located in the opposite direction (East side of NGC 1399, in 2D projection) of this high-density ETG-zone (Fig. 1), except for FCC113, a lopsided galaxy. However the lopsided tail of FCC113 appears to be elongated in the direction pointing towards the cluster centre (see Appendix. 11).
Our results concerning the morphological segregation of ETGs crowding the central regions (Iodice et al., 2019b), and LTGs located at larger cluster-centric distance inside the virial radius of the Fornax cluster, is consistent with previous findings of the this relation in Virgo (Binggeli et al., 1987) and other clusters (Dressler, 1980; Whitmore, 1993). Some of the mechanisms that have been proposed to explain the morphological segregation are ram pressure stripping (Gunn & Gott, 1972), galaxy harassment (Moore et al., 1996), truncated star-formation (Larson et al., 1980), galaxy-galaxy interaction (Lavery & Henry, 1988).
Due to the higher intra-cluster gas density and higher cluster-centric velocities of galaxies, ram-pressure stripping is 16 times more effective/stronger in the Virgo cluster (Davies et al., 2013). However, as the Fornax cluster hosts 300 galaxies with 18 (Ferguson, 1989), which is an order of magnitude lower than the galaxy population in Virgo, it is suggested that galaxy-galaxy interactions play a prominent role in the evolution of Fornax cluster members (e.g. D’Abrusco et al., 2016; Iodice et al., 2017b, a; Venhola et al., 2017, 2018; Spiniello et al., 2018). In addition to this, it is also necessary to take into account pre-processing of a galaxy before falling into a cluster, and that the enhanced ram-pressure stripping occurs when the group passes through the cluster pericentre (Vijayaraghavan & Ricker, 2013).
With these mechanisms stated, we examine the morphological evolution of LTGs inside the virial radius of the Fornax cluster.
7.1.1 Late-type spiral (Scd-Sdm) galaxies
Galaxies with morphological type 5 9 are located at 1 deg 0.36 Mpc. Among these, FCC308 and FCC312 show signs of interactions in the form of tidal tails. The presence of these tails can either be explained by minor-merging events or by the disruption of the outer discs during infall, due to the strong tidal shear in the cluster centre (Whitmore, 1993). Galaxies with asymmetric stellar discs (FCC113 and FCC285) could have experienced similar mechanisms during infall, but after the cluster collapse (Whitmore, 1993). Since these galaxies have tidal disturbances similar to NGC 1427A, another possible mechanism for this is that it was triggered by a recent fly-by of another galaxy in the cluster (Lee-Waddell et al., 2018). However, more analysis on the HI distribution of these galaxies are required to confirm the possibility of ram-pressure stripping acting on them (e.g Vollmer, 2003).
FCC115, FCC302, FCC267, FCC306 are faint galaxies ( 16.6) with morphological type 7 (Sd-Sdm). The former two have ill-defined spiral arms, and the latter two have faint spiral arms. As mentioned in the previous paragraph, these galaxies could have experienced disruptions due to the gravitational potential well of the cluster core, during infall. Since protogalactic clouds which are needed to form Sd galaxies are destroyed during the cluster collapse, these galaxies are dominant at larger cluster-centric distances (Whitmore, 1993).
7.1.2 Galaxies transitioning into S0
FCC176 and FCC179, which are located at 0.82 deg, are classic examples of galaxies transitioning into lenticulars (S0/SB0) in a dense environment. FCC290 ( = 1.05) also has similar disc structure to FCC179, such that the spiral arms are found only in their central regions ( 1) whereas their outer-disc is devoid of any feature (including star-formation blobs and molecular gas). Their discs resemble the smooth structure, that is typically found in the discs of S0 galaxies. FCC176 and FCC179 are close to the cluster core and are the redder and more massive LTGs of our sample, with average colour 1 mag and 0.6 (see Tab. 7). Larson et al. (1980) first explained how blue galaxies evolve to red galaxies over Hubble time, and this was followed by several other supporting evidences of galaxies losing their gas as a consequence of environmental effects (e.g. Boselli & Gavazzi, 2006; D’Onofrio et al., 2015; Gao et al., 2018, and references therein). FCC176 could have formed before the cluster collapse and therefore resides in the X-ray halo of NGC 1399 (e.g. Whitmore, 1993). This galaxy’s morphological evolution under the influence of the cluster environment has caused it to be HI deficient. However, FCC179 and FCC290 are detected in HI (Schröder et al., 2001) and CO(1-0) (Zabel et al., 2019). The CO disc in spiral galaxies is usually concentrated within 1 (see e.g. Davis et al., 2013). The outer gas discs in spirals that extend to their optical radius are typically HI dominated. HI imaging would be required to confirm that these galaxies have been pre-processed (see e.g. Fujita, 2004; Vijayaraghavan & Ricker, 2013), or that they have experienced ram-pressure/tidal stripping during infall, which has resulted in the loss of their outer disc gas (Larson et al., 1980).
7.2 Break radius as a proxy for the structural evolution of LTGs
Disc breaks in the light profiles of LTGs have known to occur as a consequence of internal mechanisms (e.g. formation of bars) or external mechanisms (e.g. effect of the environment), or sometimes both (Martín-Navarro et al., 2012). It has proven to be a vital parameter in the study of the stellar and gaseous discs of LTGs (e.g. Martin & Kennicutt, 2001; Roediger et al., 2012; Peters et al., 2017, and references therein). As such, we will use the break radius to further discuss the structural and morphological evolution of LTGs inside the virial radius of the Fornax cluster. To this aim, we also take into account the correlation of molecular gas distribution with the break radius, observed for six LTGs in the sample. The CO(1-0) detection (Zabel et al., 2019) is within the uncertainties of the inner break radius (see Appendix B) implying that there could also be a star-formation break e.g. in FCC290, as previously suggested (e.g. Roškar et al., 2008; Sánchez-Blázquez et al., 2009; Christlein et al., 2010). As the concentration of molecular gas within the break radius could have occurred as a consequence of a different mechanism from that of the disc-break itself, further analysis on their stellar populations is required to confirm this correlation.
7.2.1 Type III disc break
Type III breaks in clusters are found in galaxies with past minor/major mergers. Minor mergers can cause gas-inflows towards the centre of the primary gas-rich galaxy which steepens the inner profile, and expands the outer profile as the angular momentum is transferred outwards during the interaction (Younger et al., 2007), while major mergers usually produce Type-III S0 galaxies (Borlaff et al., 2014). This process can also explain the presence of molecular gas close the center, inside their break radius.
FCC308 and FCC312 have boxy discs and morphological type = 7, with flares in their disc, showing signs of minor merger, as already stated. The disc break of these galaxies could have also occurred as result of external mechanisms in the cluster environment, where the tidal shear of the cluster core causes disruptions in their disc.
FCC121 and FCC263 are barred-spiral galaxies which do not have cold gas beyond their break radius. Within their break radius, these galaxies also show strong star-formation activity (molecular gas and bright blue knots, see Appendix. B), whereas the outer disc of FCC263 does not show any signs of current star-formation, and in the case of FCC121, there is a small fraction of bright knots along the spiral arms. External mechanisms as previously stated, result in the removal of gas during infall via tidal stripping by the halo potential (Larson et al., 1980).
7.2.2 Type II disc break
Models for Type II breaks are linked to star-formation threshold (e.g. Martin & Kennicutt, 2001) and radial migration of stars (e.g. Martínez-Serrano et al., 2009; Roediger et al., 2012). The stellar disc of early-type spirals tends to be more massive than their gaseous disc, which implies a star-formation threshold around their break radius (Martin & Kennicutt, 2001).
The disc break in barred galaxies has also been associated with the bar radius and the Outer Lindlblad Resonance(OLR) (see Muñoz-Mateos et al., 2013; Laine et al., 2014), like in the case of FCC176.
Flared discs in highly inclined galaxies like FCC115 (faintest galaxy) and FCC306 (bright dwarf) can produce a less-pronounced break (see e.g. Borlaff et al., 2016). The disruptions in the outskirts of their discs may have resulted as a consequence of the gravitational potential well of the cluster core.
FCC179 and FCC290 (Type II) are spiral galaxies without cold gas in their outer disc (see Sect. 5 and 7.1). The former is located within the X-ray halo (see Fig. 1), while the latter is located beyond the X-ray halo. The break radius of these galaxies are not only associated with the absence of molecular gas in their outer disc but also the absence of spiral arms.
Though Erwin et al. (2012) found that there was an absence of Type II profiles in Virgo cluster S0s, suggesting that the Type II profiles can transition into Type I, in a cluster environment, or that Type I were turning into Type II profiles (no models have predicted this yet), there might be other mechanisms that could also cause them to form a Type-III break. As such, the processes (internal and external) causing disc-breaks are a part of the evolutionary phases of LTGs in the Fornax cluster.
7.2.3 What can the average () colour of the inner and outer discs of LTGs indicate?
We find that Type II galaxies have bluer outer discs, while Type III galaxies have redder outer discs. In addition, the molecular gas detection is only within the break radius of six LTGs. Both findings might suggest that there is a stellar population gradient across the disc (e.g. Bell & de Jong, 2000). Since we do not find any segregation inside the virial radius of the cluster for Type II and Type III discs, this might indicate that different processes acted in different regions of the cluster.
There have been numerous studies concerning the outer-colour of LTGs with disc breaks (see e.g. Bakos et al., 2008; Roediger et al., 2012; Laine et al., 2016; Watkins et al., 2019, and references therein), but no conclusive results have been given to explain these findings. External mechanisms like ram-pressure stripping (removal of cold gas) and strangulation (removal of hot gas), or stellar migration (e.g Roškar et al., 2008) have been found to cause reddening in cluster LTGs (e.g. Steinhauser et al., 2016; Pranger et al., 2017). The ram-pressure stripping or strangulation could have been responsible for the reddening in the outer Type III discs in FCC263 and FCC121, which are located (projected distance) in the transition region from high-to-low density region of the cluster, where the X-ray emission is decreasing (see Fig. 1). For the other two Type III galaxies (FCC267 and FCC312) far away from the cluster core, with a significant color gradient between inner and outer disc, a different process could have been responsible for the redder colors in the outskirts. Both of them, show also evident signs of past merging (see Appendix 17 and Appendix 24).
Simulations by Hwang et al. (2018) have shown that LTGs entering a cluster could have encounters with ETGs, and during this phase, they can have strong star-formation activity yet losing their cold gas, which can also cause the presence of bluer outer discs. This could be the case of Type II galaxies inside the high density regions of the cluster, as FCC176 and FCC179 that show a color difference larger than the error estimate (see Tab. 6) and an ongoing star formation in the centre (see Appendix 14 and Appendix 15).
8 Concluding remarks and future perspectives
FDS data allow us to map the light distribution of galaxies down to the faintest magnitudes where the effects of the environment on the evolutionary stages of Fornax cluster galaxies can be studied in depth. In this work we have shown how such studies are especially useful in the analysis of disc-breaks, which in turn provides a ground in further analysis of the stellar populations beyond the break radius.
Despite the limited size of our LTG sample (13 objects), the morphological segregation of LTGs inside the virial radius of the Fornax cluster is clearly detected and is consistent with previous results that suggest that high-density ETG-dominated zones inhibit the formation of LTGs (5 9) in a cluster environment.
We have used the results derived from the break radius as a means to discern the different mechanisms (external and internal) causing the structural evolution of LTGs inside the virial radius of the Fornax cluster. Their structural evolution would eventually cause a morphological transition. Since the sample is small, we do not give a generic conclusion that disc-breaks are indeed good proxies, but rather for the Fornax cluster. Some of the important results from our disc-break analysis is that the average () colour of the outer disc i.e., beyond the break radius of LTGs, depends on their disc-break type. For galaxies detected in CO(1-0), if star formation differences created their disc-breaks, then molecular gas within their primary break radius could define the break radius.
Further investigation on the stellar population content of the discs in LTGs from the Fornax3D data (Sarzi et al., 2018; Iodice et al., 2019a) and infall time via phase-space analysis (e.g. Rhee et al., 2017) could address the origin of the different color gradients in Type II and Type III in the Fornax cluster. In a forthcoming paper, we provide a detailed comparison of structure and evolution of LTGs in the cluster core and LTGs in the infalling SW subgroup centered on Fornax A (M.A.Raj, H.-S.Su et al. in prep), which is a different environment mainly populated by LTGs (Iodice et al., 2017b).
Acknowledgements.
The authors are immensely grateful to the anonymous referee for the useful comments and suggestions that significantly improved this article.This publication has received funding from the European Union Horizon 2020 research and innovation programme under the Marie Skłodowska-Curie grant agreement n. 721463 to the SUNDIAL ITN network.
This work is based on visitor mode observations collected at the European Organisation for Astronomical Research in the Southern Hemisphere under the following VST GTO programs: 094.B-0512(B), 094.B- 0496(A), 096.B-0501(B), 096.B-0582(A).
This research has made use of the NASA/IPAC Extragalactic Database (NED), which is operated by the Jet Propulsion Laboratory, California Institute of Technology, under contract with the National Aeronautics and Space Administration.
E.I and M. S. acknowledge financial support from the VST project (P.I. P. Schipani)
NRN acknowledges financial support from the “One hundred top talent program of Sun Yat-sen University” grant N. 71000-18841229.
GvdV acknowledges funding from the European Research Council (ERC) under the European Union’s Horizon 2020 research and innovation programme under grant agreement No 724857 (Consolidator Grant ArcheoDyn).
We thank Dr. Ignacio Trujillo and Dr. Johan Knapen for their suggestions and comments on the break radius of LTGs, and Dr. Crescenzo Tortora for his suggestions and comments.
We would also like to show our gratitude to Dr. Tim de Zeeuw for his insights on this work.
References
- Abadi et al. (1999) Abadi, M. G., Moore, B., & Bower, R. G. 1999, MNRAS, 308, 947
- Bakos et al. (2008) Bakos, J., Trujillo, I., & Pohlen, M. 2008, ApJ, 683, L103
- Bell & de Jong (2000) Bell, E. F. & de Jong, R. S. 2000, MNRAS, 312, 497
- Binggeli et al. (1987) Binggeli, B., Tammann, G. A., & Sandage, A. 1987, AJ, 94, 251
- Binney & Tremaine (1987) Binney, J. & Tremaine, S. 1987, Galactic dynamics
- Blanton & Moustakas (2009) Blanton, M. R. & Moustakas, J. 2009, ARA&A, 47, 159
- Borlaff et al. (2016) Borlaff, A., Eliche-Moral, M. C., Beckman, J., & Font, J. 2016, A&A, 591, L7
- Borlaff et al. (2017) Borlaff, A., Eliche-Moral, M. C., Beckman, J. E., et al. 2017, A&A, 604, A119
- Borlaff et al. (2014) Borlaff, A., Eliche-Moral, M. C., Rodríguez-Pérez, C., et al. 2014, A&A, 570, A103
- Boselli & Gavazzi (2006) Boselli, A. & Gavazzi, G. 2006, PASP, 118, 517
- Bureau & Freeman (1999) Bureau, M. & Freeman, K. C. 1999, AJ, 118, 126
- Buta (2011) Buta, R. J. 2011, arXiv e-prints
- Cantiello et al. (2018) Cantiello, M., D’Abrusco, R., Spavone, M., et al. 2018, A&A, 611, A93
- Capaccioli et al. (2015) Capaccioli, M., Spavone, M., Grado, A., et al. 2015, A&A, 581, A10
- Christlein et al. (2010) Christlein, D., Zaritsky, D., & Bland-Hawthorn, J. 2010, MNRAS, 405, 2549
- Courteau (1996) Courteau, S. 1996, ApJS, 103, 363
- D’Abrusco et al. (2016) D’Abrusco, R., Cantiello, M., Paolillo, M., et al. 2016, ApJ, 819, L31
- Davies et al. (2013) Davies, J. I., Bianchi, S., Baes, M., et al. 2013, MNRAS, 428, 834
- Davis et al. (2013) Davis, T. A., Alatalo, K., Bureau, M., et al. 2013, MNRAS, 429, 534
- de Jong (1996) de Jong, R. S. 1996, Journal of Astronomical Data, 2
- de Vaucouleurs (1959) de Vaucouleurs, G. 1959, AJ, 64, 397
- D’Onofrio et al. (2015) D’Onofrio, M., Marziani, P., & Buson, L. 2015, Frontiers in Astronomy and Space Sciences, 2, 4
- Dressler (1980) Dressler, A. 1980, ApJ, 236, 351
- Drinkwater et al. (2001) Drinkwater, M. J., Gregg, M. D., & Colless, M. 2001, ApJ, 548, L139
- Elmegreen et al. (1992) Elmegreen, D. M., Elmegreen, B. G., Combes, F., & Bellin, A. D. 1992, A&A, 257, 17
- Erwin et al. (2005) Erwin, P., Beckman, J. E., & Pohlen, M. 2005, ApJ, 626, L81
- Erwin et al. (2012) Erwin, P., Gutiérrez, L., & Beckman, J. E. 2012, ApJ, 744, L11
- Erwin et al. (2008) Erwin, P., Pohlen, M., & Beckman, J. E. 2008, AJ, 135, 20
- Fall & Efstathiou (1980) Fall, S. M. & Efstathiou, G. 1980, MNRAS, 193, 189
- Ferguson (1989) Ferguson, H. C. 1989, AJ, 98, 367
- Fujita (2004) Fujita, Y. 2004, Publications of the Astronomical Society of Japan, 56, 29
- Fuller et al. (2014) Fuller, C., Davies, J. I., Auld, R., et al. 2014, MNRAS, 440, 1571
- Gadotti & Dos Anjos (2001) Gadotti, D. A. & Dos Anjos, S. 2001, in Astronomical Society of the Pacific Conference Series, Vol. 230, Galaxy Disks and Disk Galaxies, ed. J. G. Funes & E. M. Corsini, 237–238
- Gao et al. (2018) Gao, H., Ho, L. C., Barth, A. J., & Li, Z.-Y. 2018, ApJ, 862, 100
- Grado et al. (2012) Grado, A., Capaccioli, M., Limatola, L., & Getman, F. 2012, Memorie della Societa Astronomica Italiana Supplementi, 19, 362
- Grillmair et al. (1994) Grillmair, C. J., Freeman, K. C., Bicknell, G. V., et al. 1994, ApJ, 422, L9
- Gunn & Gott (1972) Gunn, J. E. & Gott, III, J. R. 1972, ApJ, 176, 1
- Hwang et al. (2010) Hwang, H. S., Elbaz, D., Lee, J. C., et al. 2010, A&A, 522, A33
- Hwang et al. (2018) Hwang, J.-S., Park, C., Banerjee, A., & Hwang, H. S. 2018, ApJ, 856, 160
- Iodice et al. (2016) Iodice, E., Capaccioli, M., Grado, A., et al. 2016, ApJ, 820, 42
- Iodice et al. (2019a) Iodice, E., Sarzi, M., Bittner, A., Coccato, L., & et al. 2019a, A&A, submitted
- Iodice et al. (2017a) Iodice, E., Spavone, M., Cantiello, M., et al. 2017a, ApJ, 851, 75
- Iodice et al. (2017b) Iodice, E., Spavone, M., Capaccioli, M., et al. 2017b, ApJ, 839, 21
- Iodice et al. (2019b) Iodice, E., Spavone, M., Capaccioli, M., et al. 2019b, A&A, 623, A1
- Jedrzejewski (1987) Jedrzejewski, R. I. 1987, MNRAS, 226, 747
- Jordán et al. (2007) Jordán, A., Blakeslee, J. P., Côté, P., et al. 2007, ApJS, 169, 213
- Knierman et al. (2012) Knierman, K., Knezek, P. M., Scowen, P., Jansen, R. A., & Wehner, E. 2012, ApJ, 749, L1
- Kregel & van der Kruit (2004) Kregel, M. & van der Kruit, P. C. 2004, MNRAS, 355, 143
- Kuijken (2011) Kuijken, K. 2011, The Messenger, 146, 8
- Laine et al. (2016) Laine, J., Laurikainen, E., & Salo, H. 2016, A&A, 596, A25
- Laine et al. (2014) Laine, J., Laurikainen, E., Salo, H., et al. 2014, MNRAS, 441, 1992
- Larson (1976) Larson, R. B. 1976, MNRAS, 176, 31
- Larson et al. (1980) Larson, R. B., Tinsley, B. M., & Caldwell, C. N. 1980, ApJ, 237, 692
- Lavery & Henry (1988) Lavery, R. J. & Henry, J. P. 1988, ApJ, 330, 596
- Lee-Waddell et al. (2018) Lee-Waddell, K., Serra, P., Koribalski, B., et al. 2018, MNRAS, 474, 1108
- Lena et al. (2015) Lena, D., Robinson, A., Storchi-Bergman, T., et al. 2015, ApJ, 806, 84
- Lin & Shu (1964) Lin, C. C. & Shu, F. H. 1964, ApJ, 140, 646
- Lucy (1974) Lucy, L. B. 1974, AJ, 79, 745
- Martin & Kennicutt (2001) Martin, C. L. & Kennicutt, Jr., R. C. 2001, ApJ, 555, 301
- Martín-Navarro et al. (2012) Martín-Navarro, I., Bakos, J., Trujillo, I., et al. 2012, MNRAS, 427, 1102
- Martínez-Serrano et al. (2009) Martínez-Serrano, F. J., Serna, A., Doménech-Moral, M., & Domínguez-Tenreiro, R. 2009, ApJ, 705, L133
- Mastropietro et al. (2005) Mastropietro, C., Moore, B., Mayer, L., et al. 2005, MNRAS, 364, 607
- Matthews & Gallagher (1997) Matthews, L. D. & Gallagher, III, J. S. 1997, AJ, 114, 1899
- Moore et al. (1996) Moore, B., Katz, N., Lake, G., Dressler, A., & Oemler, A. 1996, Nature, 379, 613
- Moore et al. (1998) Moore, B., Lake, G., & Katz, N. 1998, ApJ, 495, 139
- Muñoz-Mateos et al. (2013) Muñoz-Mateos, J. C., Sheth, K., Gil de Paz, A., et al. 2013, ApJ, 771, 59
- Paolillo et al. (2002) Paolillo, M., Fabbiano, G., Peres, G., & Kim, D.-W. 2002, ApJ, 565, 883
- Peng et al. (2010) Peng, C. Y., Ho, L. C., Impey, C. D., & Rix, H.-W. 2010, AJ, 139, 2097
- Peters et al. (2017) Peters, S. P. C., van der Kruit, P. C., Knapen, J. H., et al. 2017, MNRAS, 470, 427
- Pohlen & Trujillo (2006) Pohlen, M. & Trujillo, I. 2006, A&A, 454, 759
- Pota et al. (2018) Pota, V., Napolitano, N. R., Hilker, M., et al. 2018, MNRAS, 481, 1744
- Pranger et al. (2017) Pranger, F., Trujillo, I., Kelvin, L. S., & Cebrián, M. 2017, MNRAS, 467, 2127
- Rhee et al. (2017) Rhee, J., Smith, R., Choi, H., et al. 2017, ApJ, 843, 128
- Richardson (1972) Richardson, W. H. 1972, Journal of the Optical Society of America (1917-1983), 62, 55
- Rodríguez-Ardila et al. (2017) Rodríguez-Ardila, A., Prieto, M. A., Mazzalay, X., et al. 2017, MNRAS, 470, 2845
- Roediger et al. (2012) Roediger, J. C., Courteau, S., Sánchez-Blázquez, P., & McDonald, M. 2012, ApJ, 758, 41
- Roškar et al. (2008) Roškar, R., Debattista, V. P., Quinn, T. R., Stinson, G. S., & Wadsley, J. 2008, ApJ, 684, L79
- Salo et al. (2015) Salo, H., Laurikainen, E., Laine, J., et al. 2015, ApJS, 219, 4
- Sánchez-Blázquez et al. (2009) Sánchez-Blázquez, P., Courty, S., Gibson, B. K., & Brook, C. B. 2009, MNRAS, 398, 591
- Sarzi et al. (2018) Sarzi, M., Iodice, E., Coccato, L., et al. 2018, A&A, in press
- Scharf et al. (2005) Scharf, C. A., Zurek, D. R., & Bureau, M. 2005, ApJ, 633, 154
- Schaye (2004) Schaye, J. 2004, ApJ, 609, 667
- Schipani et al. (2012) Schipani, P., Noethe, L., Arcidiacono, C., et al. 2012, Journal of the Optical Society of America A, 29, 1359
- Schlegel et al. (1998) Schlegel, D. J., Finkbeiner, D. P., & Davis, M. 1998, ApJ, 500, 525
- Schröder (1995) Schröder, A. 1995, PhD thesis, , Universität Basel., (1995)
- Schröder et al. (2001) Schröder, A., Drinkwater, M. J., & Richter, O.-G. 2001, A&A, 376, 98
- Spavone et al. (2017) Spavone, M., Capaccioli, M., Napolitano, N. R., et al. 2017, A&A, 603, A38
- Spiniello et al. (2018) Spiniello, C., Napolitano, N. R., Arnaboldi, M., et al. 2018, MNRAS, 477, 1880
- Steinhauser et al. (2016) Steinhauser, D., Schindler, S., & Springel, V. 2016, A&A, 591, A51
- Taylor et al. (2011) Taylor, E. N., Hopkins, A. M., Baldry, I. K., et al. 2011, MNRAS, 418, 1587
- Trujillo et al. (2002) Trujillo, I., Aguerri, J. A. L., Gutiérrez, C. M., Caon, N., & Cepa, J. 2002, ApJ, 573, L9
- Tully et al. (2009) Tully, R. B., Rizzi, L., Shaya, E. J., et al. 2009, AJ, 138, 323
- Valentijn et al. (2007) Valentijn, E. A., McFarland, J. P., Snigula, J., et al. 2007, in Astronomical Society of the Pacific Conference Series, Vol. 376, Astronomical Data Analysis Software and Systems XVI, ed. R. A. Shaw, F. Hill, & D. J. Bell, 491
- van der Kruit (1979) van der Kruit, P. C. 1979, A&AS, 38, 15
- van der Kruit & Searle (1981a) van der Kruit, P. C. & Searle, L. 1981a, A&A, 95, 105
- van der Kruit & Searle (1981b) van der Kruit, P. C. & Searle, L. 1981b, A&A, 95, 116
- Venhola et al. (2018) Venhola, A., Peletier, R., Laurikainen, E., et al. 2018, A&A, 620, A165
- Venhola et al. (2017) Venhola, A., Peletier, R., Laurikainen, E., et al. 2017, A&A, 608, A142
- Vijayaraghavan & Ricker (2013) Vijayaraghavan, R. & Ricker, P. M. 2013, MNRAS, 435, 2713
- Vollmer (2003) Vollmer, B. 2003, A&A, 398, 525
- Watkins et al. (2019) Watkins, A. E., Laine, J., Comerón, S., Janz, J., & Salo, H. 2019, arXiv e-prints
- Whitmore (1993) Whitmore, B. C. 1993, in Evolution of Galaxies and their Environment, ed. J. M. Shull & H. A. Thronson
- Younger et al. (2007) Younger, J. D., Cox, T. J., Seth, A. C., & Hernquist, L. 2007, ApJ, 670, 269
- Zabel et al. (2019) Zabel, N., Davis, T. A., Smith, M. W. L., et al. 2019, MNRAS, 483, 2251
Appendix A The Sample: Late Type Galaxies inside the virial radius
In this section, we give a detailed description of the main properties of each galaxy analysed in this paper.
A.1 FCC113
FCC113, is an ScdIII pec, was classified as a star forming dwarf galaxy by Drinkwater et al. (2001), but is a late type lopsided spiral galaxy with effective radius 1.98 kpc. Unlike the other regular late type galaxies studied, as part of this paper, FCC113 is located near the low-density region of galaxies in the virial radius of the Fornax cluster, at a projected distance of 1.209 deg. This galaxy, following on similar substructures, explained in the Sect. A.8. Drinkwater et al. (2001) point out to the ongoing star formation of this galaxy, which can be seen in the bright knots irregularly distributed in the northern regions of this galaxy. It appears to look like the galaxy is being pulled into the cluster centre, in the southern direction.
A.2 FCC115
FCC115, an Sdm (edge on) galaxy, is the faintest galaxy in our sample. Due to the edge-on characteristics of this galaxy, it is difficult to discern the presence of spiral arms. It is located at a projected distance = 1.05 deg from the cluster centre, in the low-density regime. From image 12, the SB image shows a dust lane in the centre, which is presumably the spiral arm (see Appendix. 12). This galaxy has a Type II profile, with a break radius of 1.47 kpc. The outer disc is bluer with the SB of 23.52 at the break radius.
A.3 FCC121
Also known as the great barred spiral galaxy NGC 1365 has been studied in the past mostly concerning the supermassive black hole present in its core. The bar of this galaxy has dust and star formation that extends to the end of the spiral arms. With an effective radius of 12.74 kpc, this galaxy is located at a projected distance = 1.06 deg from the cluster centre. It has a Type III profile, with a break radius of 18.46 kpc, and redder outer disc.
A.4 FCC176
FCC176, also known as NGC 1369 is an SBa galaxy, consists of a bar and an outer ring formed by its spiral arms. It is located in the X-ray regions of NGC 1399 in the central cluster. The effective radius of this galaxy is 2.68 kpc. It is at a projected distance = 0.82 deg from the cluster centre. The asymmetric halo (in the SE direction) and the outer ring which show intrinsic characteristics in the disc, suggest that this is an early type spiral galaxy (Elmegreen et al., 1992; Mastropietro et al., 2005), where the star formation in the outer regions appears to be stalled. This galaxy has a Type II profile with a of 3.73 kpc. The outer disc is bluer with average colour of 0.76 0.2 mag (refer Tab. 6).The break radius is beyond the ring (OLR) of the galaxy at a SB of 22.20 .
A.5 FCC179
FCC179, also known as NGC 1386 is an Sa, Seyfert 2 galaxy, located at a projected distance = 0.55 deg from the central galaxy, in the X ray regions of the Fornax cluster. It has an effective radius of 2.68 kpc. This galaxy has been a topic of interest concerning its outflows (e.g. Rodríguez-Ardila et al., 2017) and gas kinematics (e.g. Lena et al., 2015). Being in the hot, high-density regime of the Fornax cluster, the spiral arms of this galaxy are concentrated in its central regions of 1 arcmin diameter. These spiral arms contains a lot of dust, which can be seen in its colour map at a level of 1.1 mag (see Appendix. 15. This galaxy has a Type II profile, with a break radius of 7.01 kpc, that is 2.5 times the effective radius in -band.
A.6 FCC263
FCC263 is classified as a SBcd-III, barred spiral, located at = 0.79 deg from the cluster centre. With an effective radius of 2.06 kpc, this galaxy is detected in HI and CO(1-0), showing signs of ongoing star formation in its spiral arms (see Zabel et al., 2019; Schröder et al., 2001). This galaxy has a Type III profile, with a break radius of 2.32 kpc. Zabel et al. (2019) point out to the irregular distribution of molecular gas, suggesting the possibility of tidal encounters or past minor mergers. Though we include this in our morphological segregation of regular spiral galaxies at smaller projected distance to the cluster centre, it is not clear if this galaxy is indeed within the X-ray halo or farther away, yet appears to have its spiral arms stripped. The outer isophotes are not aligned with the inner isophotes, and the galaxy is more thickened along the direction pointing towards the cluster centre.
A.7 FCC267
FCC267, a Sm(IV) galaxy, is located at farthest projected distance (1.73 deg) from the cluster centre. This galaxy’s spiral arms are concentrated in the innermost regions with double nucleus. It has an effective radius of 1.92 kpc. This galaxy has a Type III profile with a break radius of 1.43 kpc.
A.8 FCC285
FCC 285, also known as NGC 1437A , is an Sd-III galaxy. In the SB image, the galaxy’s extended spiral arms are marked. This galaxy is detected in HI (Schröder et al., 2001) and studied in FIR (Fuller et al., 2014) and is located at = 1.17 deg from the cluster centre, with an effective radius of 4.90 kpc. According to the De Vaucouleurs system of classification, Sd galaxies are usually diffuse, with a faint central bulge. These galaxies also have irregular star forming regions or star clusters spread out (see Appendix 18). NGC 1437A has a similar arrow-shaped optical appearance as NGC 1427A and seems to be travelling in a southeast direction (based on the location of its own star-forming region) that is parallel with the orientation of NGC 1427A. The tail shows low SB regions, and the top part is elongated with the south, moving in opposite directions. NGC 1437A has about one third the HI mass as NGC 1427A and the velocity difference between these dIrrs is 1150 km s-1, which is three times higher than the velocity dispersion of the Fornax cluster (Lee-Waddell et al., 2018) with no indication of recent tidal interactions.
A.9 FCC290
FCC290, also known as NGC 1436 is an ScII galaxy at a projected distance = 1.05 deg from the cluster centre, located within the X-ray regions of the central galaxy, with an effective radius of 4.64 kpc. The inner spiral arms have about a size of 2 arcmin consisting of dust lanes. As the spiral arms are concentrated in the central regions (within 1Re) of the galaxy, with a regular shape of disc in the outer regions, this galaxy appears to be moving to an S0 phase in its morphological evolution. This galaxy has a Type II profile with a break radius of 4.54 kpc. CO(1-0) detection (Zabel et al., 2019) shows presence of molecular gas in its spiral arms, within its break radius (see Appendix. 19).
A.10 FCC302
FCC302 is a diffuse, nearly edge-on galaxy with fairly uniform surface brightness, and possibly an irregular galaxy (Matthews & Gallagher, 1997), located at a projected distance = 1.305 deg. It has an effective radius of 2.76 kpc and a companion galaxy close to symmetric centre of this galaxy (NED).
A.11 FCC306
FCC306, is a SBmIII, classified as a dwarf galaxy by Drinkwater et al. (2001). It is the smallest galaxy of the sample we present, with an effective radius of 0.94 kpc. Though past research says that there is no evidence of substructure because of its small velocity dispersion in the Fornax cluster Drinkwater et al. (2001), we speculate that there are spiral arms at a SB level of 29 mag in NW and SE directions marked in the contours of the SB image (see Appendix 22). FCC306 lies in the beam of FCC308 and has been confirmed in a FLAIR observation with v = 915 km s-1 using emission lines (Schröder, 1995).
A.12 FCC308
FCC308, also known as NGC 1437b, is an Sd galaxy, at a projected distance = 0.3 deg to the bright dwarf galaxy FCC306, with an effective radius of 4.46 kpc. The structure of this galaxy is similar to that of FCC312. Sd galaxies are usually edge-on, with ill-defined spiral arms (Buta, 2011). One can say that the uneven distribution of star forming regions can be accounted for the spiral arms loosely wound, as marked in the colour map of this galaxy (see Appendix. 21). There is a lot of dust present in the central regions of this galaxy, which can be seen in the colour map as well as the colour profile, where the dust extinction can be recognised out in the regions between 2-20 arcsec of the central galaxy. Flares on the outskirts of the disc is clear because of the deep images of FDS (see Appendix 21).
A.13 FCC312
FCC312, is an Scd galaxy, with high stellar mass, detected in HI (Schröder et al., 2001) and CO(1-0) (Zabel et al., 2019), and studied in FIR (250 m, Fuller et al. 2014). It has an effective radius of 11.30 kpc and has been a topic of interest in the past, concerning its structure, molecular clouds and regions of star formation. The central regions show the traces of ongoing star formation, which can be seen in the colour profile. It is located at a projected distance = 1.59 deg from the cluster centre. Being further away from the high-density regions of the central cluster, this galaxy shows the most extended disc (boxiness) which is visible in the azimuthally averaged SB images shown in Appendix 24. It has a Type III profile with a break radius of 6.91 kpc, around the same regions of star formation (see Appendix 24). The boxy shape of edge-on spiral galaxies is said to be related to the vertical distribution of light (Bureau & Freeman, 1999). Although past research (e.g Bureau & Freeman, 1999) suggest that the presence of a boxy or peanut shaped bulge is due to the presence of a bar, this galaxy does not display a boxy bulge, but rather a boxy disc, with regions of high star formation surrounding the centre. The dust reddening of this galaxy makes the colour magnitude appear to be redder than bluer, and is clearly visible in the colour map of this galaxy (see Appendix 24). The extended tail of the disc is at 25.6 , which can be a sign of a recent minor merger event or due to instabilities caused in the disc.
Appendix B The Sample: Images and profiles
In this section, we show the -band VST images of LTGs inside the virial radius of the Fornax cluster, surface brightness profile in terms of effective radius, colour maps and () deconvolved (black) and original profiles (grey). For 10 of the galaxies with disc-breaks in our sample, we also mark the break radius on the -band images in surface brightness (black dashed lines) and () colour profiles (red dashed lines). For 6 galaxies that were detected in CO(1-0), we plot the CO contours(Zabel et al., 2019) in white.
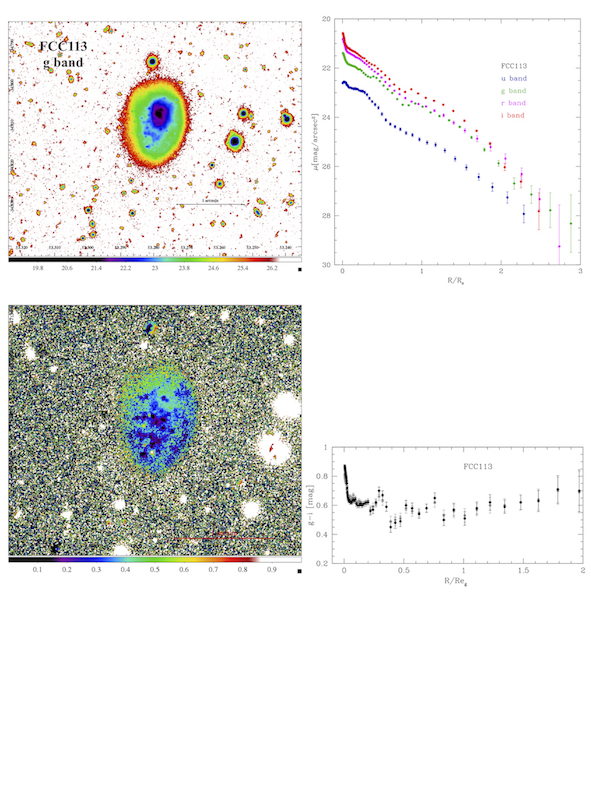
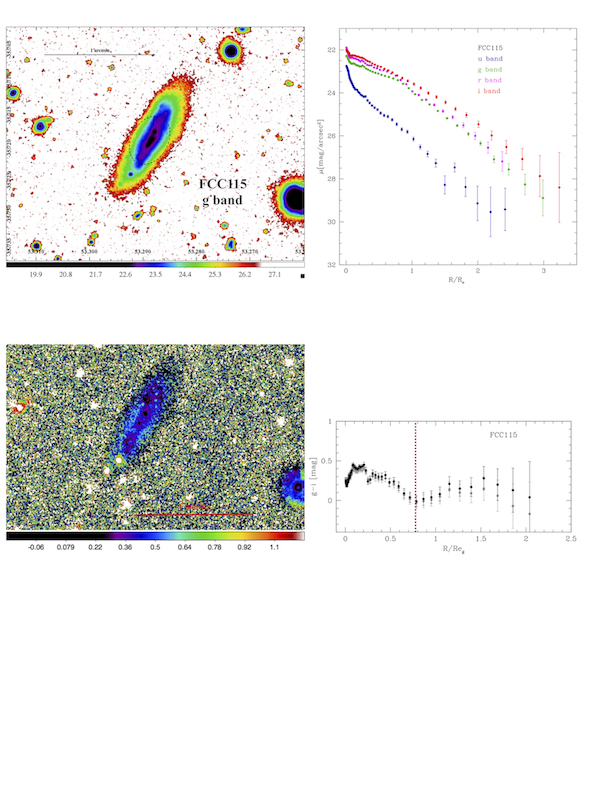
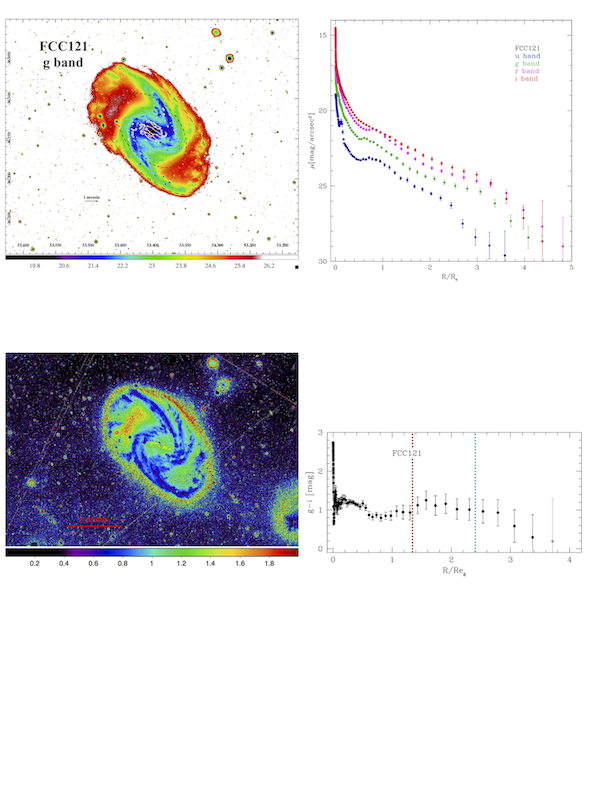
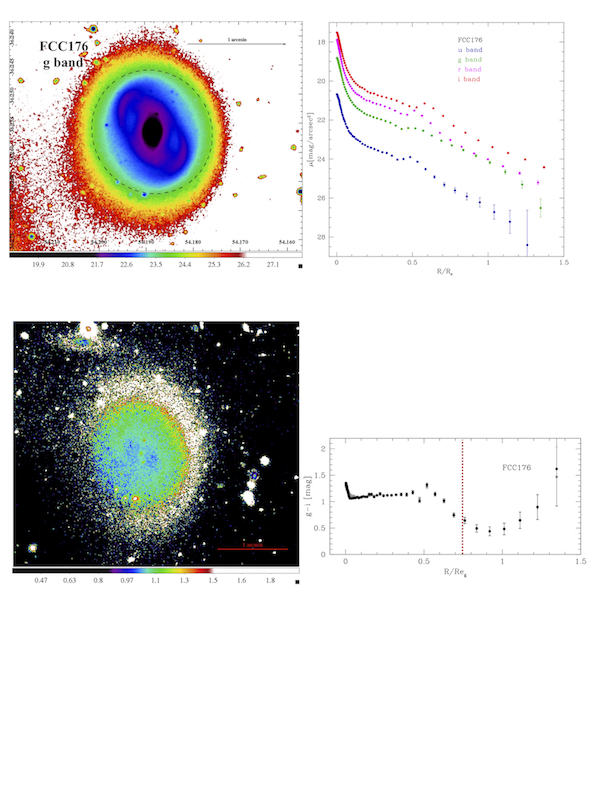

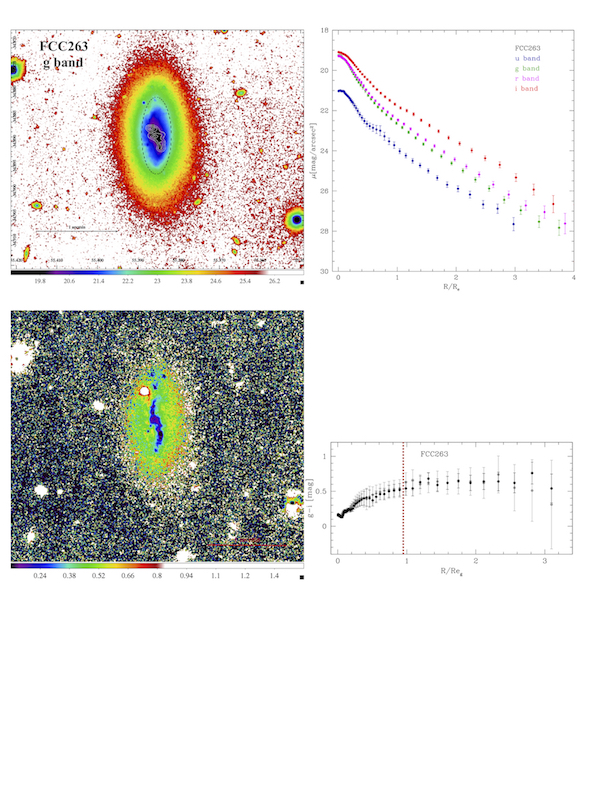
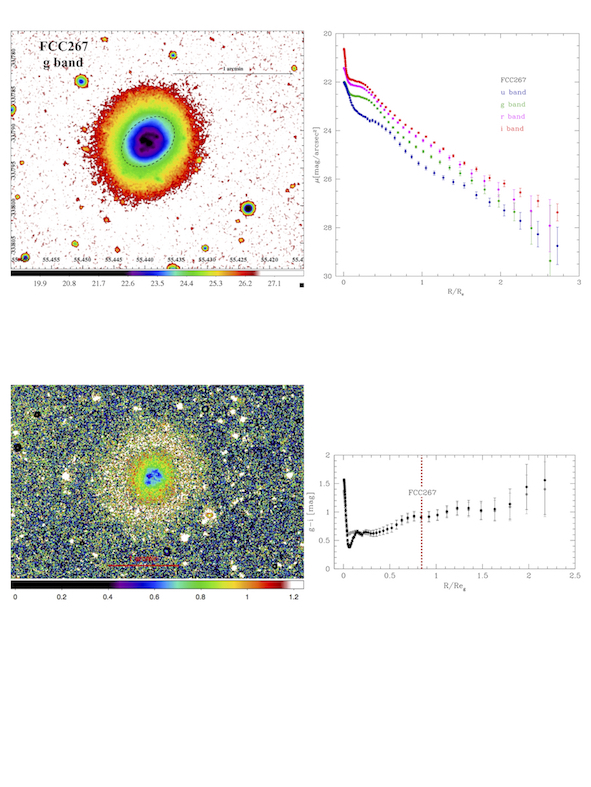
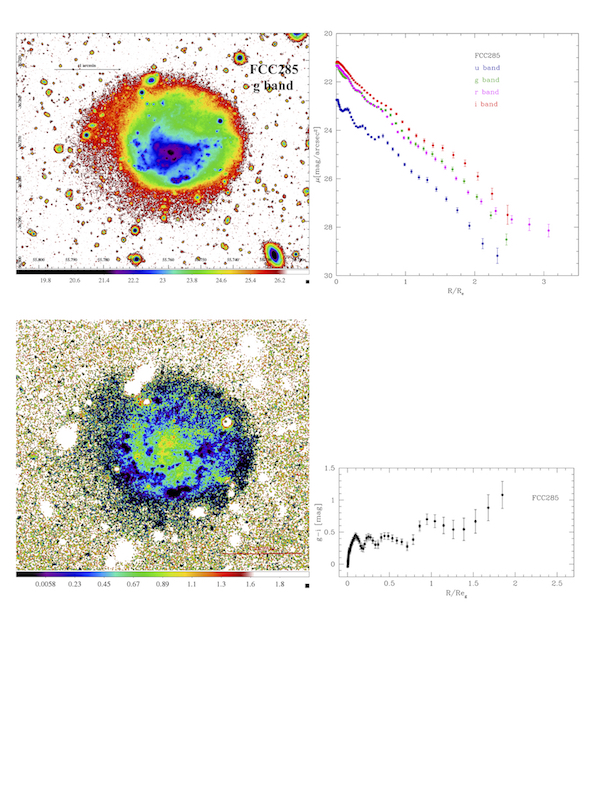
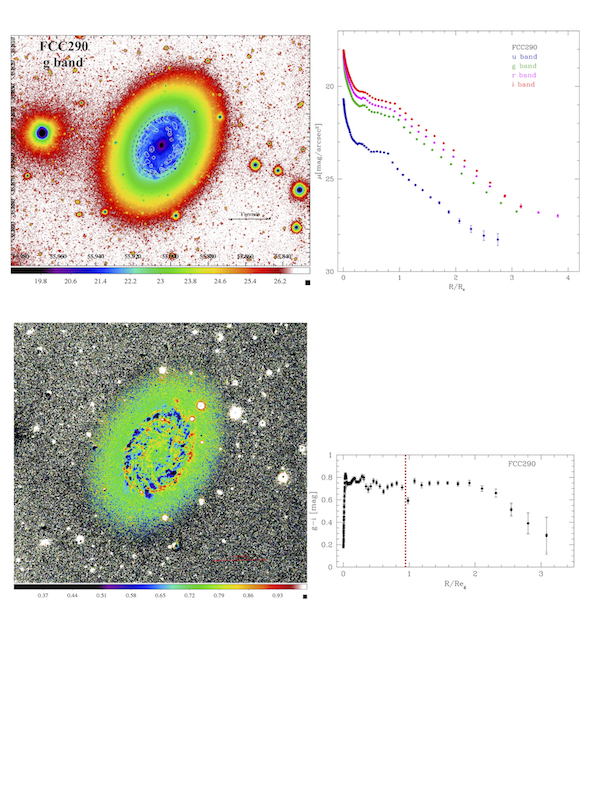
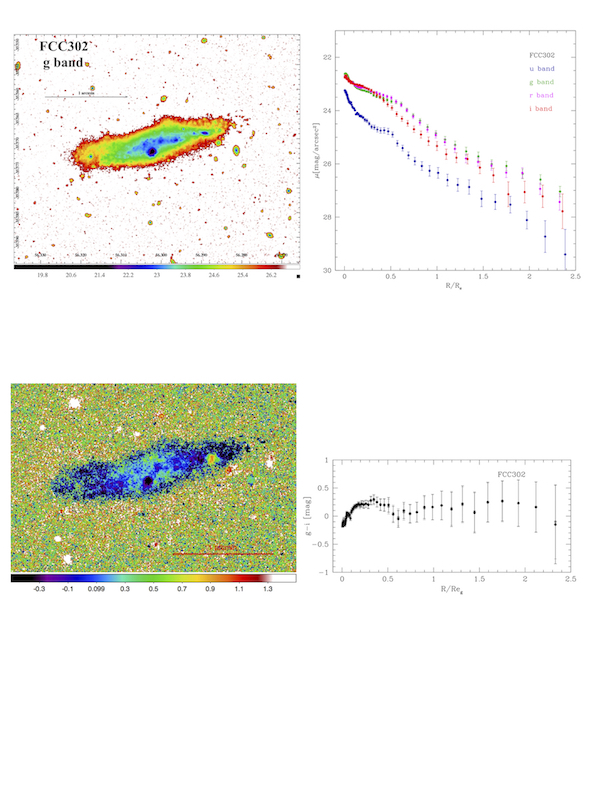
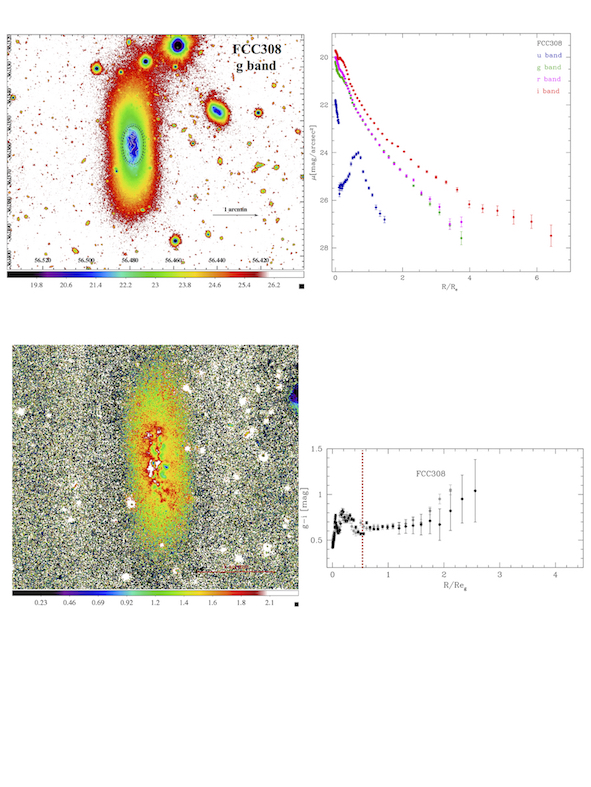
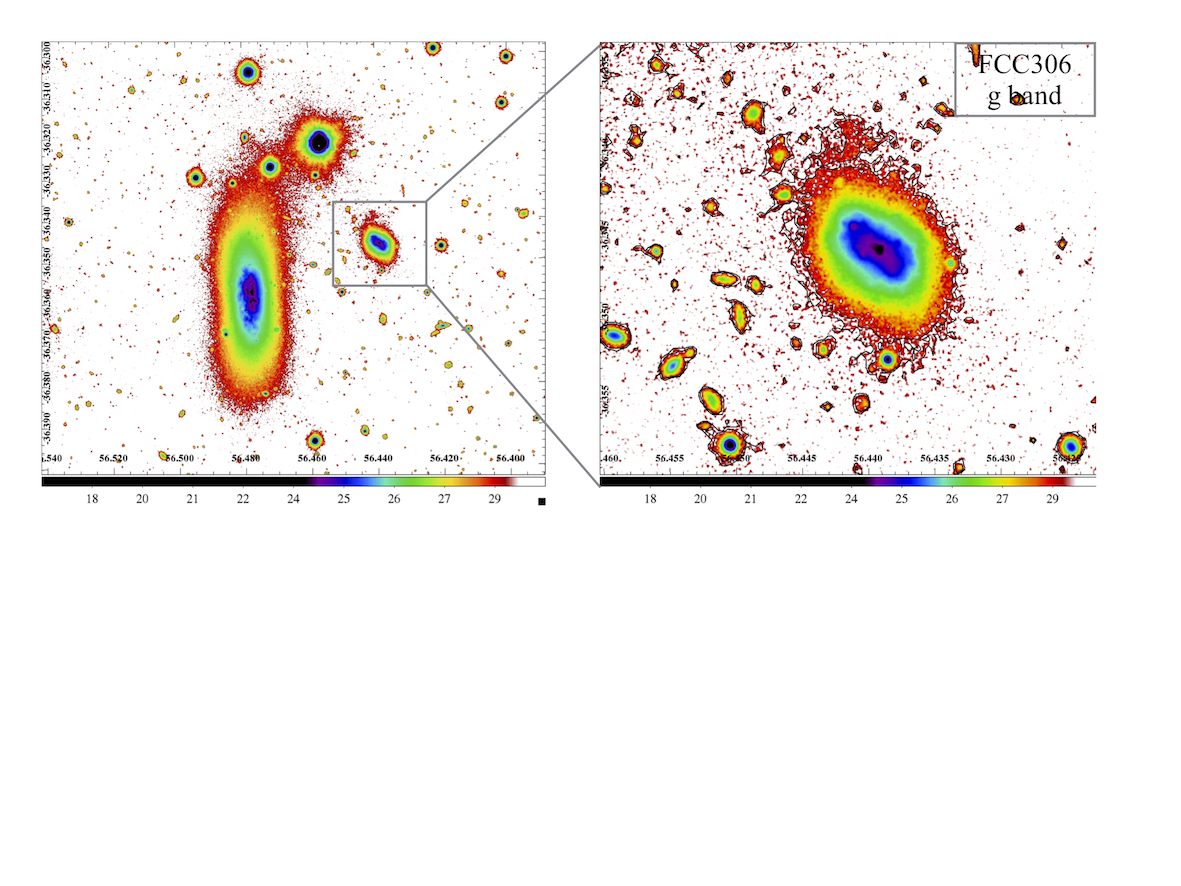
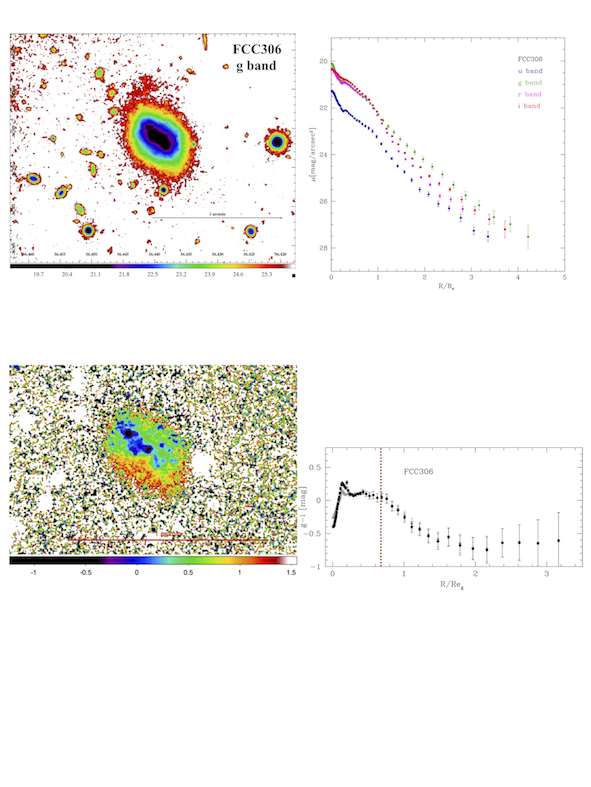
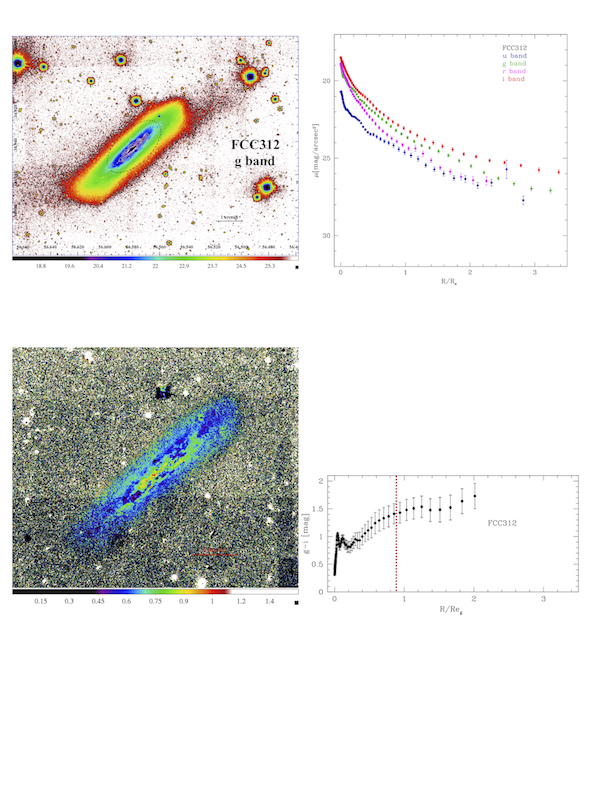
Appendix C Methodologies
Parameters of the best fit of LTGs with disc breaks are given in Tab. 7 with an example (FCC179) of the best fits produced by the algorithm shown in Fig. 25, 26, 27.
| object | ||||
|---|---|---|---|---|
| slope | slope | |||
| (1) | (2) | (3) | ||
| FCC115 | 0.09 0.03 | 0.02 | 0.11 0.07 | 0.02 |
| FCC121 | 0.02 0.11 | 0.02 | 0.10 0.18 | 0.07 |
| FCC176 | 0.04 0.06 | 0.09 | 0.06 0.08 | 0.05 |
| FCC179 | 0.04 0.07 | 0.08 | 0.08 0.70 | 0.23 |
| FCC263 | 0.12 0.14 | 0.08 | 0.07 0.02 | 0.02 |
| FCC267 | 0.17 0.03 | 0.02 | 0.91 0.03 | 0.02 |
| FCC290 | 0.03 0.09 | 0.07 | 0.05 0.10 | 0.08 |
| FCC306 | 0.20 0.01 | 0.01 | 0.27 0.07 | 0.08 |
| FCC308 | 0.10 0.05 | 0.05 | 0.05 0.08 | 0.11 |
| FCC312 | 0.05 0.04 | 0.04 | 0.02 0.14 | 0.06 |
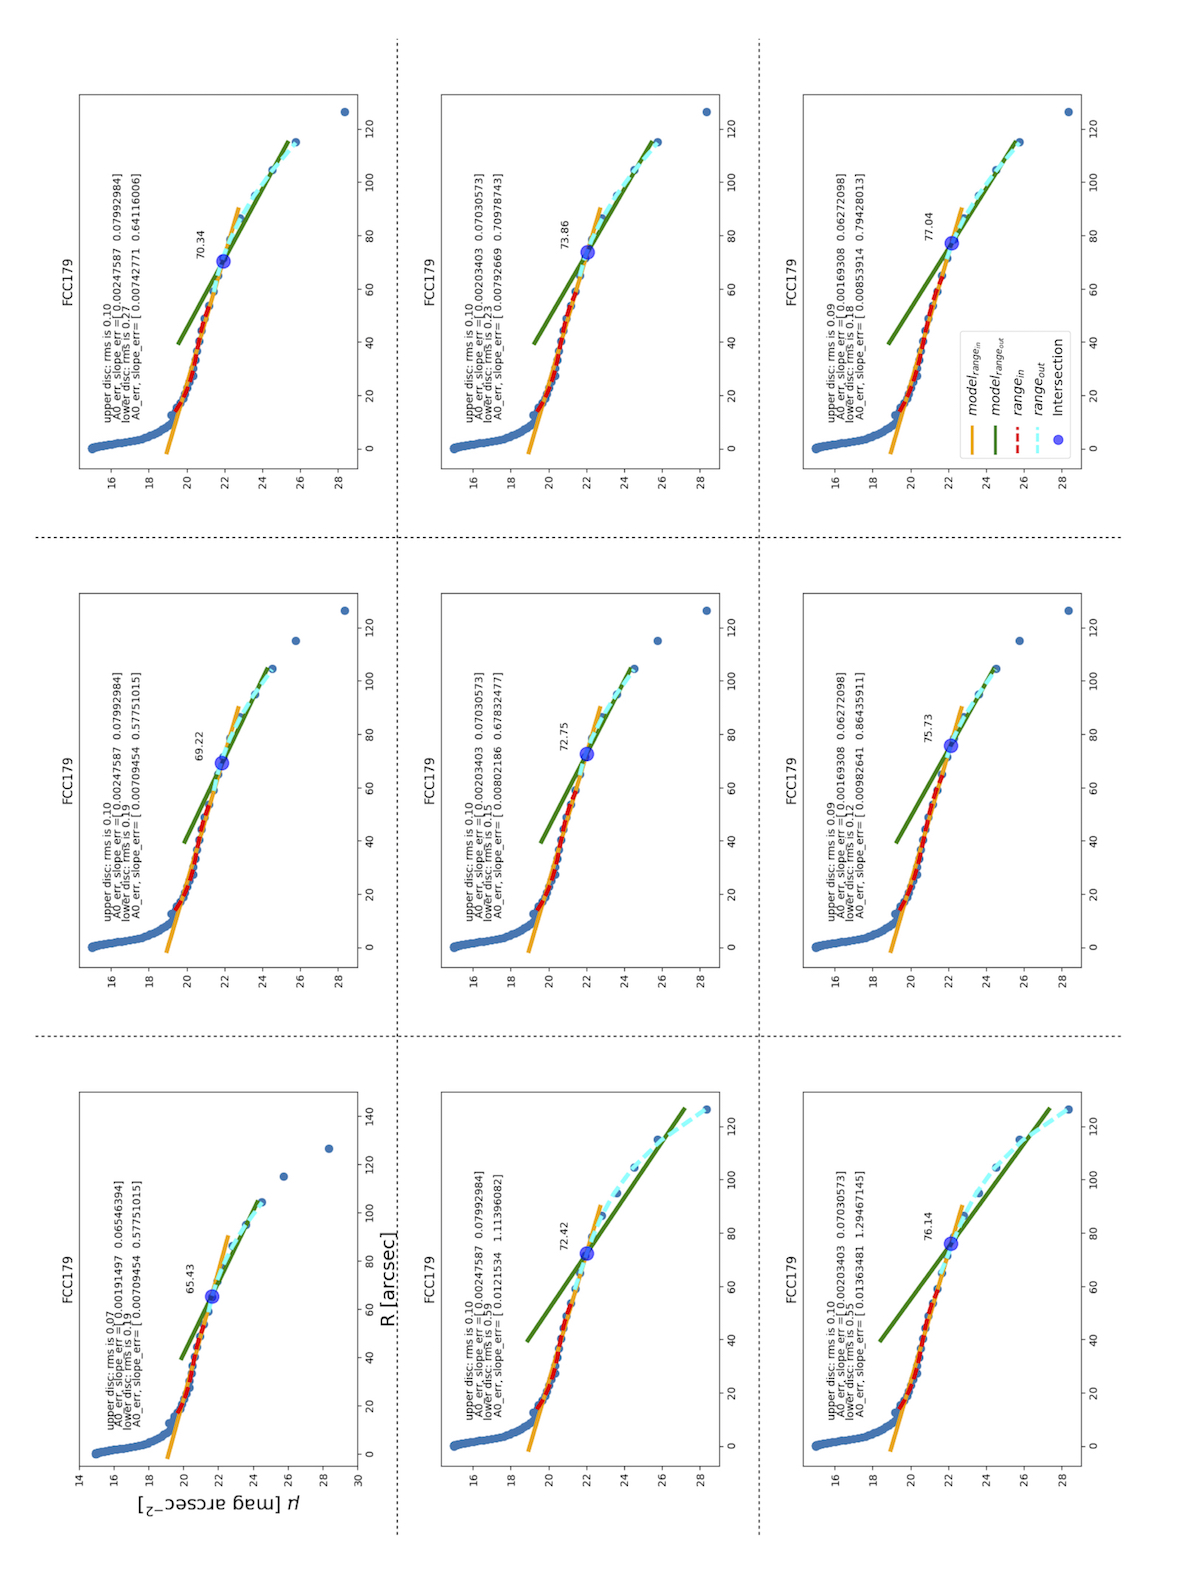
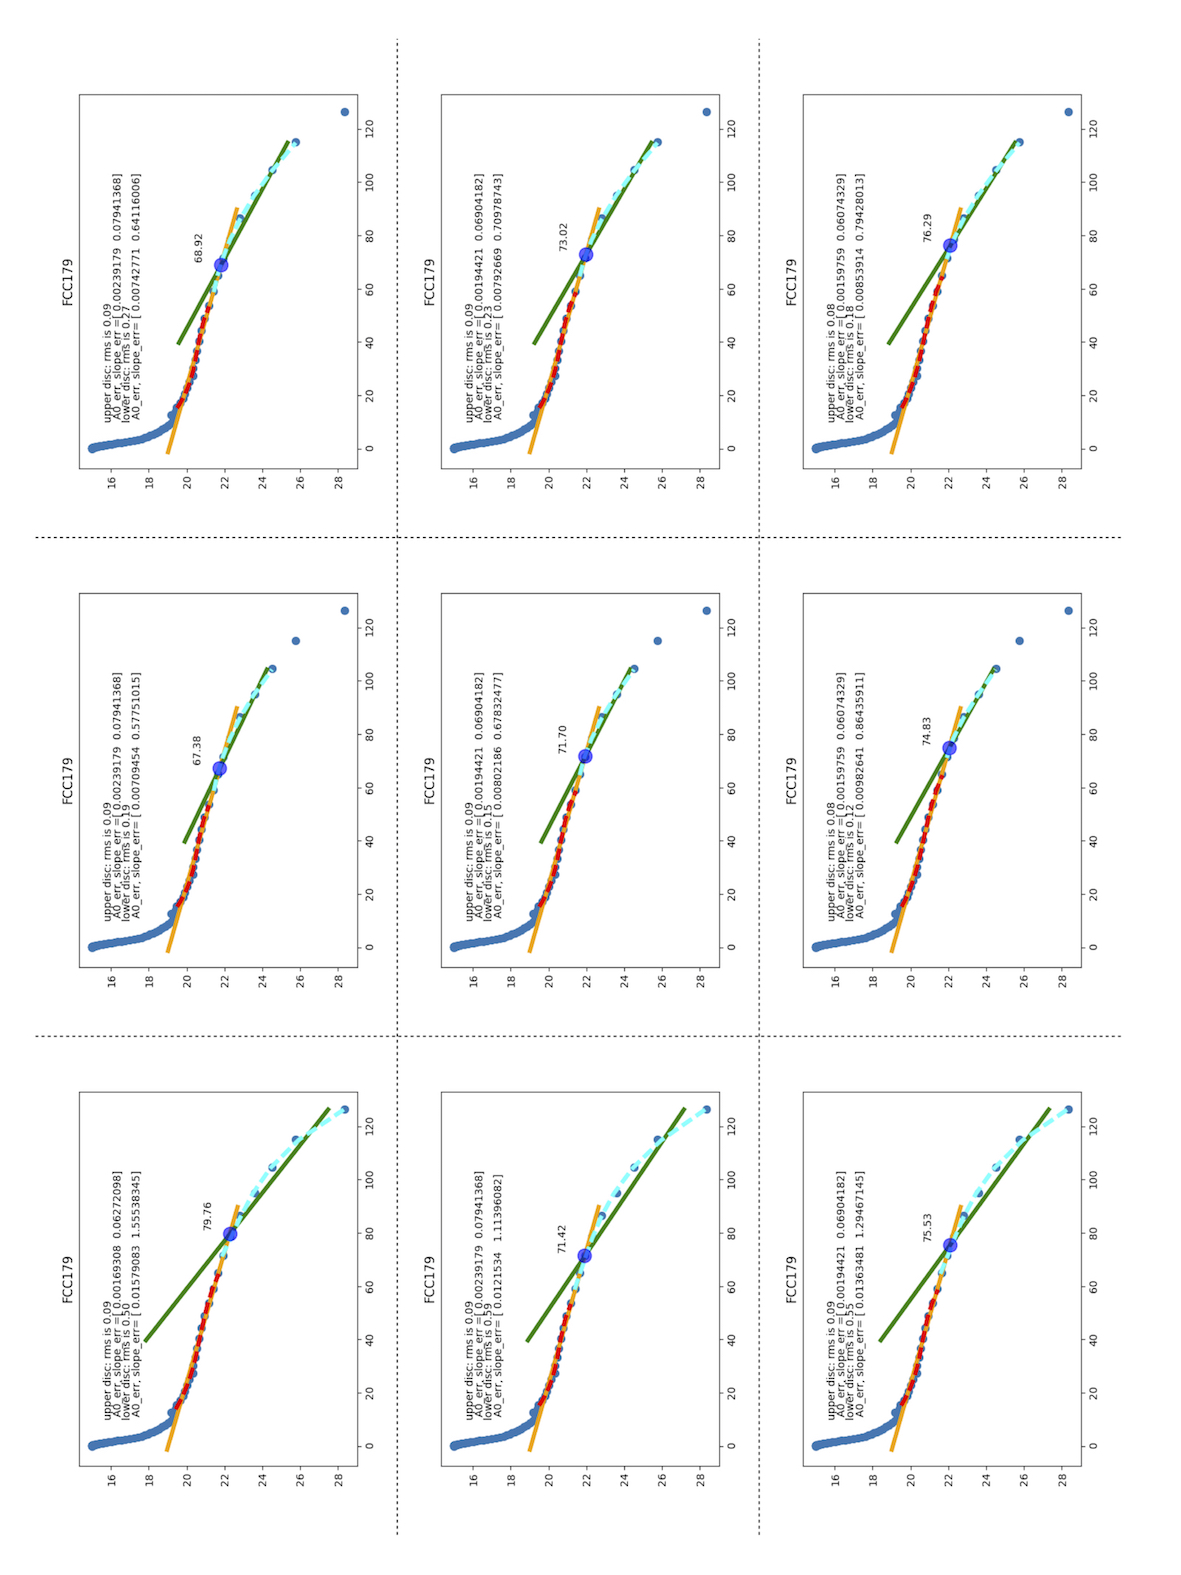
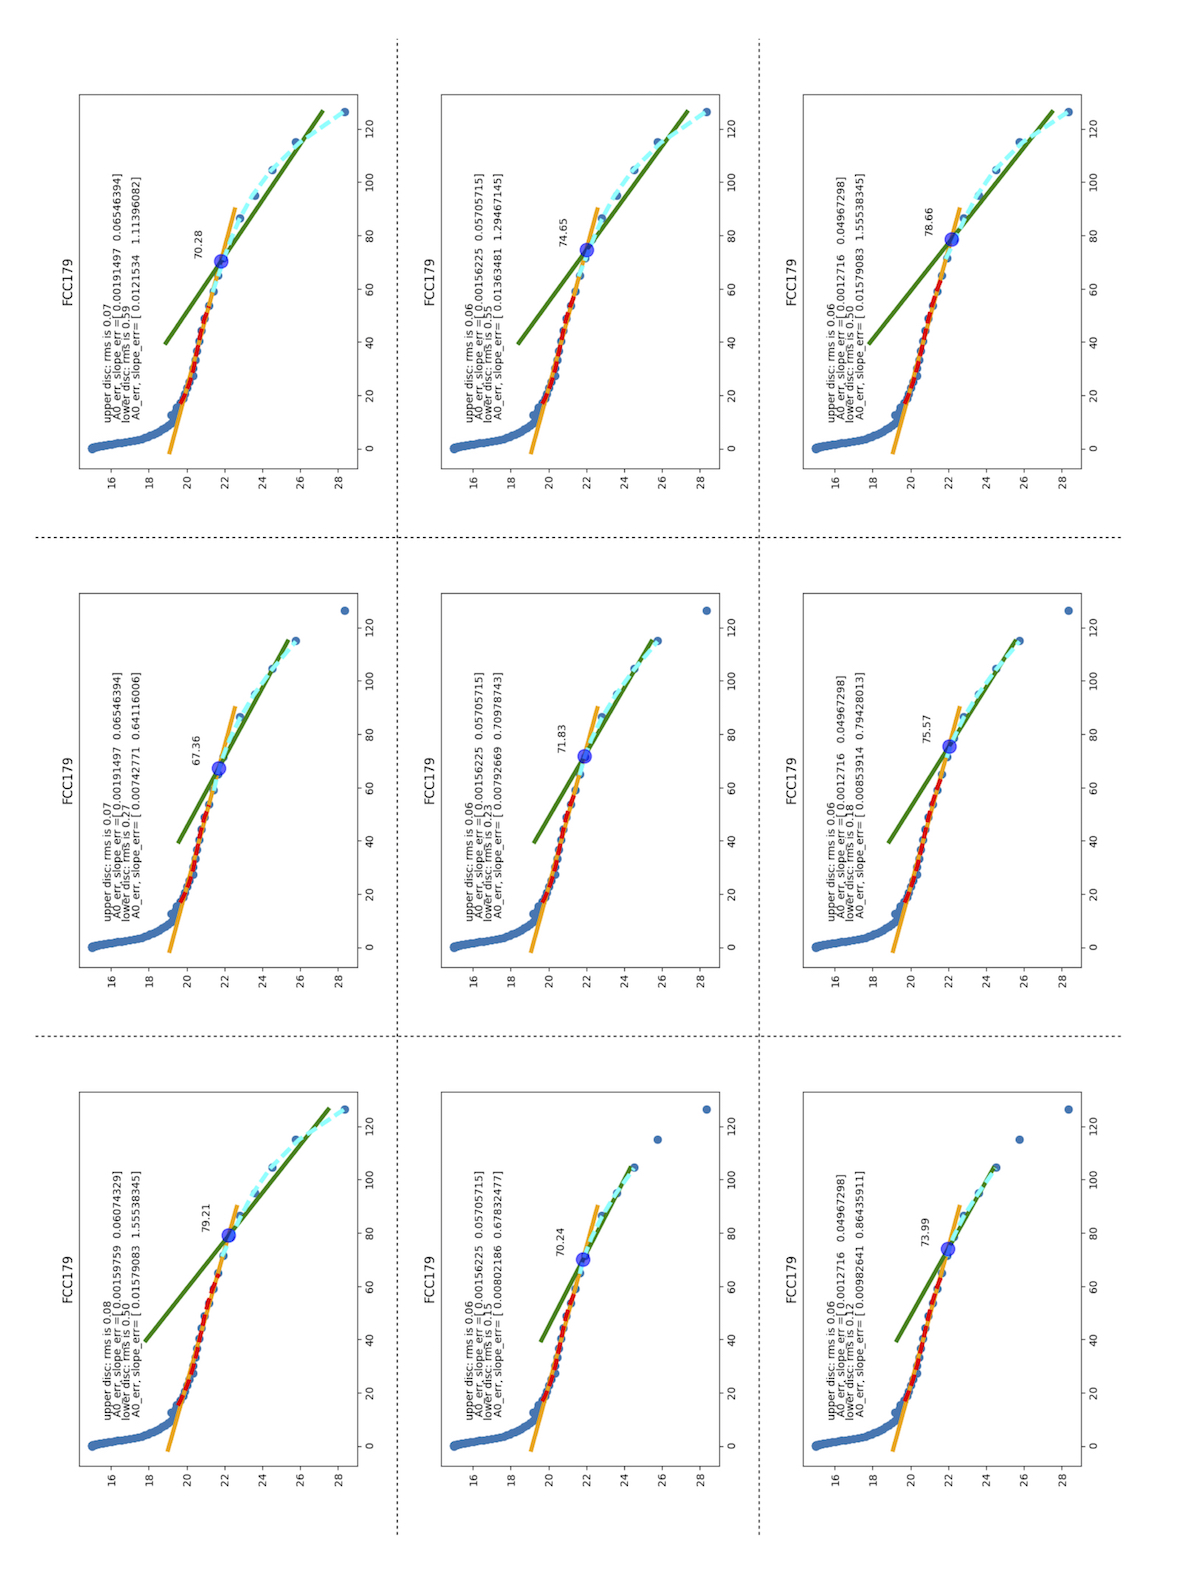
C.1 Reliability test
In order to test the reliability of the method of deconvolution we use, we adopt the method illustrated by Borlaff et al. (2017, hereafter B+17).
According to B+17, images are deconvolved using the following operation:
| (2) |
| (3) |
Where is the 2D model (with best-fitted parameters) convolved with the adopted PSF, obtained from GALFIT3.0 (Peng et al., 2010), and is the 2D model obtained using the best fit parameters of the galaxy from , i.e. the model of the galaxy without PSF convolution.
We apply this method to three of the galaxies in our sample: FCC179 and FCC290 (Type II with a second break) and FCC263 (Type III). For each of these galaxies, we use sersic+single exponential disc models to derive GALFIT3.0 models with PSF convolution. We fix the parameters obtained from their to extract another model, i.e., without PSF convolution. We then deconvolve the images using the above method. We extract the surface brightness profiles using ellipse and (see Sect. 3) compare it with the method (LR algorithm) given by SP+17 (see Fig. 28). We derive the break radius from the aforementioned radial profiles. From Fig. 28, it is clear that our method of deconvolution (LR algorithm) is consistent with the above method, and that deconvolution does not affect the location of the primary break radius (within the ) as well as the break-type, as the break radius we estimate is within the regions unaffected by the PSF. In the case of FCC179 and FCC290, a possible secondary break radius occurs in the regions that are affected by the PSF, where the contribution of the scattered light is accounted for with deconvolution.