Segmented Composite Optical Parametric Amplification
Abstract
We propose a novel optical parametric amplification scheme which combines quasi-phase-matching with a composite pulse approach that involves crystal segments of specific lengths. The presented scheme highly increases the robustness of the frequency conversion against variations of the nonlinear coupling and of the pump, idler or signal wavelengths and has therefore the potential to enhance high amplification and broadband operation. Simulations examples applied to LiNbO3 are given.
I Introduction
Some optical applications require short optical pulses with large peak power, which may be obtained with the help of optical parametric amplifiers (OPAs) Joosen ; Gale1995 ; Gale1998 ; Schmidt that are among the most useful nonlinear optical devices. Optical parametric amplification consists in the nonlinear interaction of three waves. In this process the two waves at the longer wavelengths, the input signal wave as well as the idler wave, gain power at the expense of the pump wave being at the shortest wavelength. In OPA the main obstacle encountered when short pulses are used is to combine a high signal amplification and a sufficiently broad amplification bandwidth. The latter is limited because material dispersion imposes that, for a given wave interaction configuration, the exact phase-matching condition can be strictly satisfied only for a single set of wavelengths of the three waves. Presently the most common way to achieve the combination of broadband and high amplification is to use chirped quasi-phase-matching Harris ; Charbonneau-Lefort1 ; Charbonneau-Lefort2 ; Phillips2012 ; Phillips2013 ; Moses . Even though chirped quasi-phase-matching approaches have the advantage of being broadband, they require high pump input intensity and/or very long nonlinear crystals. Very high pump intensities have the drawback of a possible damage of the nonlinear crystal when they approach its damage threshold.
In this paper we explore an alternative method to achieve broadband amplification bandwidth together with high amplification. The technique involves a combination of quasi-phase-matching (QPM) gratings together with a segmentation of the crystal that implements the equivalent to the composite pulses approach used in Nuclear Magnetic Resonance (NMR) to prepare given quantum states in a robust way Levitt ; Shaka1985 ; Shaka1987 . The present approach leads to a highly increased robustness of the nonlinear amplification process with respect to both, the phase mismatch (associated to a change of wavelength or of temperature) and the coupling strength. Section 2 gives the general theory while Sect. 3 describes the numerical approach and the simulation results obtained with the best crystal segmentation. Some practical examples are given for the important case of MgO-doped quasi phase-matched LiNbO3. Finally, Sect. 4 summarizes.
II Theory
We start with the simmetrized coupled wave equations for collinear three-wave mixing in the slowly varying envelope approximation Boyd ; Yariv
| (1a) | ||||
| (1b) | ||||
| (1c) | ||||
where is the effective nonlinear coupling coefficient for first-order QPM, is the position along the propagation axis, are the frequencies of the three involved waves and are their refractive indices. Here refer to the signal, idler and pump waves, respectively. The quantity in is the effective second-order susceptibility and is the speed of light in vacuum. The amplitudes in (1) are proportional to the amplitudes of the wave electric fields; is proportional to the number of photons associated to the th wave. It is important to note that Eq. (1) is written in a form that assumes that quasi-phase-matching is implemented and that the quasi-phase matching period is sufficiently short as compared to the interaction length. Therefore the phase mismatch parameter already contains the mismatch compensation term associated to the periodic grating, that is
| (2) |
where is the quasi-phase-matching period, that is the first order local poling period in the case of periodically poled crystals. Obviously, for the central operation wavelengths at which the device is designed one has . At the same time the true phase mismatch , which depends only on the wave-vectors of the three interacting waves, is generally quite far from vanishing. The set of equations (1) could have been written also by using the quantities instead of , however in this case would need to switch its sign after each distance and the term would need to be dropped in the nonlinear coupling coefficient.
Depending upon the initial conditions , different processes can arise: sum frequency generation (SFG), difference frequency generation (DFG) or OPA. Here we consider the OPA case, we assume that and we treat first Eq. (1) in the limit of validity of the undepleted pump approximation ( const). In this limit the set of equations (1) turns into
| (3a) | ||||
| (3b) | ||||
with being a modified coupling coefficient. When the wave vector mismatch and the coupling coefficient are constant then equations (3) possess exact analytic solutions Shen
| (4a) | ||||
| (4b) | ||||
where is a gain coefficient. From the last equations one can easily see that both signal and idler increase exponentially for large and in the case
| (5a) | ||||
| (5b) | ||||
In this work we are interested in an optimization of the signal intensity amplification factor , defined as the ratio of the intensity of the signal wave () taken at distance to its intensity at the entrance of the crystal
| (6) |
The above argumentation in connection with Eq. (5) indicates that, when the phase-matching condition is satisfied (), the OPA process is the most efficient. However this is not entirely true, because the solutions (5) are derived only in the limit of the undepleted pump approximation. If one considers the depleted pump regime, the nonlinear equations (1) have solutions in terms of Jacobi elliptic functions Baumgartner ; Wolfram . These, like trigonometric functions, are periodic functions and thus the energy transfer oscillates back and forth between pump field and signal field. The chirped quasi-phase-matching techniques Harris ; Charbonneau-Lefort1 ; Charbonneau-Lefort2 ; Phillips2012 ; Phillips2013 , in addition to the improvement of the bandwidth, eliminate the problem of back conversion and can be used even in the case of the depleted pump regime.
Here, in analogy with the technique of composite pulses from quantum physics Levitt ; Shaka1985 ; Shaka1987 ; Levitt2 ; Freeman ; Blatt ; Wunderlich ; Torosov ; Schraft , we propose to use segmented composite crystals for OPA. We note that the composite pulse analogy was already used in nonlinear optics but for the sum frequency generation or second harmonic generation (SHG) Genov ; Rangelov ; Erlich . In these cases, in the undepleted pump approximation the differential equations governing the spatial dynamics have a SU(2) symmetry Suchowski1 ; Suchowski2 , which is exactly the same symmetry possessed by quantum systems with two states Torosov ; Schraft . Therefore the mapping between two-state quantum systems and SFG in the undepleted pump regime is complete and one can use the known analytic solutions from quantum physics to find robust solutions in nonlinear optics Genov ; Rangelov ; Erlich . In the case of OPA there is no SU(2) symmetry and it is thus not possible to exploit known composite pulses analytic solutions. Instead, we are going to derive numerically solutions that achieve broadband amplification bandwidth together with high amplification in the depleted pump regime.
| Name | Segment lengths in units of | |
| 3 | 3 | 0.373; 0.594; 0.033 |
| 4 | 4 | 0.303; 0.522; 0.124; 0.051 |
| 6 | 6a | 0.293; 0.258; 0.003; 0.255; 0.124; 0.067 |
| 6 | 6b | 0.168; 0.035; 0.345; 0.023; 0.222; 0.207 |
| 6 | 6c | 0.223; 0.005; 0.404; 0.175; 0.113; 0.080 |
| 8 | 8 | 0.022; 0.064; 0.046; 0.205; 0.270; 0.096; 0.222; 0.075 |
III General numerical approach and LiNbO3 crystal simulations
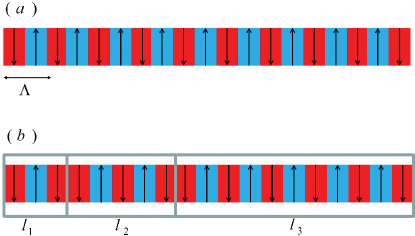
The procedure that we track is the following: the period of the flip sign of the nonlinear susceptibility is such that the phase mismatch for the OPA process will be zero in Eq. (2) due to QPM, resulting in a local modulation period (Fig.1 (a)). However, in contrast to the periodic design, we induce additional sign flips of the coupling coefficient at specific boundaries. In practice at each segment boundary there are two domains with the same orientation that merge in a single double-as-long domain, as shown in Fig.1 (b). The periodic sign switch of ensures the phase matching for OPA () and the additional sign switches of at the segment boundaries will change the sign of in the whole crystal segment in a similar fashion as in Shaka-Pines pulses from NMR Shaka1985 ; Shaka1987 . We denote the intervals between two double length domains as as shown in Fig.1 (b) and we find each length using Monte Carlo simulations. We set our units of length to be the crystal length , then we allow the coupling to vary from zero to and the phase mismatch to vary from to . In this way we generate 105 sets of random segments . Finally we pick up solutions, which 2D integral of the amplification in the above interval of and deliver the highest value. The lengths of composite segments for the best solutions are listed in Table 1. We have found that the use of a small number of composite segments (two, three and partly four) do not lead to any strong improvement with respect to the standard QPM case. In contrast, already for a moderate number of segments between six and eight we find a significant improvement of the robustness of the amplification process. In this case our analysis shows that there are different solutions for the optimum segment configurations (given in Table 1), which works better depending on the initial amplitude of the signal wave (as compared to the pump wave amplitude taken as ).
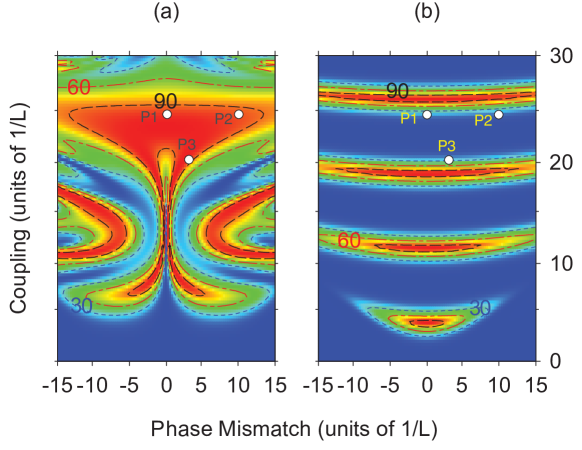
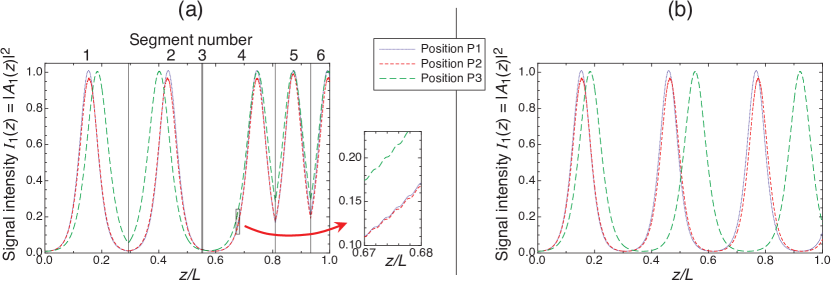
Figure 2 illustrates the performance of the composite crystals with six segments (6a from Table 1) compared to standard periodic design. The amplification values are calculated numerically from Eqs. (1) in the cases when , and and thus a pump-to-signal intensity ratio . Figure 2 shows clearly that the region of high signal intensity amplification expands strongly for the segmented composite crystal compared to standard periodic design. In other words, the composite crystals exhibit much broader acceptance bandwidths compared to a standard quasi-phase-matching. The working principle of the composite concept can be recognized directly with the help of Fig. 3, which depicts the evolutions of the signal wave intensity for the conditions associated to the three positions P1, P2 and P3 given in Fig. 2. Clearly each segment boundary gives rise to a ”kick” for such evolutions. By choosing the -positions of the frontiers appropriately, one can achieve that the spatial evolutions corresponding to points in the big red area in Fig. 2(a) get very close (nearly ”in phase”) near the end of the device at distance with a high final signal wave amplification, as seen in Fig. 3(a). In contrast, for pure QPM without composite segments such a ”re-phasing” cannot occur, as can be recognized in 3(b).
The simulations of Fig. 2 and Fig. 3 illustrate the general approach for finding the best composite sequence as compared to standard QPM. Next we will prove the concept further by applying these results to specific practical examples and we make the numerics for a real crystal: 5 mol. % Magnesium Oxide doped Lithium Niobate (MgO:LiNbO3). This ferroelectric nonlinear crystal possesses higher damage threshold compared to undoped LiNbO3, high nonlinear optical coefficient, broad transparency range and is suitable for domain poling Nikogosyan . We compare the standard quasi phase matching with the composite approach for OPA when the three interacting beams share the same extraordinary polarisation (Type 0 configuration, all beams polarized parallel to crystal -axis) associated to the largest element of the nonlinear tensor pm/V.
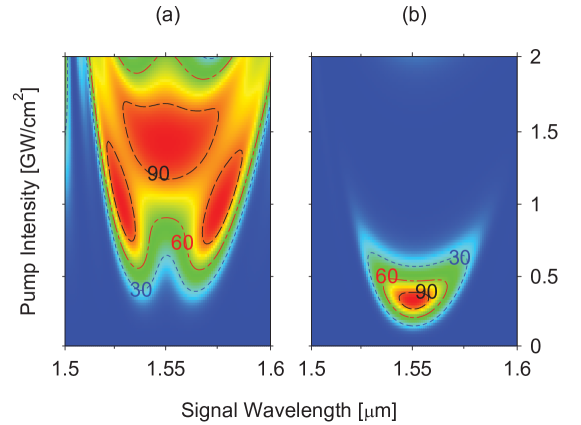
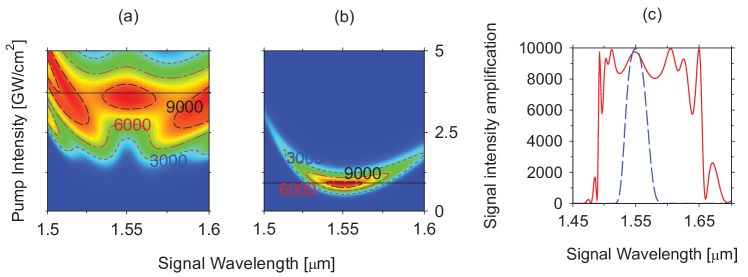
The color plots in Figs. 4 and 5 compare the signal intensity amplification for MgO:LiNbO3 for standard QPM ( m) and for a composite crystal made of six segments. Figure 4 is for intermediate pump-to-signal intensity ratio while Fig. 5 is for large . The nonlinear susceptibility is fixed and the plots are represented for varying input pump intensity (at the fixed wavelength of 1064 nm) and for varying signal wavelength (with center at =1550 nm). Note that here, in order to keep the ratio constant for each plot, the input signal intensity changes in the same way as the input pump intensity. Note also that the pump intensity (-axis) takes the role of the coupling in Fig. 2. Similarly, since a variation of the signal wavelength with respect to the central one gives rise to a phase mismatch , here the signal wavelength (-axis) takes the role of in Fig. 2. The total crystal length is mm. The amplification values are calculated numerically from Eqs. (1) in the cases when , and for Figure 4 and , and for Figure 5. Clearly, a greatly enhanced robustness and frequency bandwidth of the composite OPA compared to the standard QPM OPA can be recognized. The plots in Figure 5(c) compare directly the signal intensity amplification spectrum for the optimal range for composite crystal (red line) and optimal range for standard periodic design (blue dash line). These are slices at the pump intensity values of 3.75 GW/cm2 and 0.8 GW/cm2 in Fig. 5(a) and Fig. 5(b), respectively.
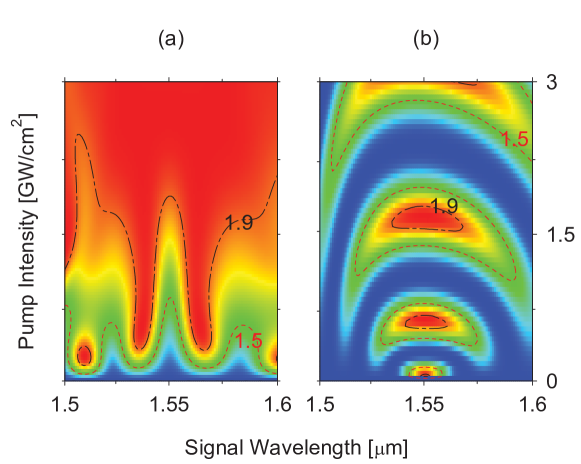
Finally, Fig. 6 give the color plots for the signal intensity amplification as in Fig. 4 and Fig. 5, but for the case where the initial signal intensity is as strong as the pump (, , and ). This is a highly depleted regime and the real advantages of the segmented composite approach over the standard QPM in the depleted pump regime can be recognized by the very large red area in the left panel. In general a laser beam spot has an intensity distribution with strong intensity in the center of the spot and smaller intensity at the wings (Gaussian beam for example). Therefore averaging the amplification value for the big red island of the left panel (a) in Fig. 6 will lead to a significantly higher average amplification than averaging the amplification values for the oscillation islands seen for standard QPM in Fig. 6(b). We can conclude from Figs. 4, 5 and 6 that the present composite OPA approach works very well in the depleted pump case because in all these cases one has a significant pump depletion and thus a signal amplification approaching the maximum theoretically possible.
IV Summary and Conclusions
In summary, we have used the similarity between the three wave mixing equations and the time-dependent Schrödinger equation in order to transfer concepts from quantum physics to nonlinear optics. Specifically, we have suggested to use segmented composite crystals for optical parametric amplification in analogy with the composite pulses in NMR and quantum optics. The approach used here is based on sign-alternating dual-compensating composite pulse sequences similar to those of Shaka and Pines Shaka1985 ; Shaka1987 . These are particularly suited for optical parametric amplification because besides the standard quasi-phase-matching they require only additional sign flips of the nonlinear optical susceptibility at specific locations corresponding to the segment frontiers. We have demonstrated numerically that this technique is especially powerful for broadband OPA. The present approach does not require very long crystals and, for the given example of MgO:LiNbO3, is compatible with pump intensities significantly below the damage threshold for ps or sub-ps illumination Bach17 ; Meng16 .
Acknowledgment
This research was funded by the EU Horizon-2020 ITN project LIMQUET (contract number 765075) and by the Bulgarian Science Fund Grant No. DN 18/14.
References
- (1) Joosen, W.; Agostini, P.; Petite, G.; Chambaret, J. P.; Antonetti, A. Broadband femtosecond infrared parametric amplification in -BaB2O4. Opt. Lett. 1992, 17, 133–135.
- (2) Gale, G. M.; Cavallari, M.; Driscoll, T. J.; Hache, F. Sub-20-fs tunable pulses in the visible from an 82-MHz optical parametric oscillator. Opt. Lett. 1995, 20, 1562–1564.
- (3) Gale, G. M.; Hache, F.; Cavallari, M. Broad-bandwidth parametric amplification in the visible: femtosecond experiments and simulations. IEEE J. Sel. Top. Quantum Electron. 1998, 4, 224–229.
- (4) Schmidt, B. E.; Thiré, N.; Boivin, M.; Laramée, A.; Poitras, F.; Lebrun, G.; Ozaki, T.; Ibrahim, H.; Légaré, F. Frequency domain optical parametric amplification. Nat. Commun. 2014, 5, 3643.
- (5) Harris, S. E. Chirp and compress: toward single-cycle biphotons. Phys. Rev. Lett. 2007, 98, 063602.
- (6) Charbonneau-Lefort, M.; Afeyan, B.; Fejer, M. M. Optical parametric amplifiers using chirped quasi-phase-matching gratings. I: practical design formulas. J. Opt. Soc. Am. B 2008, 25, 463–480.
- (7) Charbonneau-Lefort, M.; Afeyan, B.; Fejer, M. M. Optical parametric amplifiers using nonuniform quasi-phase-matched gratings. II: Space-time evolution of light pulses. J. Opt. Soc. Am. B 2008, 25, 680–697.
- (8) Phillips, C. R.; Fejer, M. M. Adiabatic optical parametric oscillators: steady-state and dynamical behavior. Opt. Express 2012, 20, 2466–2482.
- (9) Phillips, C. R.; Langrock, C.; Chang, D.; Lin, Y. W.; Gallmann, L.; Fejer, M. M. Apodization of chirped quasi-phasematching devices. J. Opt. Soc. Am. B 2013, 30, 1551–1568.
- (10) Suchowski, H.; Krogen, P. R.; Huang, S. W.; Kärtner, F. X.; Moses, J. Octave-spanning coherent mid-IR generation via adiabatic difference frequency conversion. Opt. Express 2013, 21, 28892–28901.
- (11) Levitt, M. H.; Freeman, R. NMR population inversion using a composite pulse. J. Magn. Reson. 1979, 33, 473–476.
- (12) Shaka, A. Composite pulses for ultra-broadband spin inversion. Chem. Phys. Lett. 1985, 120, 201–205.
- (13) Shaka, A.; Pines, A. Symmetric phase-alternating composite pulses. J. Magn. Reson. 1987, 71, 495–503.
- (14) Boyd, R. W. Nonlinear Optics, 3rd ed.; Academic Press: New York, USA, 2007.
- (15) Yariv, A.; Yeh, P. Photonics: Optical Electronics in Modern Communications, 6th ed.; Oxford University Press: New York, USA, 2007.
- (16) Shen, Y. R. The Principles of Nonlinear Optics; John Wiley and Sons: Hoboken, USA, 1984.
- (17) Baumgartner, R.; Byer, R. Optical parametric amplification. IEEE J. Quantum Electron. 1979, 15, 432–444.
- (18) http://mathworld.wolfram.com/JacobiEllipticFunctions.html
- (19) Levitt, M. H. Composite pulses. Prog. Nucl. Magn. Reson. Spectrosc. 1986, 18, 61–122.
- (20) Freeman, R. Spin Choreography; Spektrum: Oxford, UK, 1997.
- (21) Schmidt-Kaler, F.; Häffner, H.; Riebe, M.; Gulde, S.; Lancaster, G. P. T.; Deuschle, T.; Becher, C.; Roos, C. F.; Eschner, J.; Blatt, R. Realization of the Cirac–Zoller controlled-NOT quantum gate. Nature (London) 2003, 422, 408-411.
- (22) Timoney, N.; Elman, V.; Glaser, S.; Weiss, C.; Johanning, M.; Neuhauser, W.; Wunderlich, C. Error-resistant single-qubit gates with trapped ions. Phys. Rev. A 2008, 77, 052334.
- (23) Torosov, B. T.; Guerin, S.; Vitanov, N. V. High-Fidelity Adiabatic Passage by Composite Sequences of Chirped Pulses. Phys. Rev. Lett. 2011, 106, 233001.
- (24) Schraft, D.; Halfmann, T.; Genov, G. T.; Vitanov, N. V. Experimental demonstration of composite adiabatic passage. Phys. Rev. A 2013, 88, 063406.
- (25) Genov, G. T.; Rangelov, A. A.; Vitanov, N. V. Efficient broadband frequency generation in composite crystals. J. Opt. 2014, 16, 062001.
- (26) Rangelov, A. A. Vitanov, N. V.; Montemezzani, G. Robust and broadband frequency conversion in composite crystals with tailored segment widths and nonlinearities of alternating signs. Opt. Lett. 2014, 39, 2959–2962.
- (27) Erlich, Y.; Rangelov, A. A.; Montemezzani, G.; Suchowski, H. Robust, efficient, and broadband SHG of ultrashort pulses in composite crystals. Opt. Lett. 2019, 44, 3837–3840.
- (28) Suchowski, H.; Porat, G.; Arie, A. Adiabatic processes in frequency conversion. Laser Photonics Rev. 2014, 8, 333–367.
- (29) Suchowski, H.; Oron, D.; Arie, A.; Silberberg, Y. Geometrical representation of sum frequency generation and adiabatic frequency conversion. Phys. Rev. A 2008, 78, 063821.
- (30) Nikogosyan, D. N. Nonlinar Optical Crystals; Springer: New York, USA, 2005.
- (31) Bach, F.; Mero, M.; Chou, M.-H.; Petrov, V. Laser induced damage studies of LiNbO3 using 1030-nm, ultrashort pulses at 10-1000 kHz. Opt. Mater. Express 2017, 7, 240–252.
- (32) Meng, Q.; Zhang, B.; Zhong, S.; Zhu, L. Damage threshold of lithium niobate crystal under single and multiple femtosecond laser pulses: theoretical and experimental study. Appl. Phys. A 2016, 122, 582.