Phase transformation in boron under shock compression
Abstract
![[Uncaptioned image]](/html/2001.11890/assets/x1.png)
Using first-principles molecular dynamics, we calculated the equation of state and shock Hugoniot of various boron phases. We find a large mismatch between Hugoniots based on existing knowledge of the equilibrium phase diagram and those measured by shock experiments, which could be reconciled if the -B12/-B28 transition is significantly over-pressurized in boron under shock compression. Our results also indicate that there exists an anomaly and negative Clapeyron slope along the melting curve of boron at 100 GPa and 1500–3000 Kelvin. These results enable in-depth understanding of matter under shock compression, in particular the significance of compression-rate dependence of phase transitions and kinetic effects in experimental measurements.
keywords:
phase transformation, high pressure, Hugoniot, melting, DFT-MD, EOS1 Introduction
Boron is a prototype for low- and superhard materials and a candidate for making ablators for high energy density and inertial confinement fusion experiments [1]. Boron has complex atomistic structures that are characterized by various icosahedral arrangements at ambient conditions and multiple phases under moderate (up to 3.5-times) compression. Clarifying the structure, stability relation, and melting of the various boron polymorphs at high pressure has long been a subject of interest in the solid state physics and chemistry community [2, 3, 4, 5, 6, 7, 8, 9, 10, 11, 12, 13, 14, 15].
Existing phase diagrams of boron are represented by five different crystalline phases: , t, and -Ga, according to density functional theory (DFT) calculations and diamond anvil cell (DAC) experiments at pressures up to 200 GPa [16]. Among them, the nonicosahedral metallic -Ga phase has not been experimentally verified until recently [17], and questions remain on the exact boundaries between different phases and the atomistic structure of the t phase [7, 10, 18]. Dynamic compression experiments, which simultaneously generate high pressures and high temperatures, produced pressure-density equation of state (EOS) data along the shock Hugoniot of solid boron up to 112 GPa [19]. More recently, additional data have been obtained from experiments at large laser facilities, including liquid structure-factor measurements using x-ray radiography to 100–400 GPa [20] and warm dense matter EOS measurements of the Hugoniot at pressures as high as 5608 GPa [1]. Explosive shock experiments have also been performed to measure the electrical conductivity [21] and structural transformation using x-ray diffraction [22] and found amorphization of boron when shock-compressed to 115 GPa.
These recent laser-shock results [1, 20] have been compared with highly accurate first-principles electronic structure methods, in particular density functional theory molecular dynamics (DFT-MD). The DFT-MD calculations have shown remarkably good agreement with experimental results for the ionic structure and Hugoniot of liquid boron, and also provided the opportunity to examine other details of the material that are not immediately accessible in shock experiments, such as the Hugoniot temperature and diffusivity.
In this paper, we focus on the condensed matter regime of the phase diagram with pressures up to 1000 GPa and temperatures up to a few electron volt (eV, 1 eV1.2 K). These conditions are accessible with routine diamond anvil cell and shock experiments, which can be used to test our predictions.
2 Methodology
Our DFT-MD simulations of boron follow similar procedures to those in [1]. We use Vienna Ab initio Simulation Package (VASP) [23] for all the calculations. We choose a hard (core radius=1.1 Bohr) projected augmented wave (PAW) pseudopotential [24] which is suitable for high-pressure studies. The 2s22p1 electrons are treated as valence. Perdew-Burke-Ernzerhof (PBE) [25] exchange-correlation functional is used in this work, consistent with previous DFT calculations on solid boron [26, 27, 28]. We use a large cutoff energy of 2000 eV for the plane-wave basis and the point for Brillouin zone sampling. MD trajectories, typically consisting of 5000–10000 snapshots each with timesteps of 0.05–0.55 fs and regulated by the Nosé thermostat [29], are generated to form canonical () ensembles. Internal energies and pressures are obtained by averaging over the trajectory following equilibration of the ionic structure, typically after the first 20% of the simulation time. The atomistic diffusion during the DFT-MD simulations have been carefully cross-checked to ensure no structural instability occurs at the conditions that the EOS data are reported.
For solid boron, we refer to previous publications for the equilibrium phase diagram [13, 16] and perform DFT-MD calculations for four major phases (, -B12, -B28, and -Ga) at pressure-temperature conditions beyond their respective stability regimes. This allows construction of Hugoniots in broader ranges, which enables more detailed comparison with experiments than being limited by the phase boundaries and their uncertainties in the equilibrium phase diagram. In the DFT-MD simulations, we choose a 222 supercell with 96 atoms for -B12, 323 supercell with 144 atoms for -Ga, 221 supercell with 112 atoms for -B28, and two different structures for boron [30]: one is symmetric with 105 atoms in the unit cell, whereas the other has 106 atoms in the unit cell.
The simulations of liquid boron typically consist of 120 atoms in a cubic box with periodic boundary conditions. With this setting, our previous tests with different cell sizes [1] showed that the finite size errors on the EOS are negligible at 5 K. We perform additional calculations at 1500–2 K using the same cell shapes and numbers of atoms as the corresponding solid phases, in order to examine the possibility of structure dependence of the EOS of boron liquids.
3 Results and Discussion
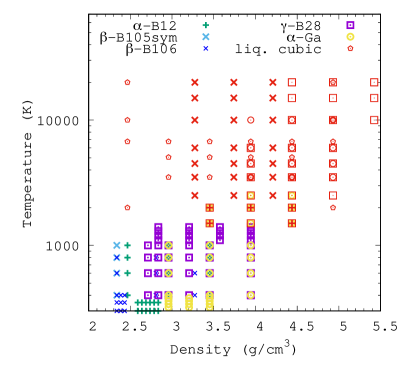
Our DFT-MD simulations and EOS data for boron reveal several facts about the structural relations and the phase diagram of boron, as shown in Fig. 1, which summarizes the temperature-density conditions where the explored phases can be stabilized in this study and the corresponding temperature-pressure data. Firstly, along two isochores of 2.96 and 3.45 g/cm3, the pressure relation of the three -B12, -B28, and -Ga phases are . This indicates that the transitions -B12 -B28 -Ga are driven by the term in the enthalpy differences because the density increases discontinuously upon transition to the high-pressure phases. Secondly, along the isochore of 2.34 g/cm3, the pressures of the symmetric 105-atom structure is higher than the 106-atom phase. This, together with our findings that the symmetric 105-atom structure is not stable at higher densities, indicates that the structural complexity of the phase can have more significant effects in determining the properties of boron at ambient–low pressures than at high pressures. Thirdly, our simulations show that the melting temperature of high-pressure boron can be as low as 1500–2500 K (for the -B12, , and phases) or 2500–3500 K (for the -Ga phase) at above 90 GPa. This is in contrast to expectations based on existing knowledge about the boron phase diagram (dashed curves in the right panel of Fig. 1) and indicates that an anomaly and negative Clapeyron slope could exist along the melting curve at 100 GPa and 1500–3000 K.
The above results and discussion are about the equilibrium phases of boron under stable temperatures and pressures. In the following, we focus on phase transitions under shock compression. The EOS data from our DFT-MD simulations are utilized to predict the shock Hugoniot profiles, following the Rankine-Hugoniot equation [32] which connects the internal energy, pressure, and volume of the shocked state () to the initial state (). The initial energy and pressure are taken to be those of boron with a density of 2.338 g/cm3 according to DFT-MD simulations of a 1280-atom structure at 300 K [6, 26, 33].
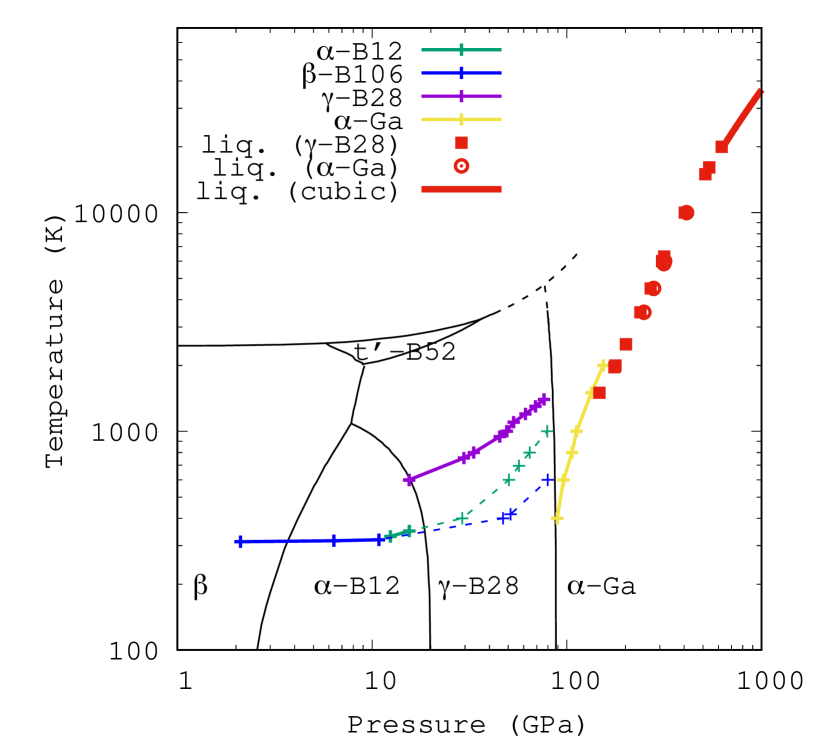
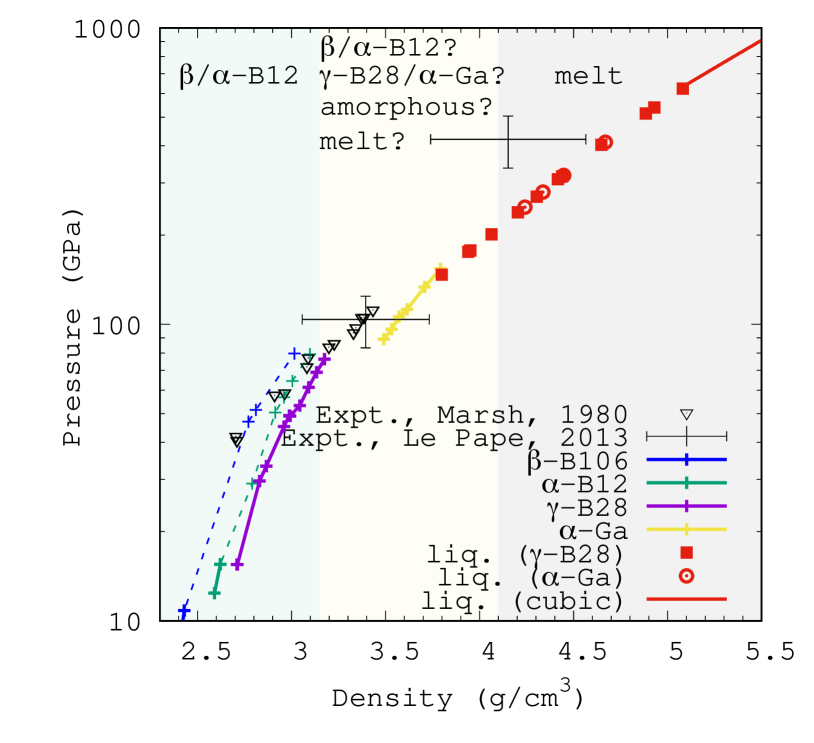
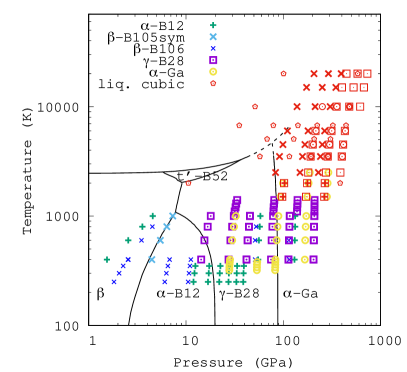
The Hugoniot curves thus obtained are shown with a temperature-pressure diagram in Fig. 2 and a pressure-density diagram in Fig. 3. Different single-phase Hugoniots are represented by different colored line-points. The temperature-pressure Hugoniots are compared with the equilibrium boron phase diagram based on [13, 16], and pressure-density Hugoniots are compared with shock compression experimental data from [19] and [20].
Our results for the liquid show that Hugoniot curves are insensitive to the simulation cell being used. This means once the sample is shocked to melt, the Hugoniot data does not exhibit any memory of the solid phase that existed right before the melt. This effect is also evident in the warm dense matter Hugoniot measurements from Ref. [1], where we find good agreement between the DFT-based Hugoniot and experiment. In comparison, the Hugoniot data for solid phases could be characterized by discontinuities, as Fig. 2 shows. If phase transitions occur in shock compressed boron at the same pressure-temperature conditions as those expected by the equilibrium phase diagram, the Hugoniot would have two major discontinuities, one at 15 GPa and the other at 80 GPa, corresponding to the phase boundaries of -B12-B28 and -B28-Ga, respectively. Following the DFT-based structural equilibrium picture, melting along the Hugoniot occurs for the -Ga phase at 2500–3500 K and 200 GPa, unless some other unknown structure stabilizes over -Ga at 100 GPa and 2000 K, which is not unlikely considering the fact that high temperature phases can be stabilized by high pressure in other elemental systems such as beryllium [36] and silicon [37].
However, when comparing the pressure-density Hugoniots under the assumption that the phase changes follow the equilibrium phase diagram, we find clear discrepancies between theory and experiment, as shown by the differences between the solid curves and black triangles in Fig. 3. If a sample is shocked up to 80 GPa, the experimental data appear to follow the trend of our predicted Hugoniot for the -B12 and -B106 phases, and clearly deviate from that of -B28. Above 80 GPa, all experimental Hugoniot data up to 112 GPa follow the trend of our predicted Hugoniot for -B12 as well as that for -B28 and probably also -B106, but do not show signatures of transition to the -Ga phase that would be associated with a down-jump in pressure and temperature and an up-jump in density. These indicate that boron may remain in the same or -B12 phase as its initial state when shock compressed to at least 80 GPa, instead of transforming into the -B28 phase. Our simulations show temperature can significantly affect the stability of -B28 and melting occurs upon very slight increase in temperature (Fig. 1). Therefore, if the transformation to -B28 happened at above 80 GPa, it would be associated with a jump in temperature and immediately followed by melting or transformation into some other solid structures. In addition, our DFT-MD simulations show -B106 remains stable at 115 GPa and 600 K, and large atomistic displacement or structural instability occur when temperature exceeds 800–1000 K or pressure is higher than 130 GPa. We also find -B12 remains stable at 133 GPa, and instability occurs at above 150 GPa, for 1000 K or lower temperatures. These set the upper bounds for -B106 or -B12 samples to remain stable when boron is shocked to above 80 GPa. With stronger shock to above 200 GPa and 3500 K, liquid boron is expected. Temperatures along the shock Hugoniot are increasingly higher than cold compression along an ambient-temperature isotherm. The transformation kinetics is thus expected to be slower in room-temperature static compression experiments.
Our findings above on the phase transitions in shocked boron based on the EOS point of view are supported remarkably well by experiments. As an example, in the diamond-anvil cell and x-ray diffraction experiments by Sanz et al. [14], -boron was the stable structure up to 100 GPa, at which point an amorphization structure was observed. Similarly, explosive shock and diffraction experiments by Molodets and co-authors [22, 21] did not detect the occurrence of -B28 boron over the pressure range of 20–90 GPa. Instead, the -B106 phase was found to be stabilized until amorphization occured at 90–115 GPa. In another experiment by Le Pape et al. [20], the ionic structure factor at several scattering wavevectors () was measured for boron laser-shocked to 100 GPa and 3.4 g/cm3. By comparison with theoretical predictions of the solid and liquid Hugoniots, they attributed the results to a liquid state. However, there is no direct experimental evidence that allows one to distinguish these data from that of an amorphous solid, which is structurally similar to liquid boron [38].
It is interesting to note that, the Hugoniot temperature of -B106 at 90 GPa is 600 K according to our calculations (Fig. 2). The absence of -B28 or -Ga phases in the shock experiments, together with findings in laser heated DAC experiments [17] that it requires heating to 2000 K to make the phases out of boron, suggests an energy barrier of 0.05–0.17 eV between and /-Ga phases. The observed amorphization in megabar-pressure experiments [14, 21, 22] is likely a product of competition between the thermodynamic barrier that slows down the process of phase transformation and the decreased dynamic stability of boron at megabar pressures.
It is always the case that DFT-MD calculations are not perfect. For example, although the DFT-MD calculations accurately capture any anharmonic effect, treating atoms classically neglects the nuclear quantum effect. While this may be important in determining the absolute EOS accurately, the effect on the Hugoniot is likely smaller [39] and could be largely canceled when comparing the differences between different phases. Therefore, we do not expect this effect to change our conclusions. However, considering the close relevance of nuclear quantum effects to structure searching and improving the equilibrium phase diagram, we plan to explore potential effects of nuclear quantum motion in a future publication.
4 Conclusion
In conclusion, by extensive DFT-MD calculations of the EOS and Hugoniots of boron in various phases, we show that the phase transitions in boron under shock compression cannot be explained simply via comparison with the equilibrium crystaline phase diagram. The discrepancies between calculations and experimental data can be better reconciled by assuming over-pressurization of the -B12/ phase prior to transition to the -B28 phase, and of the -B28 phase prior to transition to -Ga or melting. In addition, our computed melting temperatures are lower than expected and indicate the melting curve of boron has an anomaly and a negative Clapeyron slope at 100 GPa and 1500–3000 K.
Experiments at 100–200 GPa could test our predictions and are achievable using various DAC and shock experiments. Dynamic DAC, laser shock compression with pre-compressed or pre-heated samples, decaying shock, and in situ diffraction could be very useful in clarifying the microscopic mechanism and property changes upon solid state phase transitions and melting of boron. Temporal velocity profiles in shock experiments with various setups will also provide important constraints to quantify the kinetics of boron phase transitions by applying phase field models [40].
These results enable in-depth understanding of matter under shock compression, in particular the significance of compression-rate dependence of phase transitions and kinetic effects in experimental measurements. Our theoretical findings, joint with recent experiments [41, 42, 43], provide striking evidences showing that phase relations of materials under shock compression can deviate from those determined in equilibrium and raise questions about kinetics or non-equilibrium processes that materials may undergo during the timescale of the pressure loading.
Acknowledgments
This research was in part performed under the auspices of the U.S. Department of Energy by Lawrence Livermore National Laboratory under Contract No. DE-AC52-07NA27344. Computational support was provided by LLNL high-performance computing facility (Quartz). S.Z. was partially supported by the PLS-Postdoctoral Grant of LLNL. The authors acknowledge Dr. Alfredo Correa, Dr. Federica Coppari, and Prof. Eva Zurek for useful discussions.
This document was prepared as an account of work sponsored by an agency of the United States government. Neither the United States government nor any agency thereof, nor any of their employees, makes any warranty, express or implied, or assumes any legal liability or responsibility for the accuracy, completeness, or usefulness of any information, apparatus, product, or process disclosed, or represents that its use would not infringe privately owned rights. Reference herein to any specific commercial product, process, or service by trade name, trademark, manufacturer, or otherwise does not necessarily constitute or imply its endorsement, recommendation, or favoring by the U.S. Government or any agency thereof. The views and opinions of authors expressed herein do not necessarily state or reflect those of the U.S. Government or any agency thereof, and shall not be used for advertising or product endorsement purposes.
References
-
[1]
S. Zhang, B. Militzer, M. C. Gregor, K. Caspersen, L. H. Yang, J. Gaffney,
T. Ogitsu, D. Swift, A. Lazicki, D. Erskine, R. A. London, P. M. Celliers,
J. Nilsen, P. A. Sterne, H. D. Whitley,
Theoretical and
experimental investigation of the equation of state of boron plasmas, Phys.
Rev. E 98 (2018) 023205.
doi:10.1103/PhysRevE.98.023205.
URL https://link.aps.org/doi/10.1103/PhysRevE.98.023205 -
[2]
A. Masago, K. Shirai, H. Katayama-Yoshida,
Crystal stability
of - and -boron, Phys. Rev. B 73
(2006) 104102.
doi:10.1103/PhysRevB.73.104102.
URL https://link.aps.org/doi/10.1103/PhysRevB.73.104102 -
[3]
S. Shang, Y. Wang, R. Arroyave, Z.-K. Liu,
Phase stability in
- and -rhombohedral boron, Phys.
Rev. B 75 (2007) 092101.
doi:10.1103/PhysRevB.75.092101.
URL https://link.aps.org/doi/10.1103/PhysRevB.75.092101 - [4] M. J. van Setten, M. A. Uijttewaal, G. A. de Wijs, R. A. de Groot, Thermodynamic stability of boron: the role of defects and zero point motion, Journal of the American Chemical Society 129 (9) (2007) 2458–2465. doi:10.1021/ja0631246.
- [5] M. A. White, A. B. Cerqueira, C. A. Whitman, M. B. Johnson, T. Ogitsu, Determination of phase stability of elemental boron, Angewandte Chemie 127 (12) (2015) 3697–3700. doi:10.1002/ange.201409169.
- [6] T. Ogitsu, F. Gygi, J. Reed, Y. Motome, E. Schwegler, G. Galli, Imperfect crystal and unusual semiconductor: Boron, a frustrated element, Journal of the American Chemical Society 131 (5) (2009) 1903–1909. doi:10.1021/ja807622w.
-
[7]
T. Ogitsu, E. Schwegler, G. Galli,
β-rhombohedral boron: At the
crossroads of the chemistry of boron and the physics of frustration, Chem.
Rev. 113 (5) (2013) 3425–3449.
doi:10.1021/cr300356t.
URL http://dx.doi.org/10.1021/cr300356t -
[8]
Y. Ma, C. T. Prewitt, G. Zou, H.-k. Mao, R. J. Hemley,
High-pressure
high-temperature x-ray diffraction of -boron to 30 gpa,
Phys. Rev. B 67 (2003) 174116.
doi:10.1103/PhysRevB.67.174116.
URL https://link.aps.org/doi/10.1103/PhysRevB.67.174116 -
[9]
E. Y. Zarechnaya, L. Dubrovinsky, N. Dubrovinskaia, Y. Filinchuk,
D. Chernyshov, V. Dmitriev, N. Miyajima, A. El Goresy, H. F. Braun,
S. Van Smaalen, I. Kantor, A. Kantor, V. Prakapenka, M. Hanfland, A. S.
Mikhaylushkin, I. A. Abrikosov, S. I. Simak,
Superhard
semiconducting optically transparent high pressure phase of boron, Phys.
Rev. Lett. 102 (2009) 185501.
doi:10.1103/PhysRevLett.102.185501.
URL https://link.aps.org/doi/10.1103/PhysRevLett.102.185501 - [10] G. Parakhonskiy, N. Dubrovinskaia, E. Bykova, R. Wirth, L. Dubrovinsky, Sci. Rep. 1 (2011) 96. doi:10.1038/srep00096.
- [11] O. O. Kurakevych, Y. L. Godec, T. Hammouda, C. Goujon, Comparison of solid-state crystallization of boron polymorphs at ambient and high pressures, High Pressure Research 32 (1) (2012) 30–38. doi:10.1080/08957959.2011.635145.
-
[12]
J. Qin, T. Irifune, H. Dekura, H. Ohfuji, N. Nishiyama, L. Lei, T. Shinmei,
Phase relations in
boron at pressures up to 18 gpa and temperatures up to 2200
∘c, Phys. Rev. B 85 (2012) 014107.
doi:10.1103/PhysRevB.85.014107.
URL https://link.aps.org/doi/10.1103/PhysRevB.85.014107 -
[13]
V. L. Solozhenko, O. O. Kurakevych,
Equilibrium p-t phase diagram of
boron: Experimental study and thermodynamic analysis, Sci. Rep. 3 (2013)
2351.
doi:10.1038/srep02351.
URL http://dx.doi.org/10.1038/srep02351 -
[14]
D. N. Sanz, P. Loubeyre, M. Mezouar,
Equation of
state and pressure induced amorphization of -boron from
x-ray measurements up to 100 gpa, Phys. Rev. Lett. 89 (2002) 245501.
doi:10.1103/PhysRevLett.89.245501.
URL https://link.aps.org/doi/10.1103/PhysRevLett.89.245501 -
[15]
S. H. Zhang, X. Zheng, Q. Q. Jin, S. J. Zheng, D. Legut, X. H. Yu, H. Y. Gou,
Z. H. Fu, Y. Q. Guo, B. M. Yan, C. Peng, C. Q. Jin, T. C. Germann, R. F.
Zhang,
Unprecedented
plastic flow channel in gamma-b28 through ultrasoft bonds: A
challenge to superhardness, Phys. Rev. Materials 2 (2018) 123602.
doi:10.1103/PhysRevMaterials.2.123602.
URL https://link.aps.org/doi/10.1103/PhysRevMaterials.2.123602 -
[16]
A. R. Oganov, J. Chen, C. Gatti, Y. Ma, Y. Ma, C. W. Glass, Z. Liu, T. Yu,
O. O. Kurakevych, V. L. Solozhenko,
Ionic high-pressure form of
elemental boron, Nature 457 (7231) (2009) 863–867.
URL http://dx.doi.org/10.1038/nature07736 - [17] I. Chuvashova, E. Bykova, M. Bykov, V. Prakapenka, K. Glazyrin, M. Mezouar, L. Dubrovinsky, N. Dubrovinskaia, Nonicosahedral boron allotrope synthesized at high pressure and high temperature, Physical Review B 95 (18) (2017) 1–6. doi:10.1103/PhysRevB.95.180102.
-
[18]
K. Shirai, Phase
diagram of boron crystals, Japanese Journal of Applied Physics 56 (5S3)
(2017) 05FA06.
URL http://stacks.iop.org/1347-4065/56/i=5S3/a=05FA06 - [19] S. P. Marsh, LASL Shock Hugoniot Data, University of California Press, Berkeley, 1980.
- [20] S. Le Pape, A. A. Correa, C. Fortmann, P. Neumayer, T. Döppner, P. Davis, T. Ma, L. Divol, K.-U. Plagemann, E. Schwegler, R. Redmer, S. Glenzer, Structure measurements of compressed liquid boron at megabar pressures, New Journal of Physics 15 (8) (2013) 085011. doi:10.1088/1367-2630/15/8/085011.
-
[21]
A. M. Molodets, A. A. Golyshev, D. V. Shakhray, V. V. Kim,
Electrical
conductivity and equations of states of -rhombohedral boron in the
megabar dynamic pressure range, Physics of the Solid State 59 (7) (2017)
1406–1413.
doi:10.1134/S1063783417070150.
URL http://link.springer.com/10.1134/S1063783417070150 -
[22]
A. M. Molodets, A. A. Golyshev,
Amorphization
and a Polymorphic Transformation of Boron Stimulated by High Dynamic
Pressures, Original Russian Text © A.M. Molodets, A.A.
Golyshev 108 (6) (2018) 430–434.
doi:10.1134/S002136401818008X.
URL https://link.springer.com/content/pdf/10.1134{%}2FS002136401818008X.pdf - [23] G. Kresse, J. Furthmüller, Efficient iterative schemes for ab initio total-energy calculations using a plane-wave basis set, Phys. Rev. B 54 (1996) 11169.
- [24] P. E. Blöchl, O. Jepsen, O. K. Andersen, Improved tetrahedron method for brillouin-zone integrations, Phys. Rev. B 49 (1994) 16223–16233.
- [25] J. P. Perdew, K. Burke, M. Ernzerhof, Generalized Gradient Approximation Made Simple, Phys. Rev. Lett. 77 (1996) 3865.
-
[26]
T. Ogitsu, F. m. c. Gygi, J. Reed, M. Udagawa, Y. Motome, E. Schwegler,
G. Galli,
Geometrical
frustration in an elemental solid: An ising model to explain the defect
structure of -rhombohedral boron, Phys. Rev. B 81 (2010)
020102.
doi:10.1103/PhysRevB.81.020102.
URL https://link.aps.org/doi/10.1103/PhysRevB.81.020102 -
[27]
D. L. V. K. Prasad, M. M. Balakrishnarajan, E. D. Jemmis,
Electronic
structure and bonding of -rhombohedral boron using
cluster fragment approach, Phys. Rev. B 72 (2005) 195102.
doi:10.1103/PhysRevB.72.195102.
URL https://link.aps.org/doi/10.1103/PhysRevB.72.195102 -
[28]
B. Siberchicot, Ab
initio equation of state of - and
-boron: Possible amorphization of
-boron under high pressure, Phys. Rev. B 79 (2009)
224101.
doi:10.1103/PhysRevB.79.224101.
URL https://link.aps.org/doi/10.1103/PhysRevB.79.224101 - [29] S. Nosé, A unified formulation of the constant temperature molecular dynamics methods, J. Chem. Phys. 81 (1) (1984) 511–519. doi:10.1063/1.447334.
-
[30]
Q. An, K. M. Reddy, K. Y. Xie, K. J. Hemker, W. A. Goddard,
New
ground-state crystal structure of elemental boron, Phys. Rev. Lett. 117
(2016) 085501.
doi:10.1103/PhysRevLett.117.085501.
URL https://link.aps.org/doi/10.1103/PhysRevLett.117.085501 -
[31]
V. V. Kechin,
Melting curve
equations at high pressure, Phys. Rev. B 65 (2001) 052102.
doi:10.1103/PhysRevB.65.052102.
URL https://link.aps.org/doi/10.1103/PhysRevB.65.052102 - [32] M. A. Meyers, Dynamic Behavior of Materials (Wiley, New York, 1994).
- [33] We choose boron with =2.338 g/cm3 here for the initial structure because it enables more reasonable comparison with most of the experimental data, which are from [19] using samples with the same initial density. The other two experimental data points from [20] have slightly higher initial density of 2.4 g/cm3. We note that using -B12 with =2.46517 g/cm3 as the initial structure, the Hugoniots are slightly different but our conclusions do not change.
- [34] We note that our predicted Hugoniot for the liquid are consistent with that by Plagemann et al. but different from those that reported in [20]. However, complete details of the calculations and the experimental datapoint at 400 GPa are missing which makes further clarification of the underlying reasons impossible.
- [35] According to private communications with Alfredo Correa.
-
[36]
Y. Lu, T. Sun, P. Zhang, P. Zhang, D.-B. Zhang, R. M. Wentzcovitch,
Premelting hcp
to bcc transition in beryllium, Phys. Rev. Lett. 118 (2017) 145702.
doi:10.1103/PhysRevLett.118.145702.
URL https://link.aps.org/doi/10.1103/PhysRevLett.118.145702 -
[37]
R. Paul, S. X. Hu, V. V. Karasiev,
Anharmonic and
Anomalous Trends in the High-Pressure Phase Diagram of Silicon, Physical
Review Letters 122 (12) (2019) 125701.
doi:10.1103/PhysRevLett.122.125701.
URL https://journals.aps.org/prl/pdf/10.1103/PhysRevLett.122.125701https://link.aps.org/doi/10.1103/PhysRevLett.122.125701 -
[38]
S. Krishnan, S. Ansell, J. J. Felten, K. J. Volin, D. L. Price,
Structure of
liquid boron, Phys. Rev. Lett. 81 (1998) 586–589.
doi:10.1103/PhysRevLett.81.586.
URL https://link.aps.org/doi/10.1103/PhysRevLett.81.586 -
[39]
S. Zhang, A. Lazicki, B. Militzer, L. H. Yang, K. Caspersen, J. A. Gaffney,
M. W. Däne, J. E. Pask, W. R. Johnson, A. Sharma, P. Suryanarayana,
D. D. Johnson, A. V. Smirnov, P. A. Sterne, D. Erskine, R. A. London,
F. Coppari, D. Swift, J. Nilsen, A. J. Nelson, H. D. Whitley,
Equation of state of
boron nitride combining computation, modeling, and experiment, Physical
Review B 99 (16) (2019) 165103.
arXiv:1902.00667,
doi:10.1103/PhysRevB.99.165103.
URL http://arxiv.org/abs/1902.00667http://dx.doi.org/10.1103/PhysRevB.99.165103https://link.aps.org/doi/10.1103/PhysRevB.99.165103 - [40] T. Haxhimali, J. L. Belof, L. X. Benedict, A time-dependent ginzburg-landau phase field formalism for shock-induced phase transitions, AIP Conference Proceedings 1793 (2017). doi:10.1063/1.4971714.
-
[41]
E. E. McBride, A. Krygier, A. Ehnes, E. Galtier, M. Harmand,
Z. Konôpková, H. J. Lee, H.-p. Liermann, B. Nagler, A. Pelka,
M. Rödel, A. Schropp, R. F. Smith, C. Spindloe, D. Swift, F. Tavella,
S. Toleikis, T. Tschentscher, J. S. Wark, A. Higginbotham,
Phase transition lowering
in dynamically compressed silicon, Nature Physics 15 (1) (2019) 89–94.
doi:10.1038/s41567-018-0290-x.
URL https://doi.org/10.1038/s41567-018-0290-xhttp://www.nature.com/articles/s41567-018-0290-x -
[42]
M. G. Gorman, A. L. Coleman, R. Briggs, R. S. McWilliams, D. McGonegle, C. A.
Bolme, A. E. Gleason, E. Galtier, H. J. Lee, E. Granados, M. Śliwa,
C. Sanloup, S. Rothman, D. E. Fratanduono, R. F. Smith, G. W. Collins, J. H.
Eggert, J. S. Wark, M. I. McMahon,
Femtosecond
diffraction studies of solid and liquid phase changes in shock-compressed
bismuth, Scientific Reports 8 (1) (2018) 16927.
doi:10.1038/s41598-018-35260-3.
URL http://www.nature.com/articles/s41598-018-35260-3 -
[43]
A. L. Coleman, M. G. Gorman, R. Briggs, R. S. McWilliams, D. McGonegle, C. A.
Bolme, A. E. Gleason, D. E. Fratanduono, R. F. Smith, E. Galtier, H. J. Lee,
B. Nagler, E. Granados, G. W. Collins, J. H. Eggert, J. S. Wark, M. I.
McMahon,
Identification of
Phase Transitions and Metastability in Dynamically Compressed Antimony Using
Ultrafast X-Ray Diffraction, Physical Review Letters 122 (25) (2019)
255704.
doi:10.1103/PhysRevLett.122.255704.
URL https://journals.aps.org/prl/pdf/10.1103/PhysRevLett.122.255704https://link.aps.org/doi/10.1103/PhysRevLett.122.255704