Disease State Prediction From Single-Cell Data Using Graph Attention Networks
Abstract.
Single-cell RNA sequencing (scRNA-seq) has revolutionized biological discovery, providing an unbiased picture of cellular heterogeneity in tissues. While scRNA-seq has been used extensively to provide insight into both healthy systems and diseases, it has not been used for disease prediction or diagnostics. Graph Attention Networks (GAT) have proven to be versatile for a wide range of tasks by learning from both original features and graph structures. Here we present a graph attention model for predicting disease state from single-cell data on a large dataset of Multiple Sclerosis (MS) patients. MS is a disease of the central nervous system that can be difficult to diagnose. We train our model on single-cell data obtained from blood and cerebrospinal fluid (CSF) for a cohort of seven MS patients and six healthy adults (HA), resulting in 66,667 individual cells. We achieve % accuracy in predicting MS, outperforming other state-of-the-art methods such as a graph convolutional network and a random forest classifier. Further, we use the learned graph attention model to get insight into the features (cell types and genes) that are important for this prediction. The graph attention model also allow us to infer a new feature space for the cells that emphasizes the differences between the two conditions. Finally we use the attention weights to learn a new low-dimensional embedding that can be visualized. To the best of our knowledge, this is the first effort to use graph attention, and deep learning in general, to predict disease state from single-cell data. We envision applying this method to single-cell data for other diseases.
1. Introduction
Single cell RNA-sequencing (scRNA-seq) technology provides gene expression data for individual cells, yielding omics-scale information at single-cell resolution. The information contained within transcriptomes of individual cells can be used to identify rare cells, genes, and other changes associated with fundamental biological processes and pathological states. However, identifying hidden differences in cell pathophysiological trajectories is challenging. ScRNA-seq data typically contains gene count data for more than transcripts across - cells and has a high-degree of technical noise, and encompasses a large degree of biological variability (Chen et al., 2019; Kiselev et al., 2019). While these data promise to provide rich insight into complex systems that determine health and well-being, integrative computational tools are required to comprehensively learn about cell states from scRNA-seq data collected across cell, disease, and temporal modalities (Stuart and Satija, 2019).
Computational approaches have been developed to use scRNA-seq data to identify bio-markers for potential use in diagnostics (Gawel et al., 2019), to understand genetic factors underlying disease heterogeneity (Zeng and Dai, 2019), and to predict cellular response to experimental perturbations (Lotfollahi et al., 2019). In addition, several classifiers, using primarily non-deep learning methods, have been employed to predict cell-types from single-cell samples (Alquicira-Hernandez et al., 2019; Zheng and Wang, 2019). However, to the best of our knowledge, no computational approaches have been developed to harness scRNA-seq data to predict disease states for the use of transcriptomic technology in diagnosis (Poirion et al., 2016). Despite this gap, scRNA-seq data may revolutionize our understanding of the biological processes associated with various disease states in addition to providing personalized insight into a patient’s pathophysiological state. These kinds of omics-scale insights may be useful in tailoring treatments for personalized medicine (Karczewski and Snyder, 2018). We propose a learning approach that harnesses the rich-information content in a scRNA-seq dataset to characterize and predict two pathological states related to neuroinflammation.
Multiple sclerosis (MS) is a disease of the nervous system in which myelin, the insulating substance that surrounds nerve cell axons, is damaged by the body’s immune system (Thompson et al., 2018; Lublin et al., 1996). This damage causes individuals with MS to have neurological symptoms such as difficulty with coordination, vision impairment, pain, and fatigue, which can manifest acutely in episodic periods or lead to progressive decline of neurological function (Lublin et al., 1996). Genome-wide association studies have identified some genetic risk-factors associated with MS and highlighted the role of the immune system in the disease but to the best of our knowledge, no one has used transcriptomic data and modeling to study the association of transcriptomic markers with MS (Patsopoulos et al., 2019; Sawcer et al., 2014; Hafler et al., 2007). Lack of molecular mechanistic understanding of the pathology of MS caused by an aberrant immune system complicates the ability in diagnosing and characterizing MS; indeed, there is no single test to diagnose MS (Lorscheider et al., 2017). Few molecular MS markers are known (Ciccarelli et al., 2014). However, current indicators of MS are related to general neurological decline rather than the root causes of MS (Ciccarelli et al., 2014; Lorscheider et al., 2017). Given the central role of the immune system in MS, we relied on a dataset composed of cerebrospinal fluid (CSF) and blood, both of which contain a high-proportion of immune cells. The selection of an immune-rich single-cell sample is critical to identifying molecular markers that can used to predict MS disease-state and to aid in developing a diagnostic test based on single-cell transcriptomic technology.
The existence of disease-modifying treatments highlights the value of this information-rich scRNA-seq data, as it can be used to characterize personalized disease-states, which may be differentially targeted with personalized treatment (Lorscheider et al., 2017). Current diagnoses of MS relies on imaging, neurological symptoms observed by a clinician and differential diagnoses, and spinal fluid abnormalities (Thompson et al., 2018). Currently, personalized approaches using a genetic risk score, based on genome-wide association studies, have poor agreement with clinical and MRI measures (Patsopoulos et al., 2019; Lorscheider et al., 2017; Mühlau et al., 2016).
Several classes of bio-molecular networks like transcriptional regulatory networks, protein-protein interaction networks, and metabolic networks are modeled as graphs. Mathematical graph theory is a straightforward way to represent this information, and graph-based models can exploit the global and local characteristics of these networks relevant to cell biology. In recent years, Graph Neural Networks (GNNs) have been widely adopted in various tasks, such as graph classification (Duvenaud et al., 2015; Lee et al., 2019), link prediction (Zhang and Chen, 2018) and node classification (Kipf and Welling, 2017; Veličković et al., 2018; Yang et al., 2016). Various GNNs have been proven to be effective in achieving state-of-the-art performance in a variety of graph datasets such as social networks (Yang et al., 2016), citation networks (Veličković et al., 2018), recommender systems (Kipf and Welling, 2017; Yang et al., 2016) and protein-protein interaction networks (Veličković et al., 2018). The underlying graph structure is utilized by GNNs to operate convolution directly on graphs by passing node features to neighbors (Yang et al., 2016), or to perform convolution in the spectral domain by using the eigenbasis of the Graph Laplacian operator (Kipf and Welling, 2017). Since the introduction of the self-attention mechanism in the influential work (Vaswani et al., 2017), it has become extremely common to use self-attention for various sequence-sequence tasks like machine translations and learning representations. Self-attention allows the model to deal with variable sized inputs and focus on the most important part of the inputs. The self-attention mechanism has been introduced to the graph domains by (Veličković et al., 2018) and also developed by (Bottou and LeCun, 2005; Choi et al., 2017; Yun et al., 2019). In our work, we chose to utilize the Graph Attention Network (GAT) as introduced by (Veličković et al., 2018) to do node classification because of it’s high performance on complex datasets, its adaptability to unseen datasets, and the model’s interpretability. Figure 1 shows the workflow of our paper.
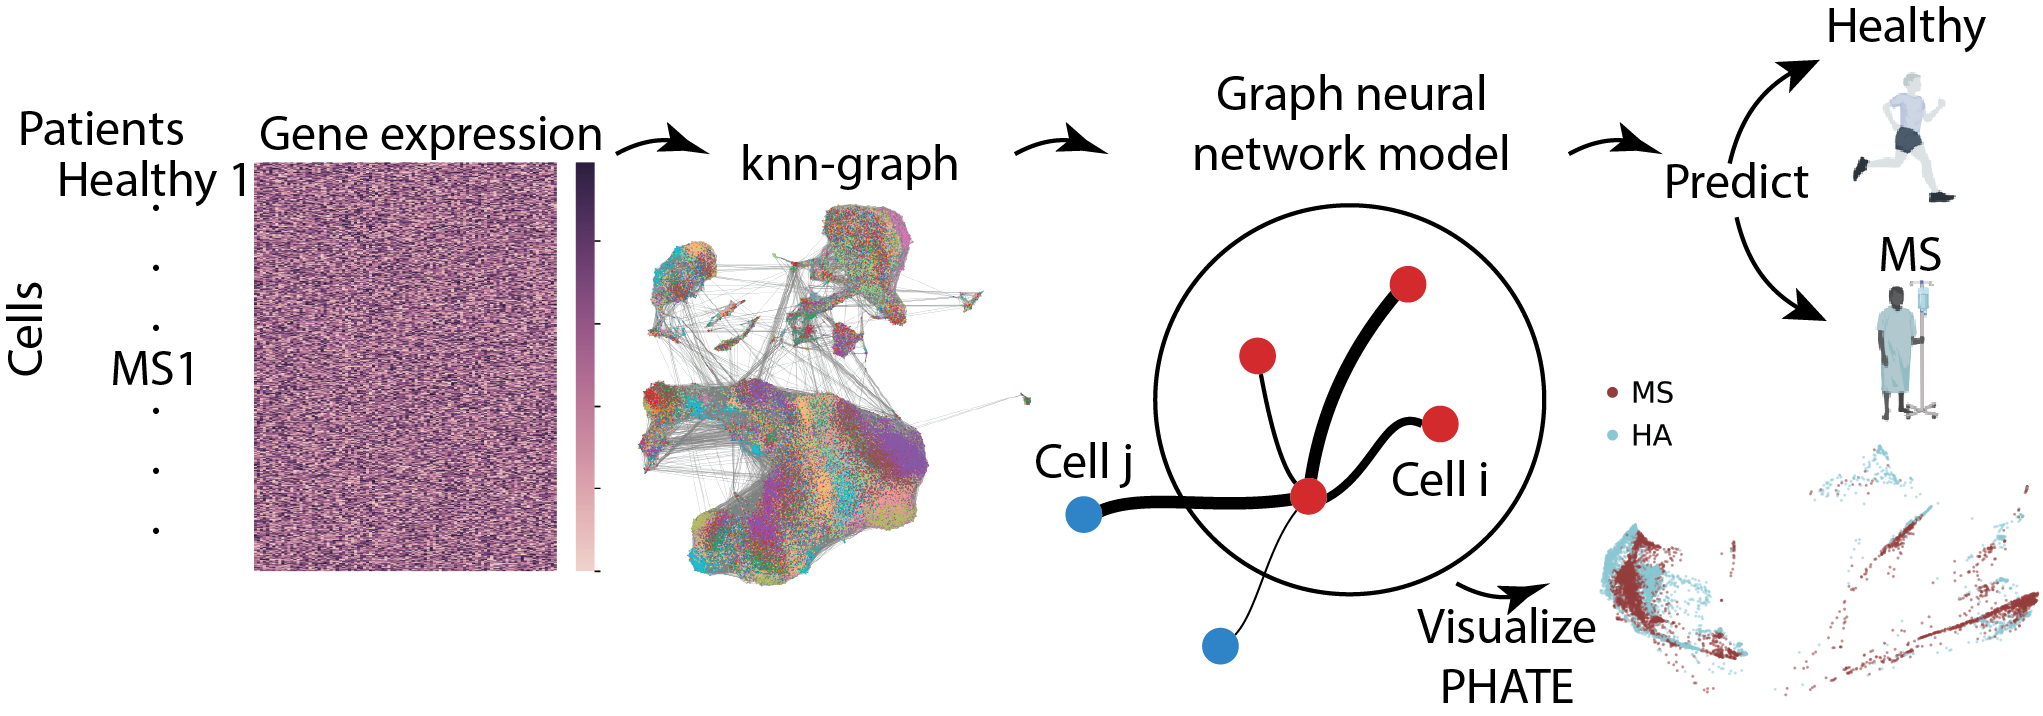
Workflow
Our contributions are as follows: (i) we use graph neural networks on single cell data to predict disease state of MS patients and healthy individuals, (ii) we use the attention weights matrix to visualize the new graphs learned by the model, (iii) we extract meaningful features from the model and investigate them in the context of existing biological knowledge on MS.
2. Datasets used
We used a pooled dataset composed of blood and cerebrospinal fluid (CSF) samples from MS patients and healthy adults (HA), constituting scRNA-seq samples with an average of cells per sample and about cells per patient. We performed standard scRNA-seq quality-control filtering steps to the raw data, including removing cells expressing % mitochondrial genes, normalizing gene counts by the sequenced library size per cell, square-root transforming gene counts, and removing mitochondrial and ribosomal protein transcripts from downstream analysis (Wolf et al., 2018). After the preprocessing steps our dataset is composed of cells with gene features per cell. Figure 2(A) shows our full graph (used in transductive task) colored by the individual patients and figure 2(B) is colored by various cell types. Variability between samples dominates biological variability in reduced dimensional embeddings and these batch effects complicate model inference of biological features (Büttner et al., 2019). We treat each cell as a node, so our dataset has features per node, with high variability across features. The number of features is an order of magnitude higher than the citation, social-network, and protein-protein interaction datasets previously used by GNNs. This feature matrix was used to compute a k-nearest neighbor graph from euclidean distances in PCA reduced space ( neighbors and principal components) and clustered by the Louvain algorithm to identify cell types within the pooled dataset (McInnes et al., 2018; Blondel et al., 2008). This led to the unsupervised identification of at least cell types within the pooled dataset, including about % T cells broken into various lineages and about % B cells, in addition to other immune and peripheral blood mononuclear cells, including macrophages, monocytes, natural-killer cells, and platelets. The nodes are classified as healthy or MS. Thus the classification problem we are interested in is at the cell level.
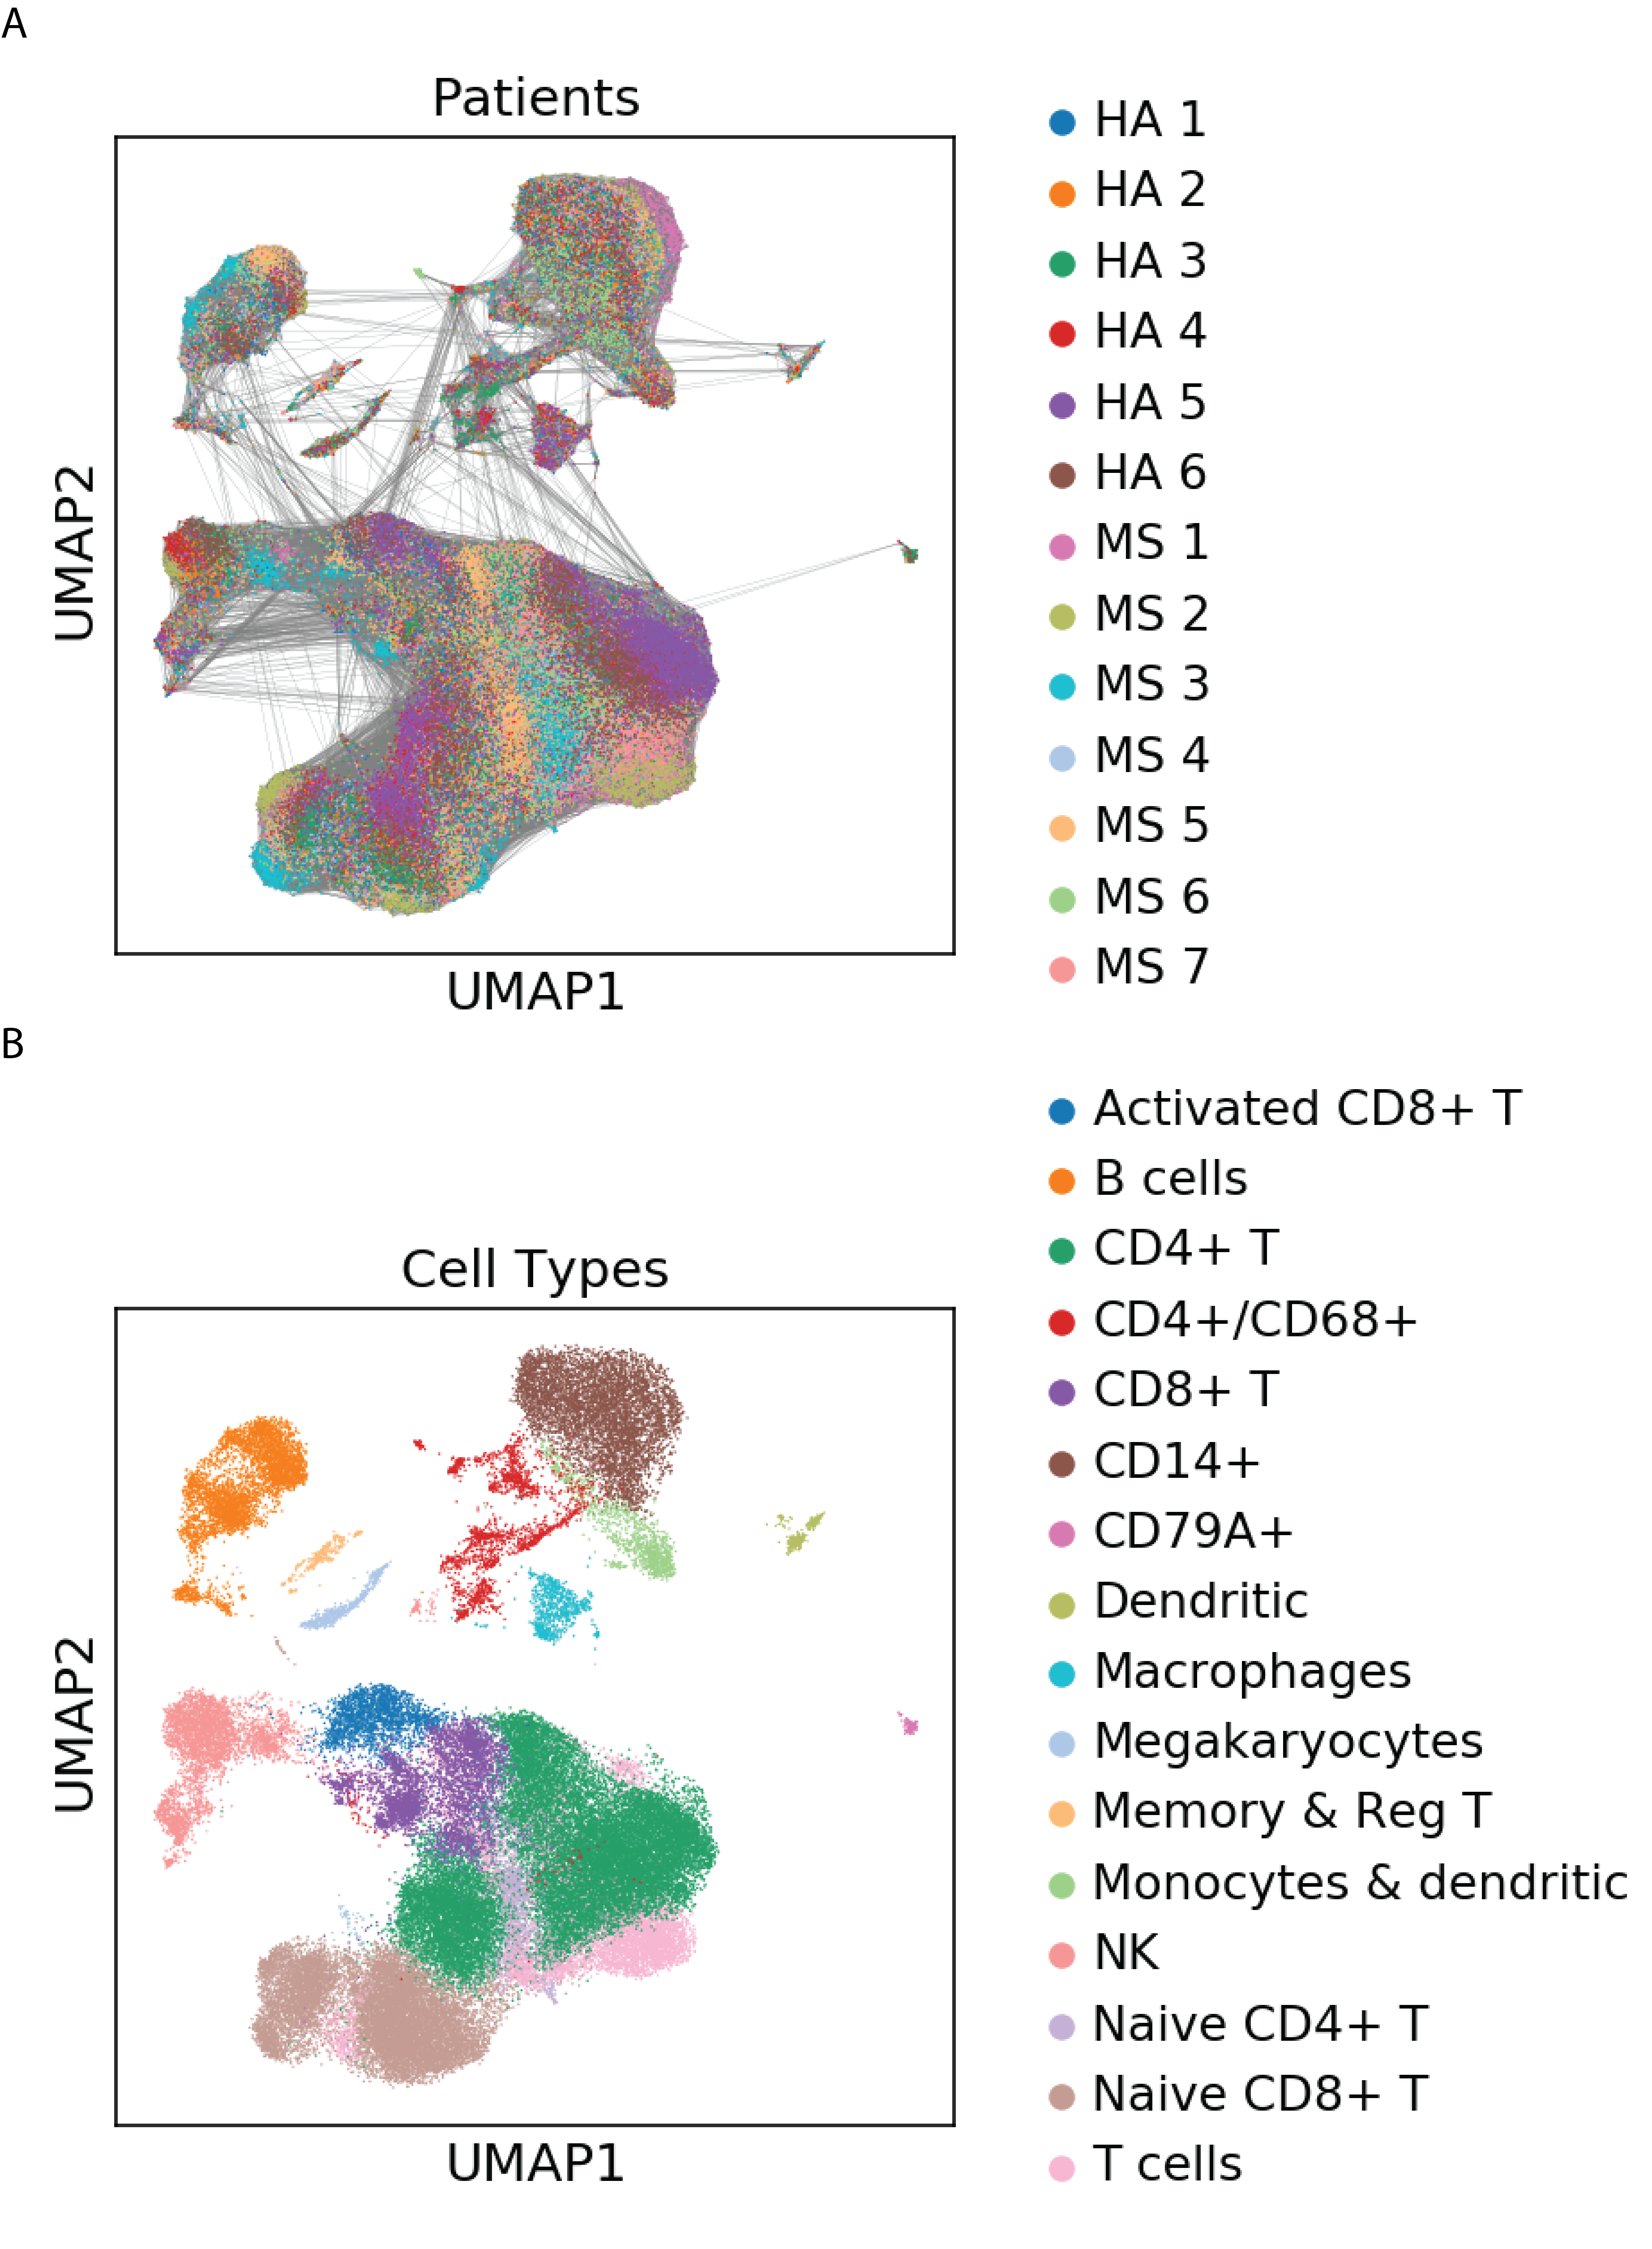
Various cell types in our dataset
We use this dataset to perform two tasks: (i) inductive inference, and (ii) transductive inference. For the transduction task, we randomly assign of the nodes for validation and for testing while keeping the ratio of healthy and MS cells the same as in the full dataset. Then we randomly mask the labels of of the training, validation and the test set. Thus we can think of our problem as having a large graph where half of the graph is unlabeled and our goal is to predict the labels based on the labels of the nodes in the graph and the features of the node. With the transductive setup in mind, we feed in the features of all nodes during training and our goal is to predict the masked labels.
For the induction task, we randomly choose a healthy adult and a MS patient each for the validation and test sets and the remaining MS patients and healthy adults for training. We construct separate knn-graphs for the training, validation, and test sets just like before. It is important to note that the testing graphs are completely unseen during training. Table 1 gives a complete description of the datasets used in various experiments.
| Task | Train | Dev | Test | |
|---|---|---|---|---|
| Inductive | # Nodes | |||
| # Edges | ||||
| # Features | ||||
| # Classes | ||||
| # Graphs | ||||
| Transductive | # Nodes | |||
| # Features | ||||
| # Classes | ||||
| # Edges | ||||
2.1. Related work
Machine learning, and particularly deep learning have been widely used in the medical domain to predict diseases but mostly using medical images or EHR data. Machine learning has also been used on scRNA-seq data for data de-noising, batch correction, data imputation to correct for sparse signal detection or dropout, unsupervised clustering, cell-type prediction (Kiselev et al., 2019; Torroja and Sanchez-Cabo, 2019; Arisdakessian et al., 2019; Alquicira-Hernandez et al., 2019) and low-dimensional visualization of samples relevant to human health (Amodio et al., 2019; Torroja and Sanchez-Cabo, 2019). Recently, transfer learning (using an autoencoder) has been used to extract new gene-gene interactions (Wang et al., 2019) and random walks have been used to predict gene responses to drugs (Harikumar et al., 2019). In the biomedical domain GNNs have mostly been used for prediction of protein-protein interactions (Veličković et al., 2018) and gene-gene interactions(Zhou et al., 2018; Harikumar et al., 2019). However, to the best of our knowledge, predicting diseases from single-cell RNA seq data using state-of-the-art methods have not been tried successfully.
3. Architecture of our model
We use the Graph Attention Network by (Veličković et al., 2018) and we follow the exposition in (Veličković et al., 2018). In this section we describe our model in detail. The building block of our network is the graph attention layer. The input to our layer is a set of node features, , where , is the number of nodes, and is the number of features in each node. The layer produces a new set of node features (of possibly different cardinality ) as its output, where .
We apply a linear transformation called the weight matrix, to every node. The weight matrix is initialized with Glorot initialization (Glorot and Bengio, 2010). Self-attention is then computed on the nodes, i.e. a shared attention mechanism
| (1) |
that computes attention coefficients
| (2) |
We treat these ’s as importance scores of node ’s features to that of node . This is the main difference between a graph attention network and a graph convolution network (Kipf and Welling, 2017). Unlike (Kipf and Welling, 2017), different importance scores are given to different nodes in the same neighborhood, which allows for greater adaptability of the model to various complicated datasets like ours.
Furthermore, we normalize these ’s across all choices of , where lies in some neighborhood of using the softmax function:
| (3) |
where is some neighborhood of the node . In all our applications, the graphs are the KNN graphs and is the first order -neighbors of the node . Thus in practice, we only compute (and thus ) for all nodes in the first-order neighborhood of the node , instead of all pairs of nodes and .
In our experiments, the attention mechanism is a single-layer feedforward neural network on which we apply the LeakyReLU non-linearity. The normalized attention coefficients are then used to compute a linear combination of the features corresponding to them, to serve as the final output features for every node (after applying a nonlinearity, ):
| (4) |
As is now common in attention based networks, we use multi-head attention, similar to (Vaswani et al., 2017; Veličković et al., 2018). In this case, each attention head learns an unique set of attention weights independent of the other heads in a given layer. Specifically, independent attention mechanisms execute the transformation of Equation , and then their features are concatenated, resulting in the following output feature representation:
| (5) |
where denotes the concatenation operation, are normalized attention coefficients computed by the -th
attention mechanism and is the corresponding input linear transformation’s weight matrix.
Note that, in the final output, each node will have features.
Finally, in the final (prediction) layer of the network, we first employ averaging, and then apply the final nonlinearity (logistic sigmoid for our classification problems). Thus the equation for the final layer is:
| (6) |
We also use weight clipping to prevent the gradients from exploding. Table 2 shows all the hyperparameters in our models used for the experiments. Our code is written in PyTorch and is publicly available at https://github.com/vandijklab/scGAT.
Another reason of working with Graph Attention Networks is it’s power of interpretability. It is easy to visualize the attention heads, i.e. the attention scores between various nodes by a head in any given layer. Due to memory issues, we implemented a sparse version of the code of (Veličković et al., 2018).
4. Experiments
In this section we will explain in detail our experiments. We compare our work with random forests, a multilayer perceptrons, Graph Convolution Networks as introduced in (Kipf and Welling, 2017), and a dummy estimator. Table 3 gives complete details of our results for the following tasks. All reported numbers are from the test sets. We also experimented with changing the default hyperparameters like changing the width and breadth of the model, the learning rate, optimizers, losses, and the dropout rate. However the best results were obtained by our default hyperparameters.
Generally all deep learning models are trained by stochastic gradient descent which requires us to minibatch our graphs. To breakdown a large graph for memory purposes and fast efficient training, we follow the algorithm in (Chiang et al., 2019) which is implemented in PyTorch Geometric. For the inductive task, we break up our training graph into roughly equal subgraphs and use a batch size of graphs. The average number of nodes in each batch is . But we do not split the the test or the validation graphs. For the transductive task, we break our graph as before in subgraphs and use a batch size of subgraphs. The average number of nodes per subgraph in a batch is .
| Graph Attention Network | Graph Convolution Network | |
| Number of layers | ||
| Hidden_size | ||
| Attention Heads | N/A | |
| Optimizer | Adagrad | Adagrad |
| clip_grad_norm | ||
| learning rate scheduler | cosine_decay & st decay steps = | cosine_decay & st decay steps = |
| weight_decay | ||
| Batch size | ||
| Dropout | ||
| Slope in LeakyRelu | ||
| Training Epochs | ||
| Early stopping |
4.1. Transductive learning
We use our single cell dataset and we follow the transductive learning setup as in (Yang et al., 2016). The transductive setup implies that during training the model has access to all the nodes’ feature vectors. The predictive power of the model is then evaluated on the masked test nodes and we use masked validation nodes for validation purposes. Our main task is to predict if a cell is healthy or has MS. We ran our GAT model times.
| Task | Model | Accuracy |
|---|---|---|
| Random | ||
| Inductive | MLP | |
| Random Forest | ||
| Graph Convolutional Network | ||
| Graph Attention Network(our) | ||
| Transductive | Graph Convolutional Network | |
| Graph Attention Network(our) |
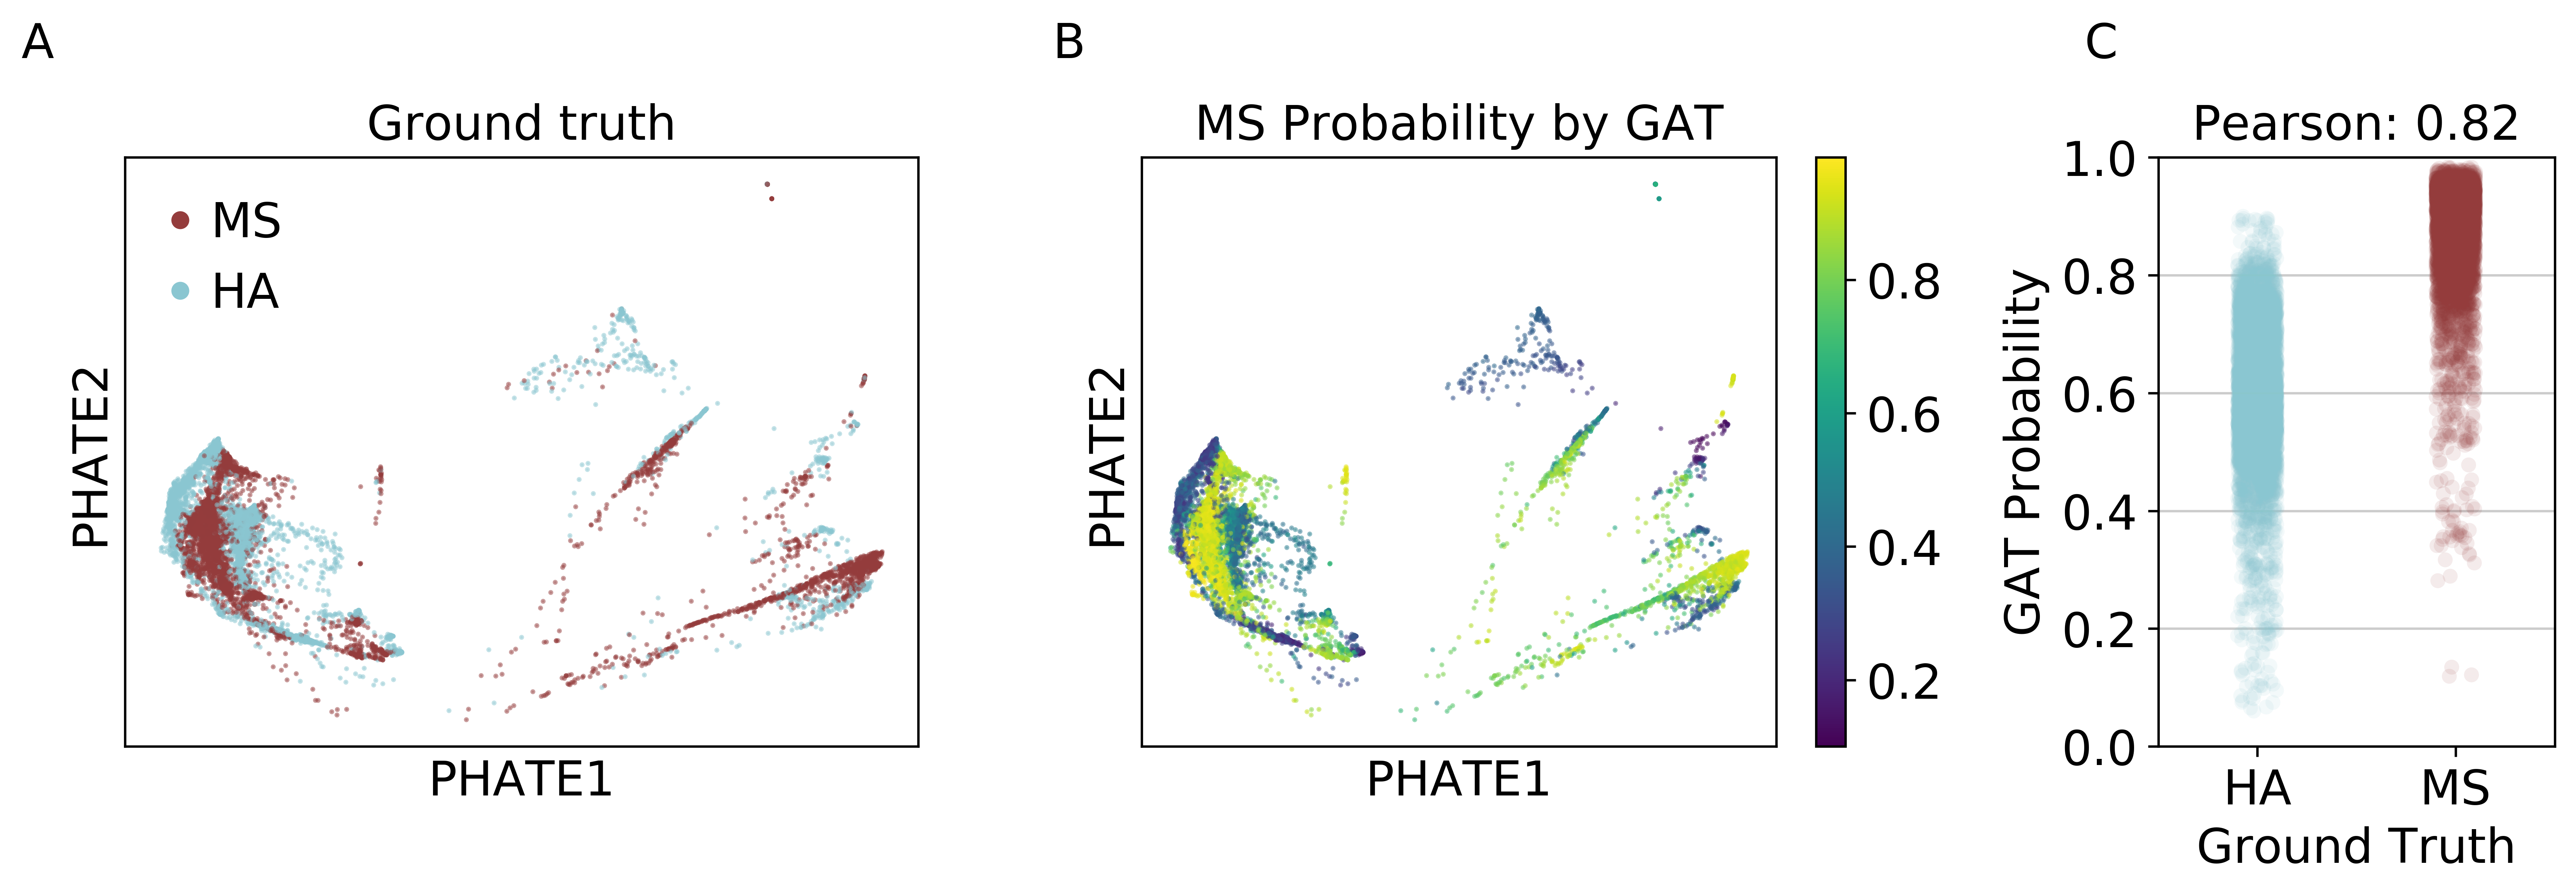
Visualizing MS predictions vs the ground truth via Phate.
4.2. Inductive learning
For this task we again use our single cell dataset. We have persons’ blood and CSF data and out of them of them have MS and the rest are healthy. We randomly choose a blood and CSF data of a healthy adult and a MS patient each for the validation and test sets and the remaining MS patients and healthy adults for training. We construct separate knn-graphs for the training, validation, and the test sets. We ran our GAT model times.
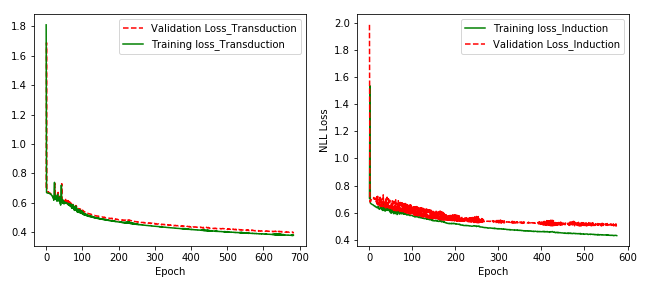
Figure 4 shows the loss of our model for the induction and the transduction tasks.
Visualizing MS predictions vs the ground truth via PHATE.
5. Discussion of our results
Encouraged by the predictive ability of our model in both transductive and inductive tasks, we take a deeper look at the attention heads and attention weights at various layers of our model. In this section, we will extract meaningful biological information from the attention heads.
5.1. Finding interesting gene markers
We look at where stands for transpose and stands for the learned weight matrix for head in layer . in our case is an matrix where is the size of the hidden dimension. For each row of each , we take the max of the absolute value and we define
| (7) |
and then we pick the highest for each . We can think of these genes as the most important features the model learns to discriminate between healthy and MS cells.
A heatmap of these features for the model trained in the inductive task is shown in figure 5. We are encouraged to find IL2RG as a learned feature in discriminating between healthy and MS cells. The interleukin-2 receptor (IL2R) is involved in a signaling pathway that is essential for T cell function and genetic variants of IL-2R are associated with various autoimmune disorders, including MS (Cerosaletti et al., 2013; Hafler et al., 2007). In addition, we are encouraged that the network gives a high weight to CD19, a marker for B cells, since B cells are targeted by therapeutics and is thought to contribute to MS by secreting autoreactive antibodies that cause neuroinflammation and demyelination (Hauser et al., 2017). Gene Ontology of the other identified features revealed that out of mapped genes are involved in the regulation of the hormone secretion while a number of other genes in our list are involved in the regulation of the nerve cell development. Lipid metabolism and nerve cell development are critical to normal myelination, so alterations to these processes may lead to a triggering of the autoimmune system and cause inflammation related to development of MS pathologies (Thompson et al., 2018; Gafson et al., 2017).
Thus it is encouraging to see that representations learned by our model align with the medical knowledge. Given the paucity of molecular markers that can characterize MS disease states, other than genes identified through genome-wide association studies and metabolites indicative of neurological degeneration, we presume that our model and this novel list of gene features will guide further experimental work into the pathophysiology of MS (Lorscheider et al., 2017). Broadly, this feature selection approach promises to reveal biomarkers of MS disease pathologies, which may be used for more cost-effective diagnostic testing than the single-cell technologies affords like DNA microarray screening or measuring gene expression by flow cytometry (Gafson et al., 2017).
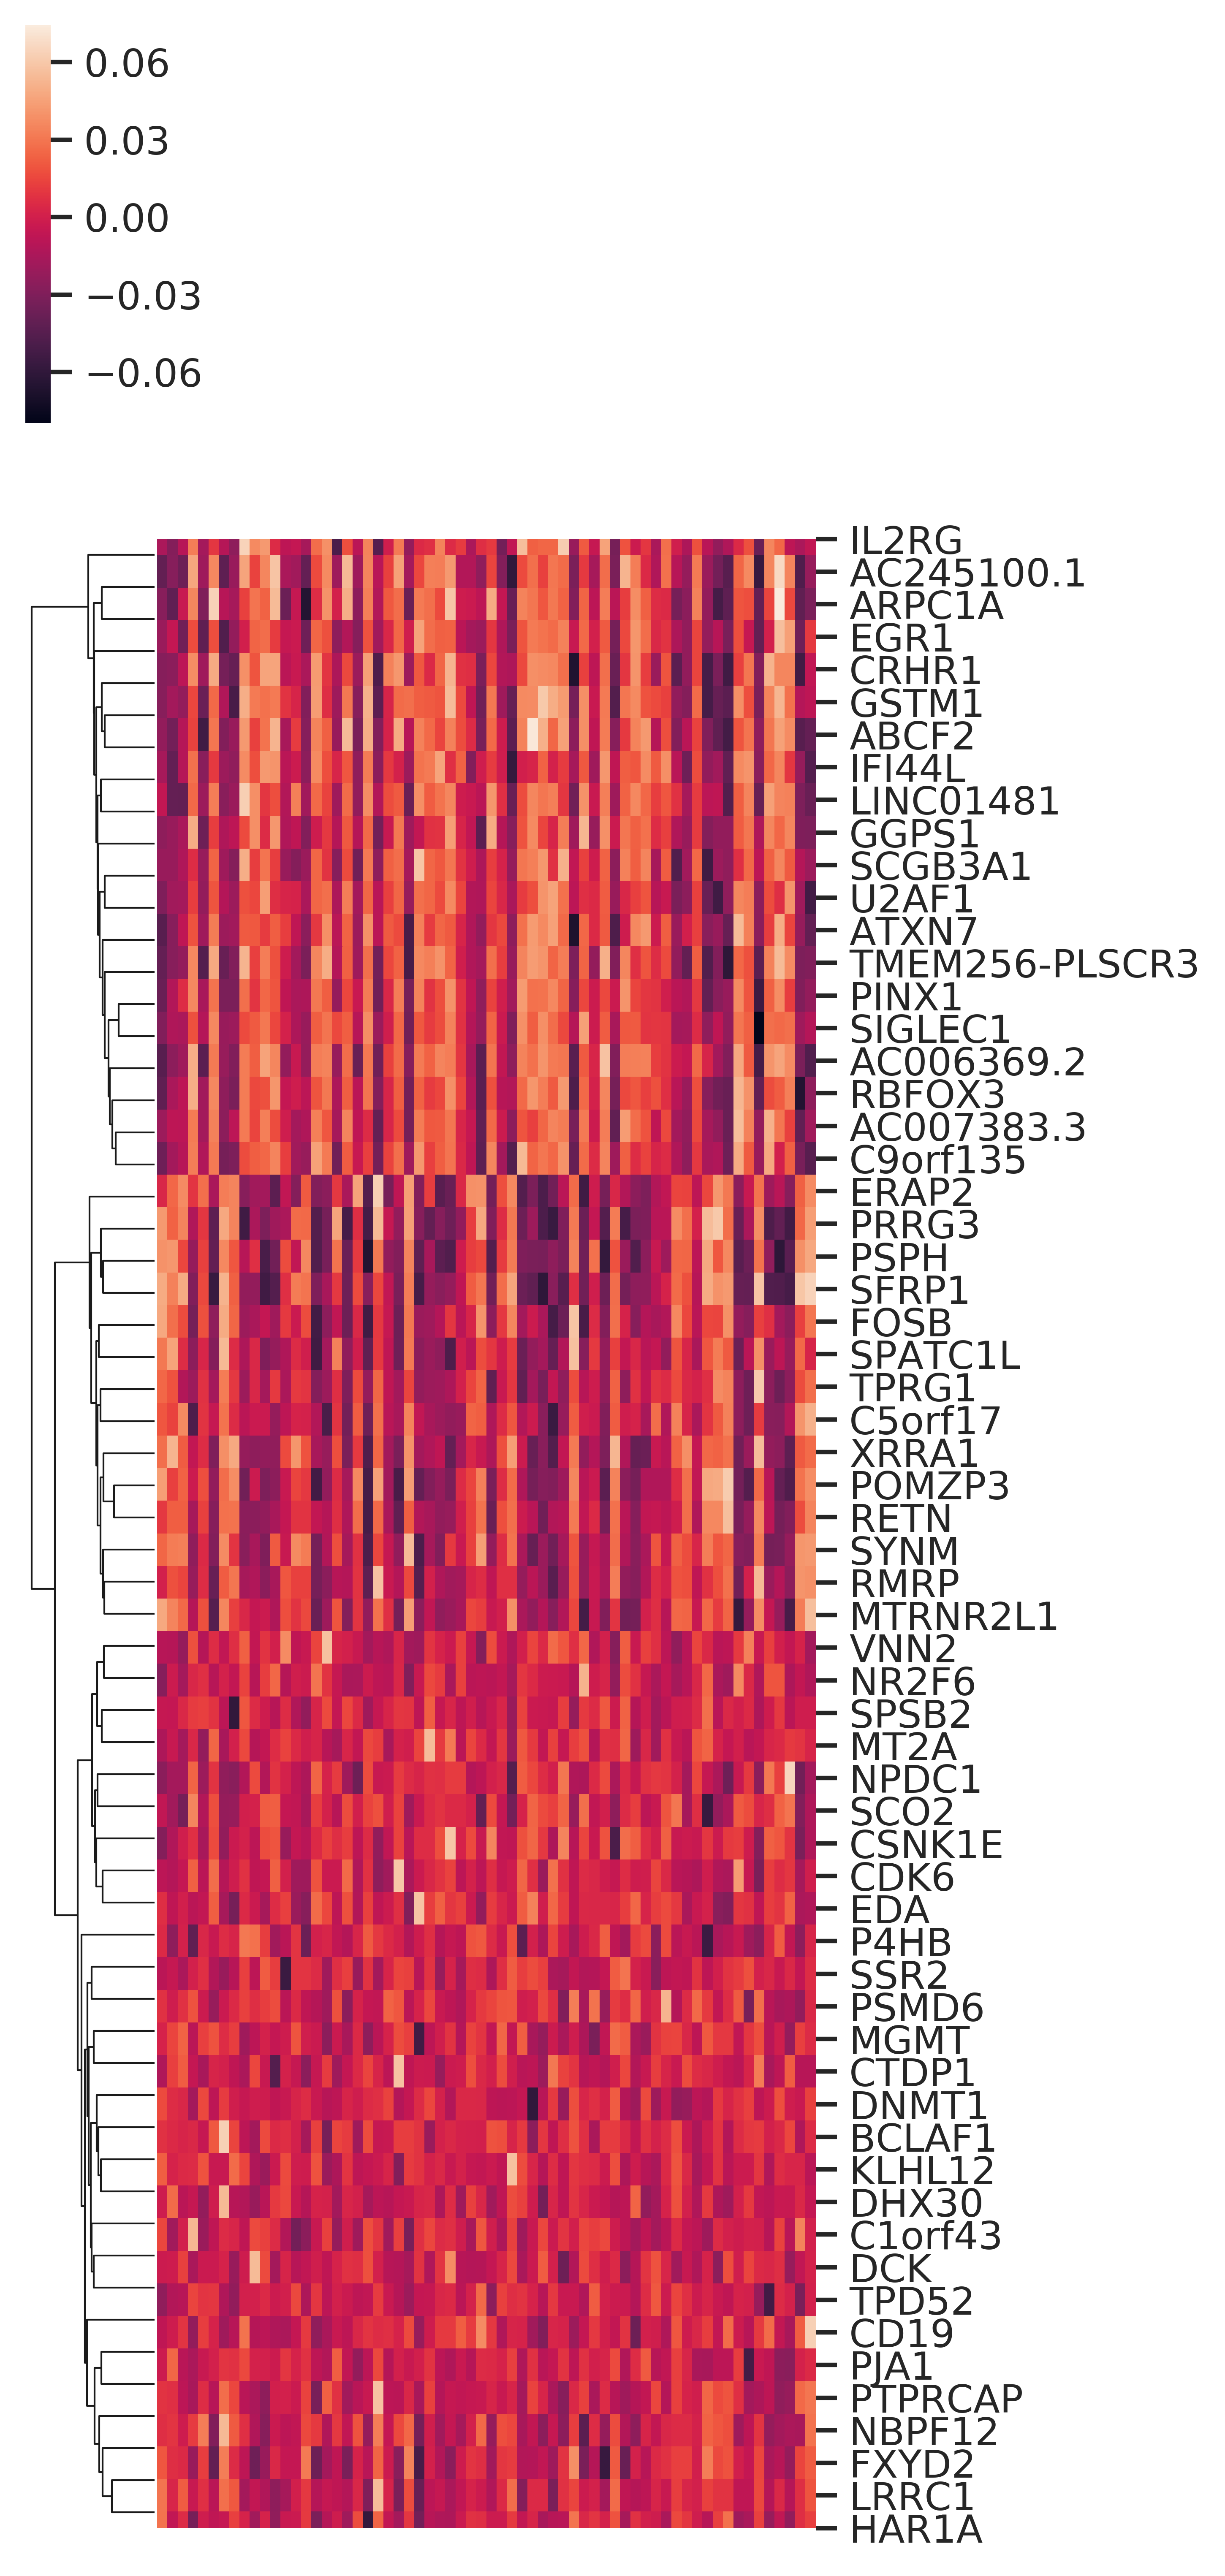
Gene list.
5.2. Finding cell types most prototypical of MS
In both the tasks, we computed the top cells that have the highest predicted probability of being MS. These are the cells that are strongly indicative of MS. We noted that all of these cells are from patients’ CSF. In contrast, the most prototypical healthy cells are approximately evenly split between being sourced from blood or CSF samples. This confirms the common medical hypothesis that patients’ CSF has a higher degree of information relevant to central nervous system inflammation than blood cell samples (Lycke and Zetterberg, 2017). In addition, these observations support that single-cell technology may supplement existing neuroinflammation diagnostic criteria relying on detection of spinal fluid abnormalities (Lycke and Zetterberg, 2017; Lorscheider et al., 2017).
We assess the predicted probability of being MS, stratified by cell type in figure 6A. Cells involved in innate immunity, such as macrophages and natural-killer cells, have a relatively lower average predicted probability of being MS compared to cells involved in adaptive immunity, such as B cells and T cells. This reflects the current medical understanding of the immune system’s role in MS and the key role that adaptive immunity plays in autoimmune disorders and neuroinflammation more broadly (Lorscheider et al., 2017; Sawcer et al., 2011; Gay et al., 1997). This suggests that our model is tuned to recapitulate biological knowledge.
We assess the predicted probability of being MS, stratified by patient in figure 6B. MS is known to present in different forms and the severity of the disease can vary across patients (Lublin et al., 1996). Our model performs a node classification task, yielding the predicted probability of being MS for every cell drawn from a single patient. Thus, a single patient can have cells that are more prototypically healthy than MS. The average predicted probability is as low as for healthy patients and as high as for MS patients in the transduction task. Both the transduction and induction tasks have models that achieve good discriminability between disease-states, with a Pearson’s correlation coefficient of and , respectively.
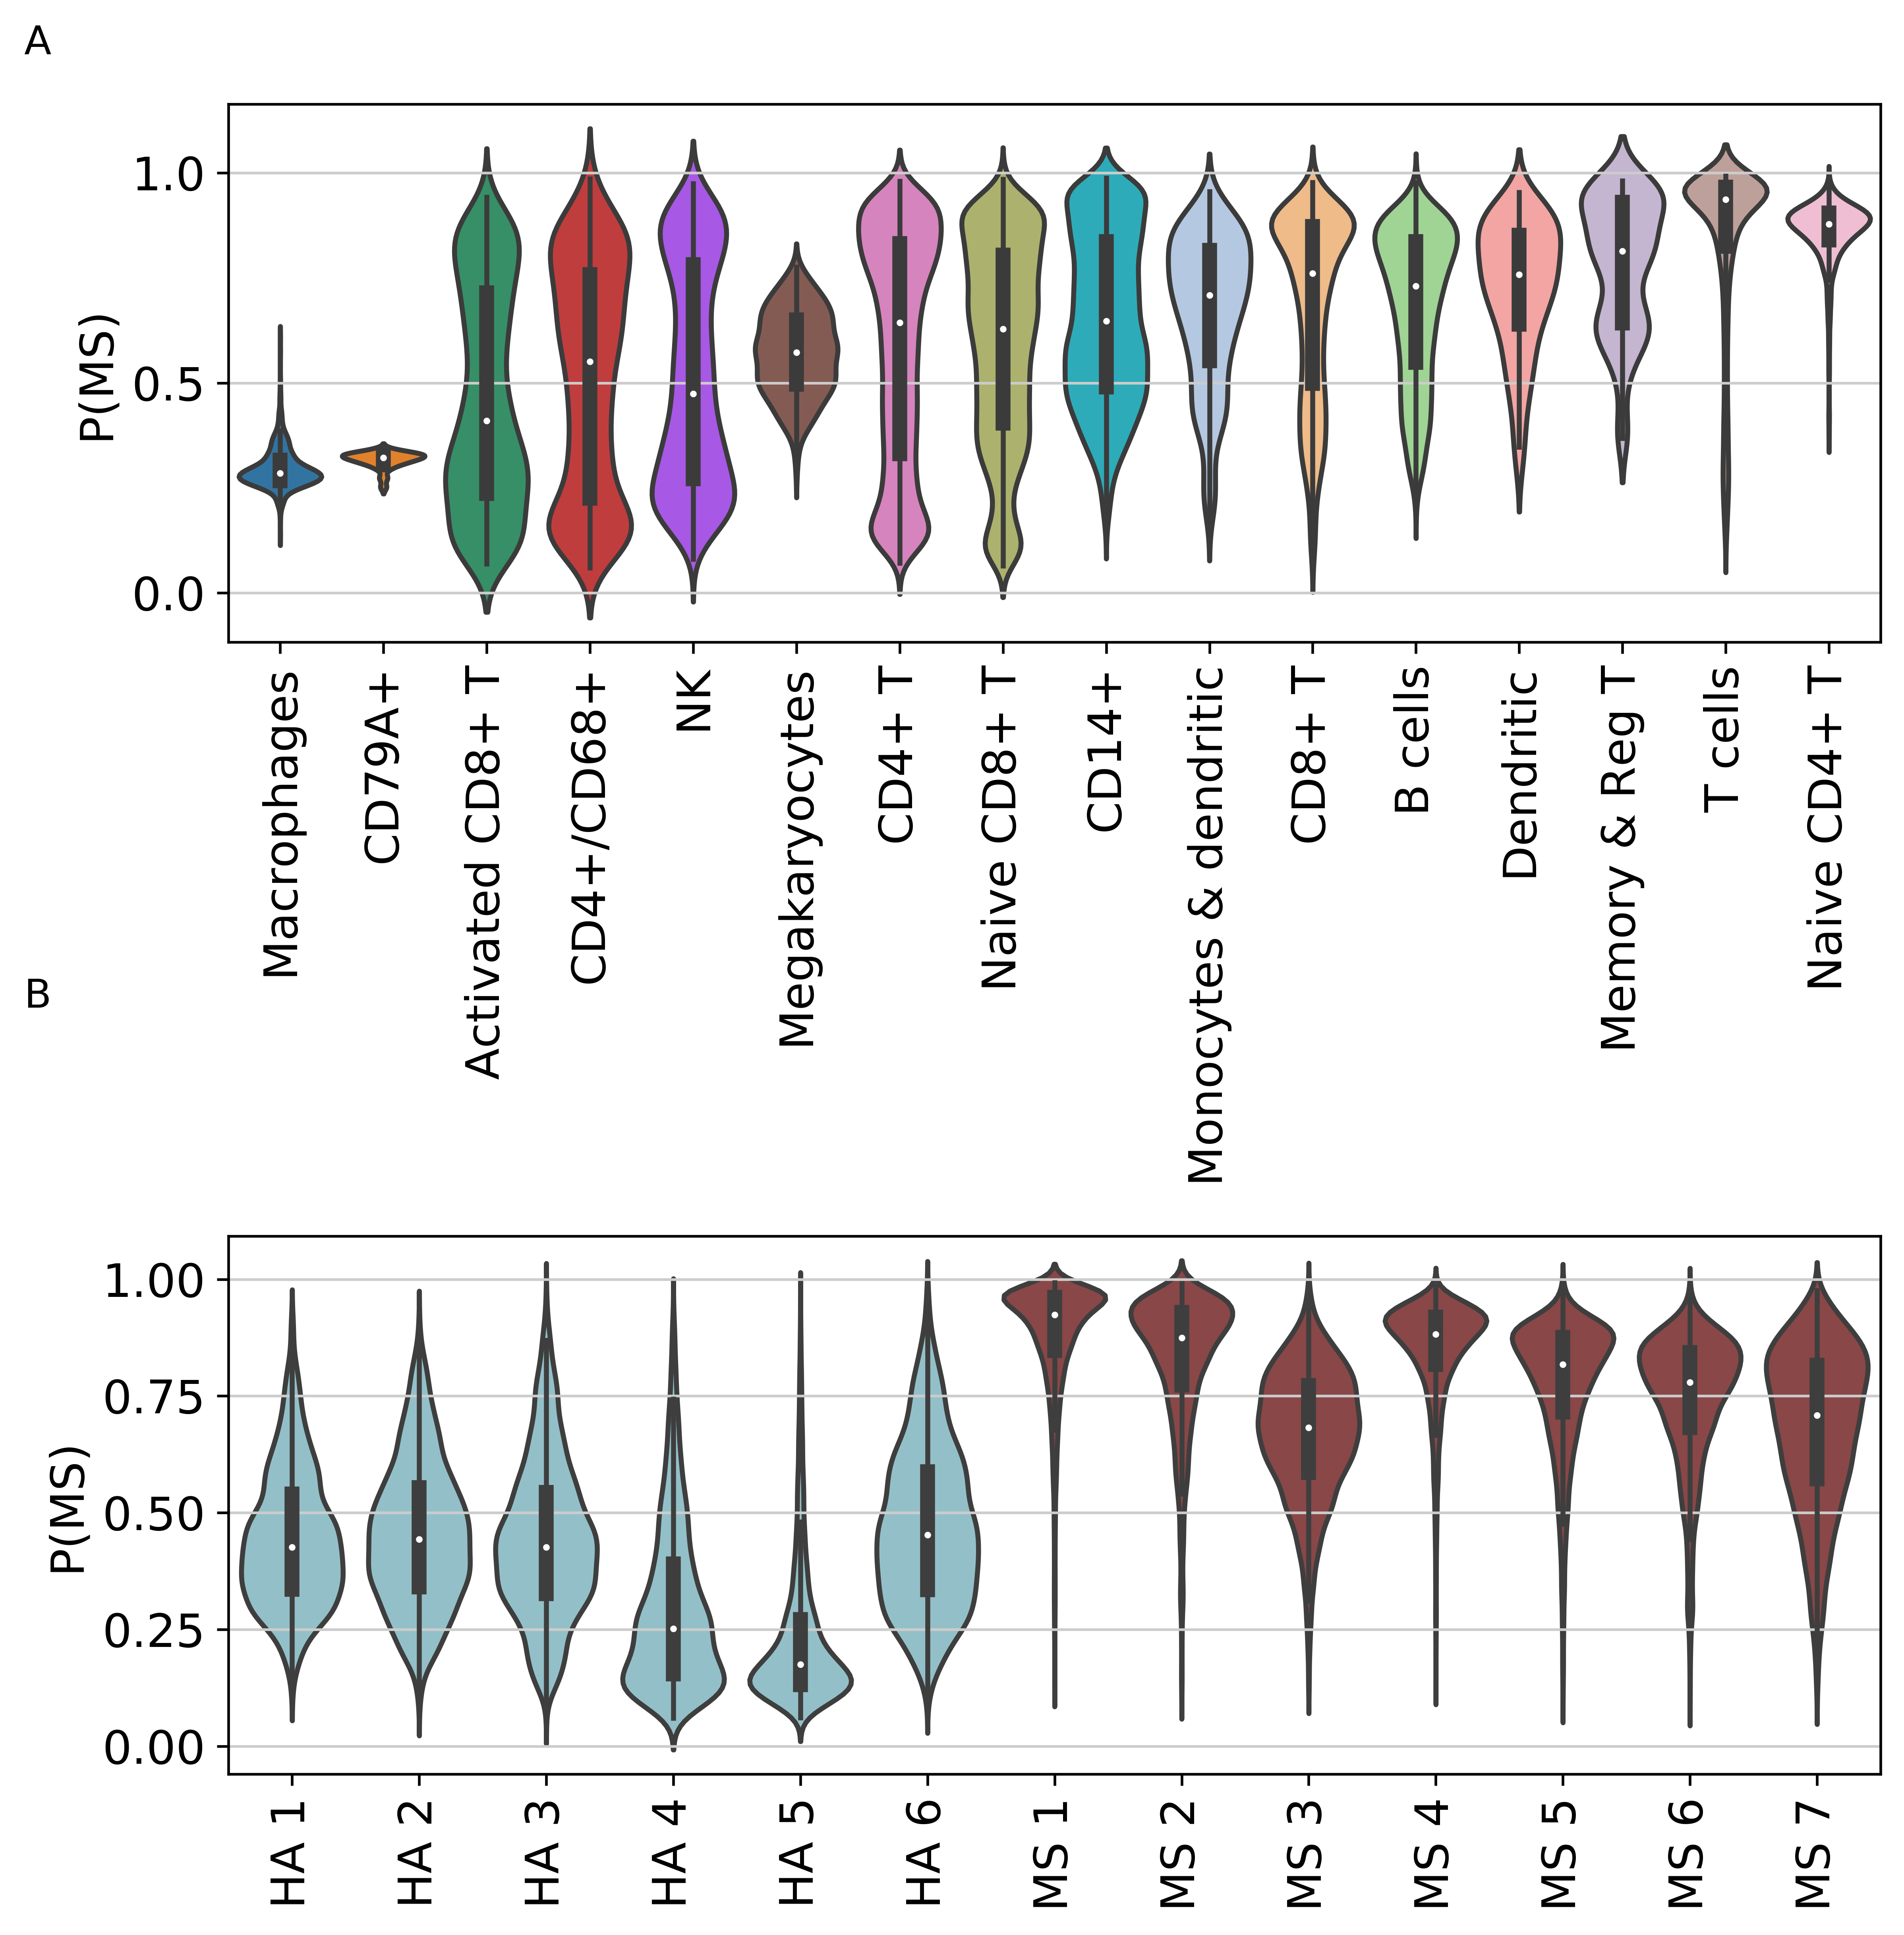
Cell type preds.
5.3. Visualizing Attention heads
In this subsection, we will take a deeper look at the features that our GAT model learned and visualize the latent space using (McInnes et al., 2018) and (Wolf et al., 2018). We can construct a matrix whose entry is as defined by equation 3 for each head in the first layer. We can think of these attention matrices as normalized adjacency matrix of a directed graph (i.e. the stochastic matrix one obtains from normalizing the adjacency matrix of a graph).
And we can feed it into PHATE (figure 7), allowing us to visualize the new graphs that our model has learned. We can easily see that head and head learn very different graphs. On the other hand, we can look at the learned as in equation 4 by each head in each layer which we view as the new features or the latent space. Just as before, we can feed these new features into a manifold learning algorithm and can construct new KNN graphs (with neighbors) for visualization with UMAP, as shown in the figure 8 for a dimensional feature space constructed by concatenating the hidden units for each each head per node. Here we see that the learned latent space separates healthy and MS cells in the low-dimensional embedding. This further supports that our model learns to discriminate between healthy and MS labels.
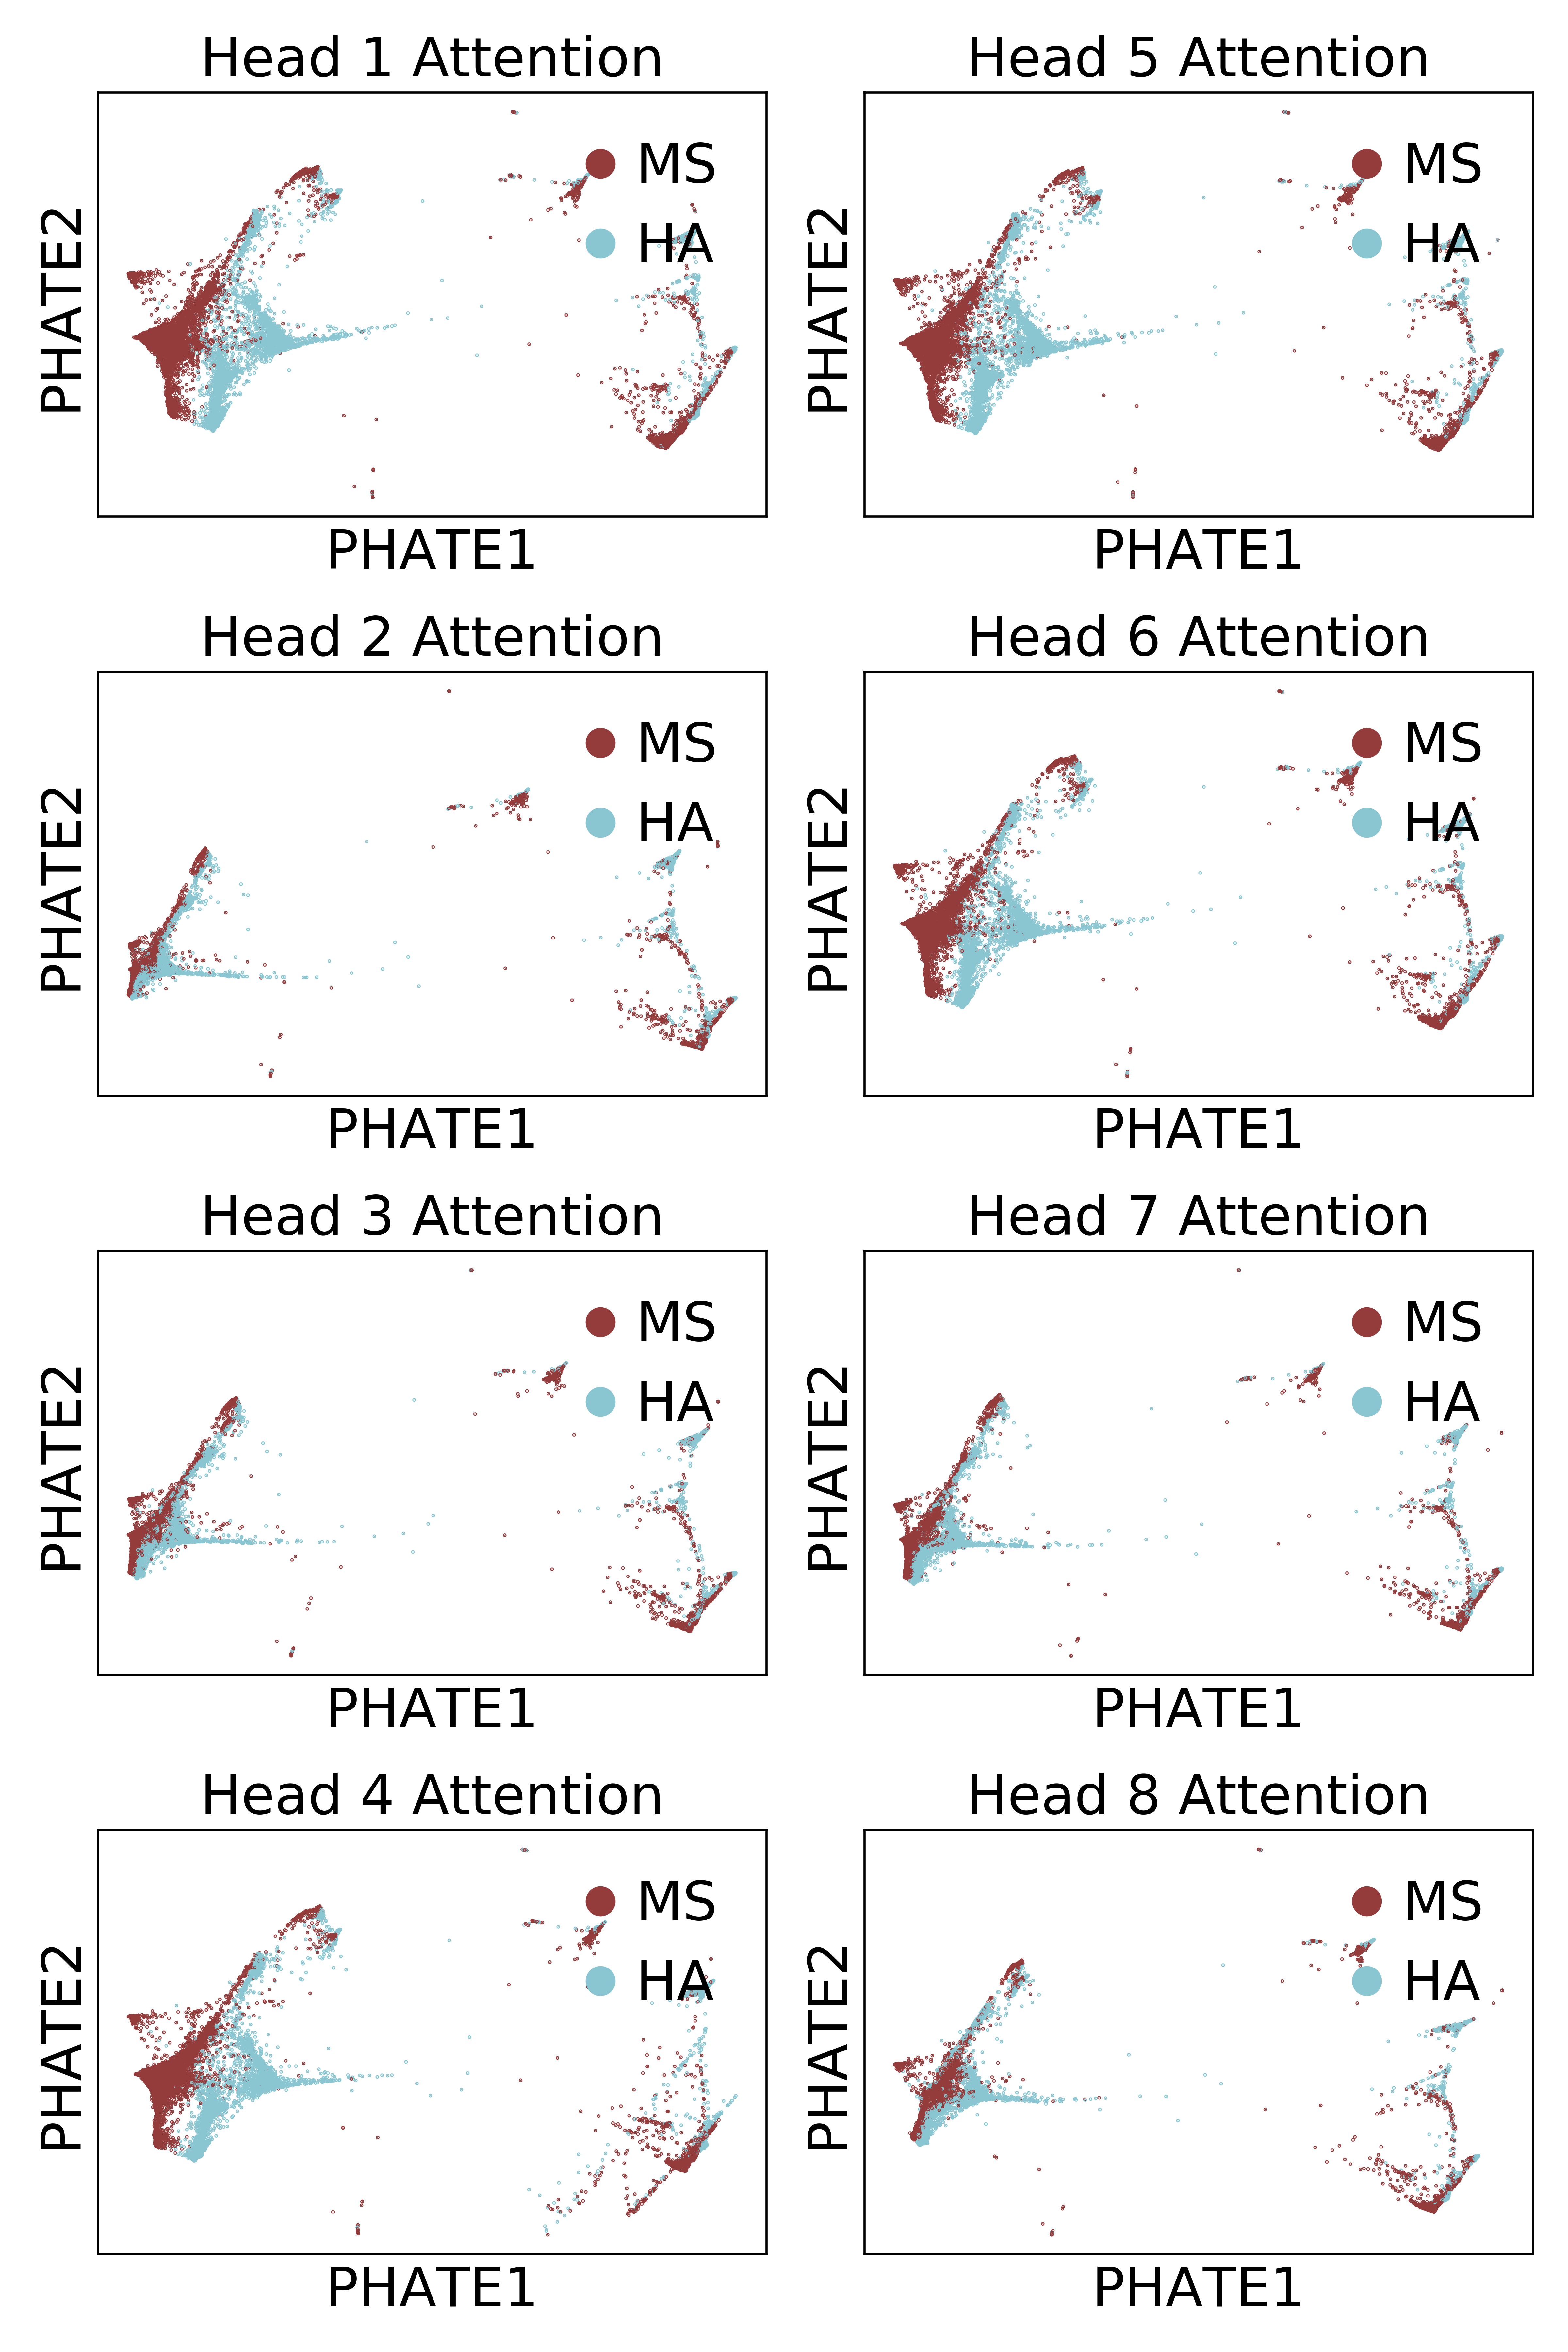
Visualizing learned graphs.
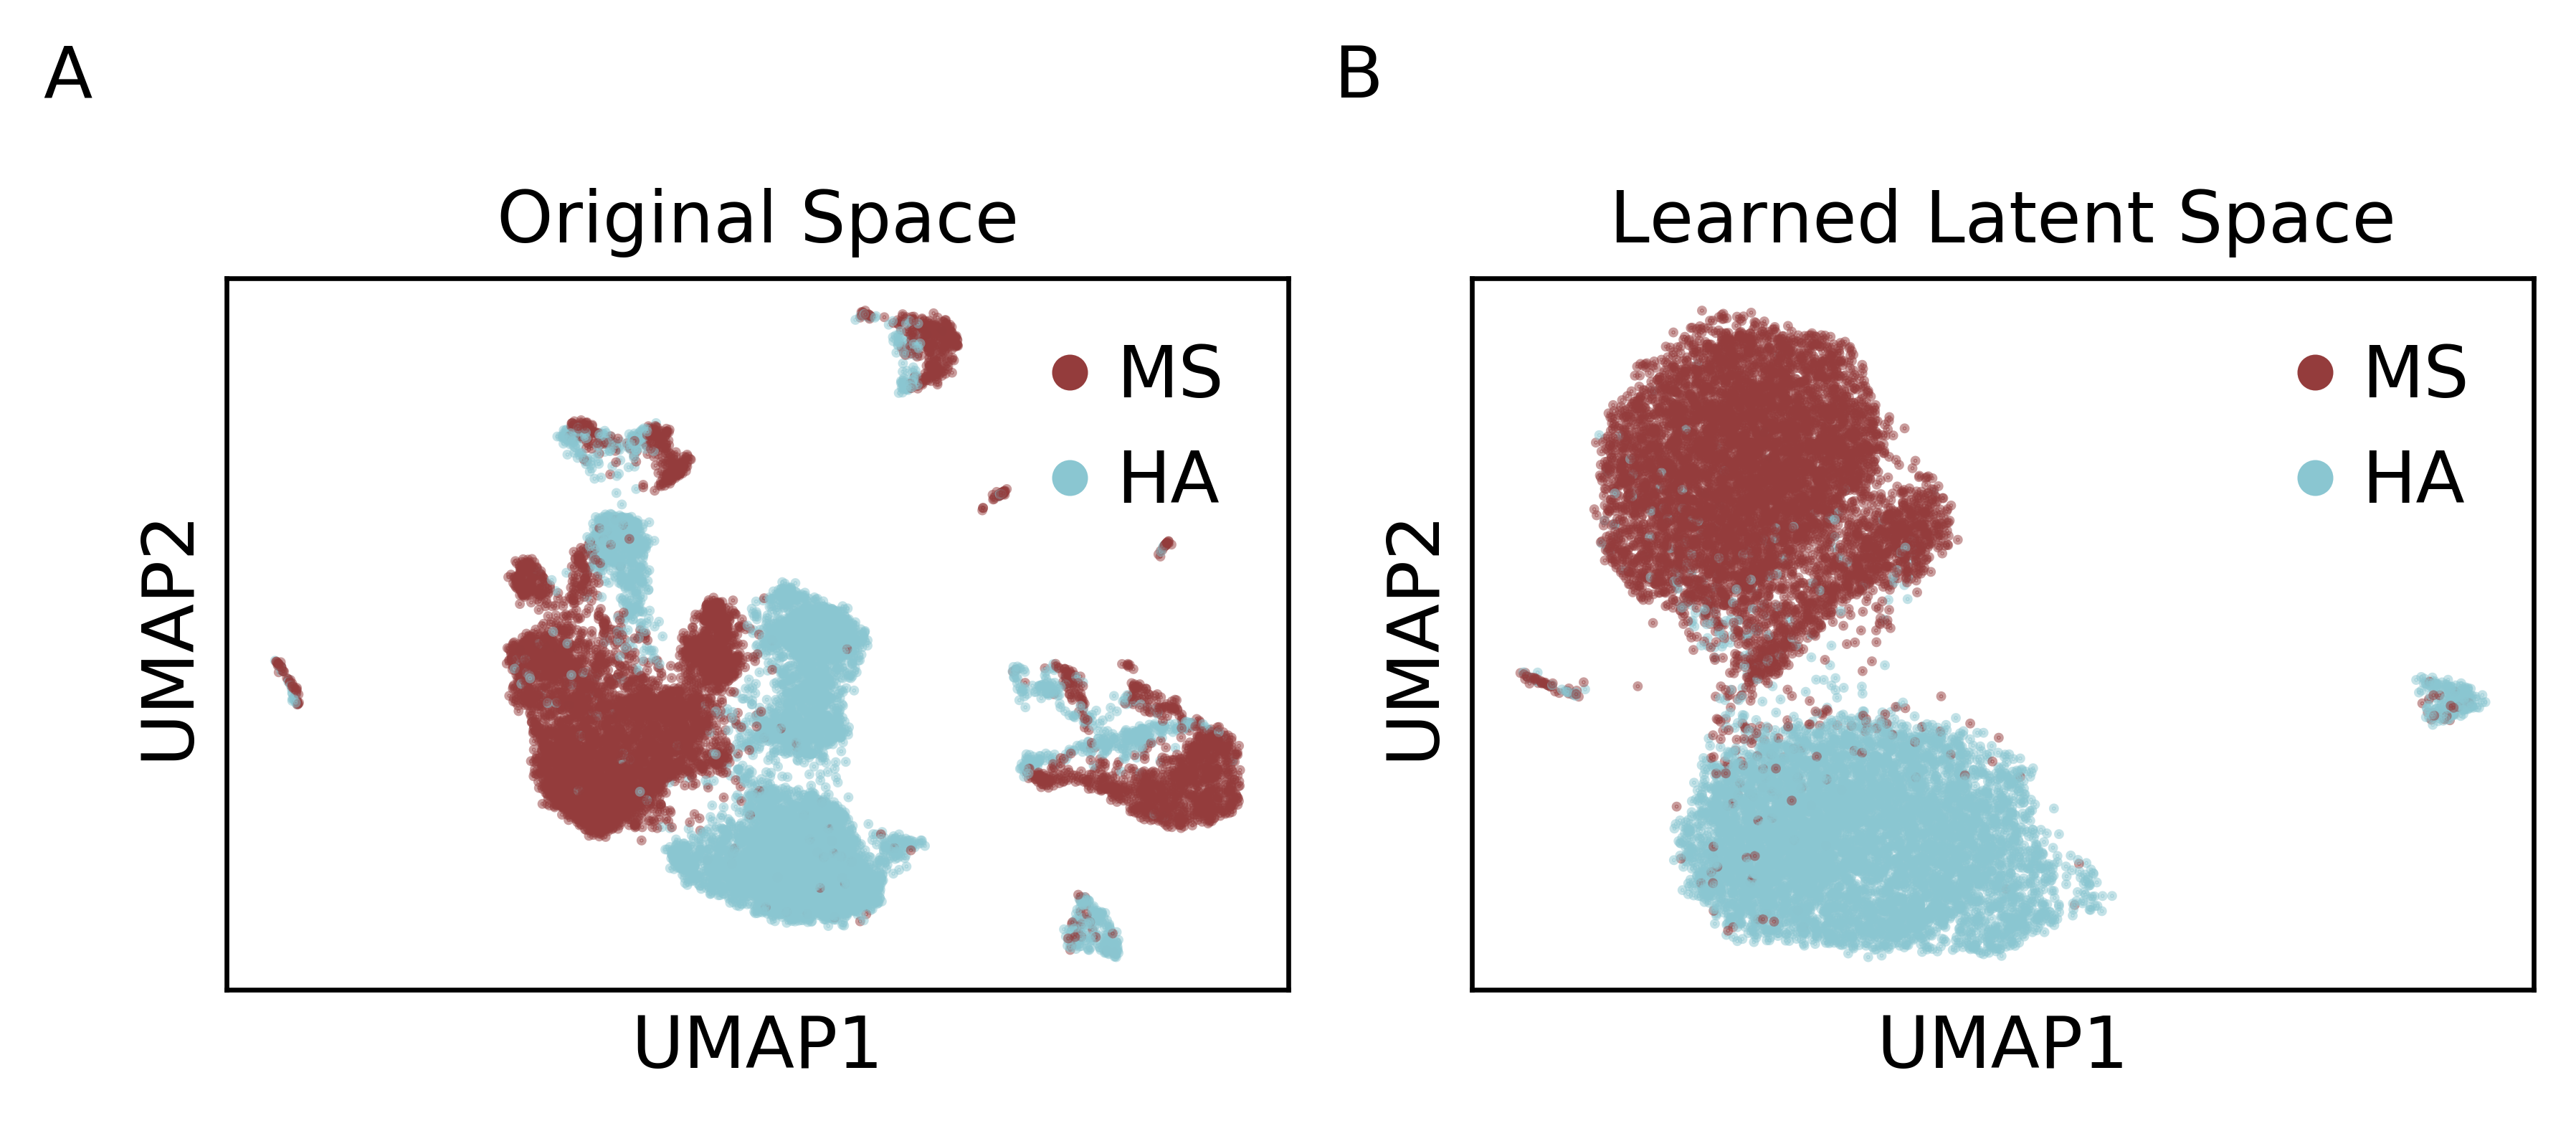
Visualizing combined heads.
6. Future work
We are excited by the improvements that a Graph Attention Networks bring to single cell analysis. We would like to continue this direction further by incorporating in multidimensional edge level features. Another direction of our research is to come up with new semi/unsupervised ways of creating new graphs from single cell data by completely bypassing PCA and KNN graphs. And then we can apply the models in this paper along with the edge level modifications to our new graphs.
We are going to scale up our work to a much larger dataset which requires us not only to experiment with the depth and the breadth of our model but also introduces new computational challenges like fitting large graphs in memory and doing computations more effectively.
One of the striking results we found that conforms to the medical knowledge is that the CSF cells are strong indicators of MS, whereas the blood cell are not very good indicators. However getting the CSF data is an expensive and invasive process. We are in process of acquiring only the blood samples of MS patients. Thus predicting MS from only blood samples becomes an extremely difficult task. To alleviate the problem, we would like to do transfer learning from our model that is trained on both blood and CSF samples and the train/test only on the new blood samples. We hope that the transfer learning will achieve better results than an untrained graph neural network.
7. Conclusion
Multiple sclerosis (MS) is an unpredictable disease of the central nervous system that disrupts the flow of information within the brain, and between the brain and body. The molecular markers and characteristics of MS are still actively studied and there remains no single test for diagnosing MS. Single-cell sequencing has revolutionized biological discovery, providing an in-depth picture of cellular differences and the interactions between various cells in their microenvironments. However, scRNA-seq has mostly been used for basic sciences but not for clinical or diagnostic use due to its cost and the complexity of the data. In this work we use a graph attention model on single cell data to predict MS. The model is trained on a cohort of seven MS patients and six healthy adults (HA) from the blood and cerebral spinal fluid (CSF) of each patient. We perform transductive and inductive tasks and we achieve % and % accuracy in predicting MS beating other methods such as graph convolutional networks, random forest and MLP. Further, we use the learned graph attention model to get insight into the signatures (transcriptomic and genetic features) and the cells that are important for this prediction. Using the attention weights we extracted a list of genes and we were encouraged to find CD19 and IL2RG in that list. We envision that the feature selection approach to produce a minimal gene set can function as biomarkers in a clinical setting. We also computed the top cells that have the highest predicted probability of being MS and all of these cells came from the patients’ CSF. In contrast, the most prototypical healthy cells are approximately evenly split between being sourced from blood or CSF samples. This confirms the common medical hypothesis that patients’ CSF has a higher degree of information relevant to central nervous system inflammation than blood cell samples. Finally the graph attention model also allow us to infer a new feature space for the cells that emphasizes the difference between the two conditions which we visualize via PHATE and UMAP. There has been more emphasis on the identification of determinants of disease progression and on how individual information can be used to personalize treatment and we hope that this graph neural networks will play in important role in predicting disease and in identifying key determinant of those diseases.
References
- (1)
- Alquicira-Hernandez et al. (2019) Jose Alquicira-Hernandez, Anuja Sathe, Hanlee P Ji, Quan Nguyen, and Joseph E Powell. 2019. scPred: accurate supervised method for cell-type classification from single-cell RNA-seq data. Genome Biology 20, 1 (2019), 264. https://doi.org/10.1186/s13059-019-1862-5
- Amodio et al. (2019) Matthew Amodio, David van Dijk, Krishnan Srinivasan, William S Chen, Hussein Mohsen, Kevin R Moon, Allison Campbell, Yujiao Zhao, Xiaomei Wang, Manjunatha Venkataswamy, Anita Desai, V Ravi, Priti Kumar, Ruth Montgomery, Guy Wolf, and Smita Krishnaswamy. 2019. Exploring single-cell data with deep multitasking neural networks. Nature Methods 16, 11 (2019), 1139–1145. https://doi.org/10.1038/s41592-019-0576-7
- Arisdakessian et al. (2019) Cédric Arisdakessian, Olivier Poirion, Breck Yunits, Xun Zhu, and Lana X Garmire. 2019. DeepImpute: an accurate, fast, and scalable deep neural network method to impute single-cell RNA-seq data. Genome Biology 20, 1 (2019), 211. https://doi.org/10.1186/s13059-019-1837-6
- Blondel et al. (2008) Vincent D. Blondel, Jean-Loup Guillaume, Renaud Lambiotte, and Etienne Lefebvre. 2008. Fast unfolding of communities in large networks. Journal of Statistical Mechanics: Theory and Experiment 2008, 10 (Oct 2008), P10008. https://doi.org/10.1088/1742-5468/2008/10/p10008
- Bottou and LeCun (2005) Léon Bottou and Yann LeCun. 2005. Graph transformer networks for image recognition. http://yann.lecun.com/exdb/publis/pdf/bottou-05.pdf.
- Büttner et al. (2019) Maren Büttner, Zhichao Miao, F. Alexander Wolf, Sarah A. Teichmann, and Fabian J. Theis. 2019. A test metric for assessing single-cell RNA-seq batch correction. Nature Methods 16, 1 (Jan 2019), 43–49. https://doi.org/10.1038/s41592-018-0254-1
- Cerosaletti et al. (2013) Karen Cerosaletti, Anya Schneider, Katharine Schwedhelm, Ian Frank, Megan Tatum, Shan Wei, Elizabeth Whalen, Carla Greenbaum, Mariko Kita, Jane Buckner, and S. Alice Long. 2013. Multiple Autoimmune-Associated Variants Confer Decreased IL-2R Signaling in CD4+CD25hi T Cells of Type 1 Diabetic and Multiple Sclerosis Patients. Plos 8, 12 (12 2013), 1–9. https://doi.org/10.1371/journal.pone.0083811
- Chen et al. (2019) Geng Chen, Baitang Ning, and Tieliu Shi. 2019. Single-Cell RNA-Seq Technologies and Related Computational Data Analysis. Frontiers in Genetics 10 (2019), 317. https://doi.org/10.3389/fgene.2019.00317
- Chiang et al. (2019) Wei-Lin Chiang, Xuanqing Liu, Si Si, Yang Li, Samy Bengio, and Cho-Jui Hsieh. 2019. Cluster-GCN: An Efficient Algorithm for Training Deep and Large Graph Convolutional Networks. , 10 pages. https://doi.org/10.1145/3292500.3330925
- Choi et al. (2017) Edward Choi, Mohammad Taha Bahadori, Le Song, Walter F. Stewart, and Jimeng Sun. 2017. GRAM: Graph-Based Attention Model for Healthcare Representation Learning (KDD ’17). Association for Computing Machinery, New York, NY, USA, 787–795. https://doi.org/10.1145/3097983.3098126
- Ciccarelli et al. (2014) Olga Ciccarelli, Frederik Barkhof, Benedetta Bodini, Nicola De Stefano, Xavier Golay, Klaas Nicolay, Daniel Pelletier, Petra J.W. Pouwels, Seth A. Smith, Claudia A.M. Wheeler-Kingshott, Bruno Stankoff, Tarek Yousry, and David H. Miller. 2014. Pathogenesis of multiple sclerosis: Insights from molecular and metabolic imaging. The Lancet Neurology 13, 8 (2014), 807–822. https://doi.org/10.1016/S1474-4422(14)70101-2
- Clevert et al. (2016) Djork-Arné Clevert, Thomas Unterthiner, and Sepp Hochreiter. 2016. Fast and accurate deep network learning by exponential linear units (elus). https://arxiv.org/abs/1511.07289
- Duvenaud et al. (2015) David Duvenaud, Dougal Maclaurin, Jorge Aguilera-Iparraguirre, Rafael Gómez-Bombarelli, Timothy Hirzel, Alán Aspuru-Guzik, and Ryan P. Adams. 2015. Convolutional Networks on Graphs for Learning Molecular Fingerprints (NIPS’15). MIT Press, Cambridge, MA, USA, 2224–2232.
- Gafson et al. (2017) Arie Gafson, Matt J Craner, and Paul M Matthews. 2017. Personalised medicine for multiple sclerosis care. Multiple Sclerosis Journal 23, 3 (2017), 362–369. https://doi.org/10.1177/1352458516672017
- Gawel et al. (2019) Danuta R Gawel, Jordi Serra-Musach, Sandra Lilja, Jesper Aagesen, Alex Arenas, Bengt Asking, Malin Bengnér, Janne Björkander, Sophie Biggs, Jan Ernerudh, Henrik Hjortswang, Jan-Erik Karlsson, Mattias Köpsen, Eun Jung Lee, Antonio Lentini, Xinxiu Li, Mattias Magnusson, David Martínez-Enguita, Andreas Matussek, Colm E Nestor, Samuel Schäfer, Oliver Seifert, Ceylan Sonmez, Henrik Stjernman, Andreas Tjärnberg, Simon Wu, Karin Åkesson, Alex K Shalek, Margaretha Stenmarker, Huan Zhang, Mika Gustafsson, and Mikael Benson. 2019. A validated single-cell-based strategy to identify diagnostic and therapeutic targets in complex diseases. Genome Medicine 11, 1 (2019), 47. https://doi.org/10.1186/s13073-019-0657-3
- Gay et al. (1997) F. W. Gay, T. J. Drye, G. W.A. Dick, and M. M. Esiri. 1997. The application of multifactorial cluster analysis in the staging of plaques in early multiple sclerosis: Identification and characterization of the primary demyelinating lesion. Brain 120, 8 (Aug 1997), 1461–1483. https://doi.org/10.1093/brain/120.8.1461
- Glorot and Bengio (2010) Xavier Glorot and Yoshua Bengio. 2010. Understanding the difficulty of training deep feedforward neural networks. , 249-256 pages.
- Hafler et al. (2007) David A. Hafler, Alastair Compston, Stephen Sawcer, Eric S. Lander, Mark J. Daly, Philip L. De Jager, Paul I.W. De Bakker, Stacey B. Gabriel, Daniel B. Mirel, Adrian J. Ivinson, Margaret A. Pericak-Vance, Simon G. Gregory, John D. Rioux, Jacob L. McCauley, Jonathan L. Haines, Lisa F. Barcellos, Bruce Cree, Jorge R. Oksenberg, and Stephen L. Hauser. 2007. Risk alleles for multiple sclerosis identified by a genomewide study. New England Journal of Medicine 357, 9 (Aug 2007), 851–862. https://doi.org/10.1056/NEJMoa073493
- Hamilton et al. (2017) William L. Hamilton, Rex Ying, and Jure Leskovec. 2017. Inductive Representation Learning on Large Graphs (NIPS’17). Curran Associates Inc., Red Hook, NY, USA, 1025–1035.
- Harikumar et al. (2019) Haripriya Harikumar, Thomas P. Quinn, Santu Rana, Sunil Gupta, and Svetha Venkatesh. 2019. A random walk down personalized single-cell networks: predicting the response of any gene to any drug for any patient. https://doi.org/10.1101/837807 arXiv:https://www.biorxiv.org/content/early/2019/11/11/837807.full.pdf
- Hauser et al. (2017) Stephen L. Hauser, Amit Bar-Or, Giancarlo Comi, Gavin Giovannoni, Hans-Peter Hartung, Bernhard Hemmer, Fred Lublin, Xavier Montalban, Kottil W. Rammohan, Krzysztof Selmaj, Anthony Traboulsee, Jerry S. Wolinsky, Douglas L. Arnold, Gaelle Klingelschmitt, Donna Masterman, Paulo Fontoura, Shibeshih Belachew, Peter Chin, Nicole Mairon, Hideki Garren, and Ludwig Kappos. 2017. Ocrelizumab versus Interferon Beta-1a in Relapsing Multiple Sclerosis. New England Journal of Medicine 376, 3 (2017), 221–234. https://doi.org/10.1056/NEJMoa1601277 PMID: 28002679.
- Karczewski and Snyder (2018) Konrad J. Karczewski and Michael P. Snyder. 2018. Integrative omics for health and disease. Nature Reviews Genetics 19, 5 (May 2018), 299–310. https://doi.org/10.1038/nrg.2018.4
- Kipf and Welling (2017) Thomas N. Kipf and Max Welling. 2017. Semi-Supervised Classification with Graph Convolutional Networks. https://openreview.net/pdf?id=SJU4ayYgl
- Kiselev et al. (2019) Vladimir Yu Kiselev, Tallulah S. Andrews, and Martin Hemberg. 2019. Challenges in unsupervised clustering of single-cell RNA-seq data. Nature Reviews Genetics 20, 5 (May 2019), 273–282. https://doi.org/10.1038/s41576-018-0088-9
- Kutzelnigg et al. (2005) Alexandra Kutzelnigg, Claudia F. Lucchinetti, Christine Stadelmann, Wolfgang Brück, Helmut Rauschka, Markus Bergmann, Manfred Schmidbauer, Joseph E. Parisi, and Hans Lassmann. 2005. Cortical demyelination and diffuse white matter injury in multiple sclerosis. Brain 128, 11 (10 2005), 2705–2712. https://doi.org/10.1093/brain/awh641 arXiv:https://academic.oup.com/brain/article-pdf/128/11/2705/971736/awh641.pdf
- Lee et al. (2019) Junhyun Lee, Inyeop Lee, and Jaewoo Kang. 2019. Self-Attention Graph Pooling. , arXiv:1904.08082 pages. arXiv:cs.LG/1904.08082
- Lee et al. (2019) John Boaz Lee, Ryan A. Rossi, Sungchul Kim, Nesreen K. Ahmed, and Eunyee Koh. 2019. Attention Models in Graphs: A Survey. ACM Trans. Knowl. Discov. Data 13, 6, Article Article 62 (Nov. 2019), 25 pages. https://doi.org/10.1145/3363574
- Lorscheider et al. (2017) Johannes Lorscheider, Vilija G. Jokubaitis, Tim Spelman, Guillermo Izquierdo, Alessandra Lugaresi, Eva Havrdova, Dana Horakova, Maria Trojano, Pierre Duquette, Marc Girard, Alexandre Prat, François Grand’Maison, Pierre Grammond, Eugenio Pucci, Cavit Boz, Patrizia Sola, Diana Ferraro, Daniele Spitaleri, Jeanette Lechner-Scott, Murat Terzi, Vincent Van Pesch, Gerardo Iuliano, Roberto Bergamaschi, Cristina Ramo-Tello, Franco Granella, Celia Oreja-Guevara, Helmut Butzkueven, and Tomas Kalincik. 2017. Anti-inflammatory disease-modifying treatment and short-term disability progression in SPMS. Neurology 89, 10 (2017), 1050–1059. https://doi.org/10.1212/WNL.0000000000004330 arXiv:https://n.neurology.org/content/89/10/1050.full.pdf
- Lotfollahi et al. (2019) Mohammad Lotfollahi, F Alexander Wolf, and Fabian J Theis. 2019. scGen predicts single-cell perturbation responses. Nature Methods 16, 8 (2019), 715–721. https://doi.org/10.1038/s41592-019-0494-8
- Lublin et al. (1996) Fred D. Lublin, Stephen C. Reingold, and . 1996. Defining the clinical course of multiple sclerosis. Neurology 46, 4 (1996), 907–911. https://doi.org/10.1212/WNL.46.4.907 arXiv:https://n.neurology.org/content/46/4/907.full.pdf
- Lycke and Zetterberg (2017) Jan Lycke and Henrik Zetterberg. 2017. The role of blood and CSF biomarkers in the evaluation of new treatments against multiple sclerosis. Expert Review of Clinical Immunology 13, 12 (2017), 1143–1153. https://doi.org/10.1080/1744666X.2017.1400380
- McInnes et al. (2018) Leland McInnes, John Healy, and James Melville. 2018. UMAP: Uniform Manifold Approximation and Projection for Dimension Reduction. arXiv:arXiv:1802.03426
- Moon et al. (2019) Kevin R. Moon, David van Dijk, Zheng Wang, Scott Gigante, Daniel B. Burkhardt, William S. Chen, Kristina Yim, Antonia van den Elzen, Matthew J. Hirn, Ronald R. Coifman, Natalia B. Ivanova, Guy Wolf, and Smita Krishnaswamy. 2019. Visualizing Structure and Transitions for Biological Data Exploration. https://www.biorxiv.org/content/early/2019/04/04/120378.full.pdf. https://doi.org/10.1101/120378
- Mühlau et al. (2016) Mark Mühlau, Till F. M. Andlauer, and Bernhard Hemmer. 2016. HLA Genetic Risk Burden in Multiple Sclerosis. JAMA Neurology 73, 12 (2016), 1500–1501. https://doi.org/10.1001/jamaneurol.2016.4329
- Olsson et al. (2017) Tomas Olsson, Lisa F. Barcellos, and Lars Alfredsson. 2017. Interactions between genetic, lifestyle and environmental risk factors for multiple sclerosis. Nature Reviews Neurology 13, 1 (2017), 25–36. https://doi.org/10.1038/nrneurol.2016.187
- Patsopoulos et al. (2019) Nikolaos A. Patsopoulos, Sergio E. Baranzini, Adam Santaniello, Parisa Shoostari, Chris Cotsapas, Garrett Wong, Ashley H. Beecham, Tojo James, Joseph Replogle, Ioannis S. Vlachos, Cristin McCabe, Tune H. Pers, Aaron Brandes, Charles White, Brendan Keenan, Maria Cimpean, Phoebe Winn, Ioannis-Pavlos Panteliadis, Allison Robbins, Till F. M. Andlauer, Onigiusz Zarzycki, Bénédicte Dubois, An Goris, Helle Bach Søndergaard, Finn Sellebjerg, Per Soelberg Sorensen, Henrik Ullum, Lise Wegner Thørner, Janna Saarela, Isabelle Cournu-Rebeix, Vincent Damotte, Bertrand Fontaine, Lena Guillot-Noel, Mark Lathrop, Sandra Vukusic, Achim Berthele, Viola Pongratz, Dorothea Buck, Christiane Gasperi, Christiane Graetz, Verena Grummel, Bernhard Hemmer, Muni Hoshi, Benjamin Knier, Thomas Korn, Christina M. Lill, Felix Luessi, Mark Mühlau, Frauke Zipp, Efthimios Dardiotis, Cristina Agliardi, Antonio Amoroso, Nadia Barizzone, Maria D. Benedetti, Luisa Bernardinelli, Paola Cavalla, Ferdinando Clarelli, Giancarlo Comi, Daniele Cusi, Federica Esposito, Laura Ferrè, Daniela Galimberti, Clara Guaschino, Maurizio A. Leone, Vittorio Martinelli, Lucia Moiola, Marco Salvetti, Melissa Sorosina, Domizia Vecchio, Andrea Zauli, Silvia Santoro, Nicasio Mancini, Miriam Zuccalà, Julia Mescheriakova, Cornelia van Duijn, Steffan D. Bos, Elisabeth G. Celius, Anne Spurkland, Manuel Comabella, Xavier Montalban, Lars Alfredsson, Izaura L. Bomfim, David Gomez-Cabrero, Jan Hillert, Maja Jagodic, Magdalena Lindén, Fredrik Piehl, Ilijas Jelčić, Roland Martin, Mirela Sospedra, Amie Baker, Maria Ban, Clive Hawkins, Pirro Hysi, Seema Kalra, Fredrik Karpe, Jyoti Khadake, Genevieve Lachance, Paul Molyneux, Matthew Neville, John Thorpe, Elizabeth Bradshaw, Stacy J. Caillier, Peter Calabresi, Bruce A. C. Cree, Anne Cross, Mary Davis, Paul W. I. de Bakker, Silvia Delgado, Marieme Dembele, Keith Edwards, Kate Fitzgerald, Irene Y. Frohlich, Pierre-Antoine Gourraud, Jonathan L Haines, Hakon Hakonarson, Dorlan Kimbrough, Noriko Isobe, Ioanna Konidari, Ellen Lathi, Michelle H. Lee, Taibo Li, David An, Andrew Zimmer, Lohith Madireddy, Clara P. Manrique, Mitja Mitrovic, Marta Olah, Ellis Patrick, Margaret A. Pericak-Vance, Laura Piccio, Cathy Schaefer, Howard Weiner, Kasper Lage, , , , Alastair Compston, David Hafler, Hanne F. Harbo, Stephen L. Hauser, Graeme Stewart, Sandra D’Alfonso, Georgios Hadjigeorgiou, Bruce Taylor, Lisa F. Barcellos, David Booth, Rogier Hintzen, Ingrid Kockum, Filippo Martinelli-Boneschi, Jacob L. McCauley, Jorge R. Oksenberg, Annette Oturai, Stephen Sawcer, Adrian J. Ivinson, Tomas Olsson, and Philip L. De Jager. 2019. Multiple sclerosis genomic map implicates peripheral immune cells and microglia in susceptibility. Science 365, 6460 (2019), 1–10. https://doi.org/10.1126/science.aav7188 arXiv:https://science.sciencemag.org/content/365/6460/eaav7188.full.pdf
- Poirion et al. (2016) Olivier B. Poirion, Xun Zhu, Travers Ching, and Lana Garmire. 2016. Single-Cell Transcriptomics Bioinformatics and Computational Challenges. Frontiers in Genetics 7 (Sep 2016), eCollection.
- Sawcer et al. (2014) Stephen Sawcer, Robin J.M. Franklin, and Maria Ban. 2014. Multiple sclerosis genetics. , 700–709 pages. https://doi.org/10.1016/S1474-4422(14)70041-9
- Sawcer et al. (2011) Stephen Sawcer, Garrett Hellenthal, Matti Pirinen, Chris C.A. Spencer, Nikolaos A. Patsopoulos, Loukas Moutsianas, Alexander Dilthey, Zhan Su, Colin Freeman, Sarah E. Hunt, Sarah Edkins, Emma Gray, David R. Booth, Simon C. Potter, An Goris, Gavin Band, Annette Bang Oturai, Amy Strange, Janna Saarela, Céline Bellenguez, Bertrand Fontaine, Matthew Gillman, Bernhard Hemmer, Rhian Gwilliam, Frauke Zipp, Alagurevathi Jayakumar, Roland Martin, Stephen Leslie, Stanley Hawkins, Eleni Giannoulatou, Sandra D’Alfonso, Hannah Blackburn, Filippo Martinelli Boneschi, Jennifer Liddle, Hanne F. Harbo, Marc L. Perez, Anne Spurkland, Matthew J. Waller, Marcin P. Mycko, Michelle Ricketts, Manuel Comabella, Naomi Hammond, Ingrid Kockum, Owen T. McCann, Maria Ban, Pamela Whittaker, Anu Kemppinen, Paul Weston, Clive Hawkins, Sara Widaa, John Zajicek, Serge Dronov, Neil Robertson, Suzannah J. Bumpstead, Lisa F. Barcellos, Rathi Ravindrarajah, Roby Abraham, Lars Alfredsson, Kristin Ardlie, Cristin Aubin, Amie Baker, Katharine Baker, Sergio E. Baranzini, Laura Bergamaschi, Roberto Bergamaschi, Allan Bernstein, Achim Berthele, Mike Boggild, Jonathan P. Bradfield, David Brassat, Simon A. Broadley, Dorothea Buck, Helmut Butzkueven, Ruggero Capra, William M. Carroll, Paola Cavalla, Elisabeth G. Celius, Sabine Cepok, Rosetta Chiavacci, Françoise Clerget-Darpoux, Katleen Clysters, Giancarlo Comi, Mark Cossburn, Isabelle Cournu-Rebeix, Mathew B. Cox, Wendy Cozen, Bruce A.C. Cree, Anne H. Cross, Daniele Cusi, Mark J. Daly, Emma Davis, Paul I.W. De Bakker, Marc Debouverie, Marie Beatrice D’Hooghe, Katherine Dixon, Rita Dobosi, Bénédicte Dubois, David Ellinghaus, Irina Elovaara, Federica Esposito, Claire Fontenille, Simon Foote, Andre Franke, Daniela Galimberti, Angelo Ghezzi, Joseph Glessner, Refujia Gomez, Olivier Gout, Colin Graham, Struan F.A. Grant, Franca Rosa Guerini, Hakon Hakonarson, Per Hall, Anders Hamsten, Hans Peter Hartung, Rob N. Heard, Simon Heath, Jeremy Hobart, Muna Hoshi, Carmen Infante-Duarte, Gillian Ingram, Wendy Ingram, Talat Islam, Maja Jagodic, Michael Kabesch, Allan G. Kermode, Trevor J. Kilpatrick, Cecilia Kim, Norman Klopp, Keijo Koivisto, Malin Larsson, Mark Lathrop, Jeannette S. Lechner-Scott, Maurizio A. Leone, Virpi Leppä, Ulrika Liljedahl, Izaura Lima Bomfim, Robin R. Lincoln, Jenny Link, Jianjun Liu, Aslaug R. Lorentzen, Sara Lupoli, Fabio MacCiardi, Thomas MacK, Mark Marriott, Vittorio Martinelli, Deborah Mason, Jacob L. McCauley, Frank Mentch, Inger Lise Mero, Tania Mihalova, Xavier Montalban, John Mottershead, Kjell Morten Myhr, Paola Naldi, William Ollier, Alison Page, Aarno Palotie, Jean Pelletier, Laura Piccio, Trevor Pickersgill, Fredrik Piehl, Susan Pobywajlo, Hong L. Quach, Patricia P. Ramsay, Mauri Reunanen, Richard Reynolds, John D. Rioux, Mariaemma Rodegher, Sabine Roesner, Justin P. Rubio, Ina Maria Rückert, Marco Salvetti, Erika Salvi, Adam Santaniello, Catherine A. Schaefer, Stefan Schreiber, Christian Schulze, Rodney J. Scott, Finn Sellebjerg, Krzysztof W. Selmaj, David Sexton, Ling Shen, Brigid Simms-Acuna, Sheila Skidmore, Patrick M.A. Sleiman, Cathrine Smestad, Per Soelberg Sørensen, Helle Bach Søndergaard, Jim Stankovich, Richard C. Strange, Anna Maija Sulonen, Emilie Sundqvist, Ann Christine Syvänen, Francesca Taddeo, Bruce Taylor, Jenefer M. Blackwell, Pentti Tienari, Elvira Bramon, Ayman Tourbah, Matthew A. Brown, Ewa Tronczynska, Juan P. Casas, Niall Tubridy, Aiden Corvin, Jane Vickery, Janusz Jankowski, Pablo Villoslada, Hugh S. Markus, Kai Wang, Christopher G. Mathew, James Wason, Colin N.A. Palmer, Erich Wichmann, Robert Plomin, Ernest Willoughby, Anna Rautanen, Juliane Winkelmann, Michael Wittig, Richard C. Trembath, Jacqueline Yaouanq, Ananth C. Viswanathan, Haitao Zhang, Nicholas W. Wood, Rebecca Zuvich, Panos Deloukas, Cordelia Langford, Audrey Duncanson, Jorge R. Oksenberg, Margaret A. Pericak-Vance, Jonathan L. Haines, Tomas Olsson, Jan Hillert, Adrian J. Ivinson, Philip L. De Jager, Leena Peltonen, Graeme J. Stewart, David A. Hafler, Stephen L. Hauser, Gil McVean, Peter Donnelly, and Alastair Compston. 2011. Genetic risk and a primary role for cell-mediated immune mechanisms in multiple sclerosis. Nature 476, 7359 (Aug 2011), 214–219. https://doi.org/10.1038/nature10251
- Stoeger et al. (2018) Thomas Stoeger, Martin Gerlach, Richard I. Morimoto, and Luís A. Nunes Amaral. 2018. Large-scale investigation of the reasons why potentially important genes are ignored. PLOS Biology 16 (09 2018), 1–25. https://doi.org/10.1371/journal.pbio.2006643
- Stuart and Satija (2019) Tim Stuart and Rahul Satija. 2019. Integrative single-cell analysis. Nature Reviews Genetics 20, 5 (May 2019), 257–272.
- Thompson et al. (2018) Alan J. Thompson, Sergio E. Baranzini, Jeroen Geurts, Bernhard Hemmer, and Olga Ciccarelli. 2018. Multiple sclerosis. Lancet 391, 10130 (2018), 1622–1636. https://doi.org/10.1016/S0140-6736(18)30481-1
- Torroja and Sanchez-Cabo (2019) Carlos Torroja and Fatima Sanchez-Cabo. 2019. Digitaldlsorter: Deep-Learning on scRNA-Seq to Deconvolute Gene Expression Data. Frontiers in Genetics 10 (2019), 978. https://doi.org/10.3389/fgene.2019.00978
- Vaswani et al. (2017) Ashish Vaswani, Noam Shazeer, Niki Parmar, Jakob Uszkoreit, Llion Jones, Aidan N. Gomez, Lukasz Kaiser, and Illia Polosukhin. 2017. Attention is All You Need (NIPS’17). Curran Associates Inc., Red Hook, NY, USA, 6000–6010.
- Veličković et al. (2018) Petar Veličković, Guillem Cucurull, Arantxa Casanova, Adriana Romero, Pietro Liò, and Yoshua Bengio. 2018. Graph Attention Networks. https://openreview.net/forum?id=rJXMpikCZ
- Vishwanathan et al. (2010) S.V.N. Vishwanathan, Karsten Borgwardt, Nic Schraudolph, and Risi Kondor. 2010. Graph Kernels. Journal of Machine Learning Research 11 (2010), 1201–1242.
- Wang et al. (2019) Jingshu Wang, Divyansh Agarwal, Mo Huang, Gang Hu, Zilu Zhou, Chengzhong Ye, and Nancy R. Zhang. 2019. Data denoising with transfer learning in single-cell transcriptomics. Nature Methods 16, 9 (SEP 2019), 875+.
- Wolf et al. (2018) F. Alexander Wolf, Philipp Angerer, and Theis Fabian J. 2018. SCANPY: large-scale single-cell gene expression data analysis. Genome Biology 19, 15 (2018), e–print. https://doi.org/10.1186/s13059-017-1382-0
- Yang et al. (2016) Zhilin Yang, William Cohen, and Ruslan Salakhudinov. 2016. Revisiting semi-supervised learning with graph embeddings. , 40-48 pages.
- Ying et al. (2018) Rex Ying, Ruining He, Kaifeng Chen, Pong Eksombatchai, William L. Hamilton, and Jure Leskovec. 2018. Graph Convolutional Neural Networks for Web-Scale Recommender Systems (KDD ’18). Association for Computing Machinery, New York, NY, USA, 974–983. https://doi.org/10.1145/3219819.3219890
- Yue et al. (2019) Xiang Yue, Zhen Wang, Jingong Huang, Srinivasan Parthasarathy, Soheil Moosavinasab, Yungui Huang, Simon M Lin, Wen Zhang, Ping Zhang, and Huan Sun. 2019. Graph embedding on biomedical networks: methods, applications and evaluations. Bioinformatics 36, 4 (Oct 2019), 1241–1251. https://doi.org/10.1093/bioinformatics/btz718 arXiv:https://academic.oup.com/bioinformatics/advance-article-pdf/doi/10.1093/bioinformatics/btz718/30160037/btz718.pdf btz718.
- Yun et al. (2019) Seongjun Yun, Minbyul Jeong, Raehyun Kim, Jaewoo Kang, and Hyunwoo J. Kim. 2019. Graph Transformer Networks. https://papers.nips.cc/paper/9367-graph-transformer-networks.pdf
- Zeng and Dai (2019) Tao Zeng and Hao Dai. 2019. Single-Cell RNA Sequencing-Based Computational Analysis to Describe Disease Heterogeneity. Frontiers in Genetics 10 (2019), 629. https://doi.org/10.3389/fgene.2019.00629
- Zhang and Chen (2018) Muhan Zhang and Yixin Chen. 2018. Link Prediction Based on Graph Neural Networks (NIPS’18). Curran Associates Inc., Red Hook, NY, USA, 5171–5181.
- Zheng and Wang (2019) Jie Zheng and Ke Wang. 2019. Emerging deep learning methods for single-cell RNA-seq data analysis. Quantitative Biology 7, 4 (2019), 247–254. https://doi.org/10.1007/s40484-019-0189-2
- Zhou et al. (2018) Jie Zhou, Ganqu Cui, Zhengyan Zhang, Cheng Yang, Zhiyuan Liu, Lifeng Wang, Changcheng Li, and Maosong Sun. 2018. Graph Neural Networks: A Review of Methods and Applications. , arXiv:1812.08434 pages. arXiv:cs.LG/1812.08434