ExoMol line lists – XXXVIII. High-temperature molecular line list of silicon dioxide (SiO2)
Abstract
Silicon dioxide (SiO2) is expected to occur in the atmospheres of hot rocky super-Earth exoplanets but a lack of spectroscopic data is hampering its possible detection. Here, we present the first, comprehensive molecular line list for SiO2. The line list, named OYT3, covers the wavenumber range 0 – 6000 cm-1 (wavelengths m) and is suitable for temperatures up to K. Almost 33 billion transitions involving 5.69 million rotation-vibration states with rotational excitation up to have been computed using robust first-principles methodologies. The OYT3 line list is available from the ExoMol database at www.exomol.com.
keywords:
molecular data – opacity – planets and satellites: atmospheres – stars: atmospheres – ISM: molecules.1 Introduction
In the gas phase, silicon dioxide (28Si16O2) is a linear triatomic molecule, analogous to CO2. SiO2 is expected to be present in the atmospheres of hot rocky super-Earth exoplanets (Tennyson & Yurchenko, 2017a). These tidally-locked exoplanets are in close proximity to their host star with their dayside exposed to temperatures reaching 4000 K. At such high temperatures the material on the surface of the planet vaporises to produce an atmosphere strongly dependent on initial planetary composition (Schaefer & Fegley, 2009; Miguel et al., 2011), e.g. composed of SiO2-rich silicates like the Earth’s continental crust (Schaefer, Lodders & Fegley, 2012). Furthermore, the likely presence of water vapour creates a steam atmosphere, and since all major rock-forming elements (Si, Mg, Ca, etc.) dissolve in steam to some extent, one can expect to encounter simple molecules composed of rock-forming elements with oxygen and hydrogen (Fegley et al., 2016).
Investigating the spectroscopy of hot rocky super-Earths requires accurate molecular opacities on systems such as SiO2. There is, however, very limited information on some of these molecules, partly because they form in the gas phase at very high temperatures making their spectra challenging to measure in the laboratory. Instead, theory offers a more viable route for generating the molecular line lists of these systems through systematic approaches based on first-principles methodologies (Tennyson, 2016; Tennyson & Yurchenko, 2017b). These computational procedures have been successfully adopted by the ExoMol database (Tennyson & Yurchenko, 2012; Tennyson et al., 2016), which provides comprehensive line lists suitable for modelling exoplanet atmospheres at elevated temperatures. Already a large number of important diatomic and polyatomic species have been treated within the ExoMol framework (Tennyson & Yurchenko, 2018), and efforts are now being focused on molecules relevant to hot rocky super-Earth atmospheres. This brings about its own unique set of challenges, notably the completeness of the line list at very high temperatures and the lack of experimental data to refine the theoretical spectroscopic model.
Regarding SiO2, only a few studies have investigated its infrared spectrum with measurements of the bending mode (Andrews & McCluskey, 1992) and stretching mode (Schnöckel, 1978, 1980). However, since these studies were performed in solid argon matrices the measured wavenumbers can be shifted by tens of wavenumbers (Jacox, 1994) making it difficult to assess the usefulness of the determined values for gas phase studies. Similarly, only a small number of theoretical studies have considered silicon dioxide (Kaufman, Muenter & Klemperer, 1967; Pacansky & Hermann, 1978; Wang et al., 1996; Brinkmann, Tschumper & Schaefer III, 1999; Kostko, Ahmed & Metz, 2009; Hao, Xie & Schaefer III, 2014), but none of these are particularly relevant to the work presented here, namely the high-accuracy calculation of its rotation-vibration spectrum.
In this work, we present the first, comprehensive rotation-vibration line list of gas-phase SiO2. The new line list has been computed using robust first-principles methodologies (Tennyson, 2016) within the ExoMol computational framework (Tennyson & Yurchenko, 2017b) and adds to the other available silicon-bearing molecules in the ExoMol database: SiH4 (Owens et al., 2017), SiH (Gorman, Yurchenko & Tennyson, 2019), SiO (Barton, Yurchenko & Tennyson, 2013), SiS (Upadhyay et al., 2018) and SiH2 (Clark et al., 2020).
2 Methods
The computational approach used to produce the SiO2 line list is described in detail in the supplementary material and only a brief summary is provided here. Initially, high-level ab initio methods were used to compute the potential energy surface (PES) and dipole moment surface (DMS) of the electronic ground state of SiO2. The PES was generated using explicitly correlated coupled cluster (CCSD(T)-F12b) calculations with extrapolation to the complete basis set limit, and included several additive energy corrections to account for small effects like scalar relativity. This approach is capable of producing accurate PESs for closed-shell molecules that can reproduce fundamental term values to within cm-1 on average (e.g. see Owens et al. (2018) and references within). Due to the lack of reliable experimental data for this molecule, the PES was not empirically refined. The DMS was computed using CCSD(T)-F12b with a large augmented correlation consistent basis set. It is now well established that transition intensities computed using ab initio DMSs are comparable to, and occasionally more reliable, than experiment (Yurchenko, 2014; Tennyson, 2014). Both surfaces were computed on the same grid of 15 365 nuclear geometries and then fitted with suitable analytic representations for use in the next stage of the calculation process. The potential energy and dipole moment surfaces are provided as supplementary material along with Fortran routines to construct them.
Line list calculations employed the variational nuclear motion program TROVE (Yurchenko, Thiel & Jensen, 2007), which was extended to treat linear triatomic molecules in this work. Benchmarking was performed against the triatomic nuclear motion code DVR3D (Tennyson et al., 2004) to ensure the validity of the TROVE implementation. The ability to utilise two nuclear motion codes based on different methodologies proved highly beneficial and meant the theoretical spectroscopic model of SiO2 could be checked for consistency. This was particularly important given the lack of experimental data to compare against. A large symmetry-adapted basis set was used in the rovibrational calculations with convergence testing performed at different values.
The line list was computed with a lower state energy threshold of cm-1 ( is the Planck constant and is the speed of light) and considered transitions up to in the 0 – 6000 cm-1 range. The energy levels and wavefunctions of SiO2 can be classified under the molecular symmetry group (Bunker & Jensen, 1998). The nuclear spin statistical weights are for states of symmetry , respectively. Thus, and states need not be computed and transitions follow the symmetry selection rules ; and the standard rotational selection rules, ; where ′ and ′′ denote the upper and lower state, respectively. These representations are correlated to the irreducible representation, commonly used for linear molecules, as and . Another standard spectroscopic descriptor is the Kronig parity (Brown et al., 1975), related to the total parity () and () as follows: the parity of the state is while the parity of the state is .
The vibrational quantum numbers used by TROVE (see supplementary material) were correlated to the following standard spectroscopic quantum numbers used for linear-type triatomic molecules: , , , , where and are the symmetric and asymmetric stretching quantum numbers, respectively, is the bending vibrational quantum number used for linear molecules and is the corresponding vibrational quantum number. The two bending quantum numbers and are connected to the ‘non-linear’ bending quantum number by with .
The symmetries of the vibrational and rotational contributions span the , , and irreducible representations (irreps) in and (), (), () etc. in . Odd values of the quantum number indicates vibrational states of symmetry. The rotational quantum number is constrained to the vibrational angular momentum by .
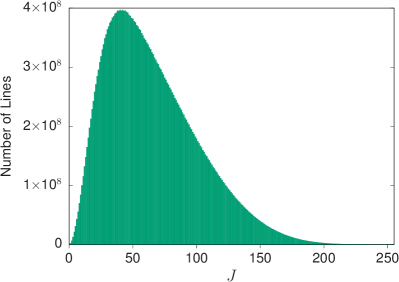
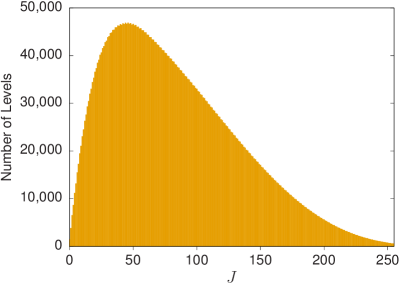
A total of 32 951 275 437 transitions involving 5 688 942 energy levels up to were computed for the OYT3 line list. The distribution of lines and levels as a function of is illustrated in Fig. 1. The largest number of transitions in the OYT3 line list occurs between , while the number of states peaks at before smoothly decreasing, a result of the upper state energy threshold of 000 cm-1.
3 Results
3.1 Partition function of silicon dioxide
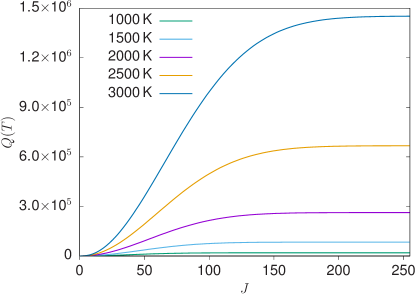
The temperature-dependent partition function is expressed as,
| (1) |
where is the degeneracy of a state with energy and rotational quantum number . Values of the partition function of SiO2 have been computed by summing over all calculated rovibrational energy levels on a K grid in the 1 – 3000 K range (provided as supplementary material). In Fig. 2, the convergence of as a function of for select temperatures is shown. At lower temperatures the partition function converges quickly but a substantial number of high states must be considered to achieve convergence above 1500 K. At , the value of is converged to 0.0001%, while the value of is converged to 0.0019%.
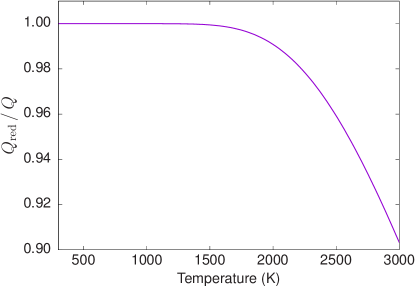
The SiO2 line list was computed with a lower state energy threshold of cm-1. A measure of the completeness of the line list can be obtained by studying the reduced partition function , which only includes energy levels up to cm-1 in the summation of Eq. (1). The ratio has been plotted with respect to temperature in Fig. 3 and from this we see that above 1500 K the ratio starts to decrease from unity. At 3000 K, the ratio and this should be considered as a soft temperature limit for the OYT3 line list. Uses above this will result in a progressive loss of opacity but the missing opacity contribution can be estimated from if needed (Neale, Miller & Tennyson, 1996).
3.2 Line list format
The SiO2 line list is provided in the ExoMol data format and further details with illustrative examples can be found in Tennyson et al. (2016). The .states file, see Table 1, contains all the computed rovibrational energy levels (in cm-1), each labelled with a unique state ID counting number, symmetry and quantum number labelling, and the contribution from the largest eigencoefficient used to assign the rovibrational state. The .trans files have been split into cm-1 frequency bins for user-handling purposes and contain all computed transitions with upper and lower state ID labels and Einstein coefficients, see Table 2.
| unc | |||||||||||||||||
|---|---|---|---|---|---|---|---|---|---|---|---|---|---|---|---|---|---|
| 1 | 0.000000 | 1 | 0 | 0.000000 | A1 | e | 0 | 0 | 0 | 0 | 1.00 | 0 | 0 | 0 | A1 | 0 | A1 |
| 2 | 578.229349 | 1 | 0 | 2.000000 | A1 | e | 0 | 2 | 0 | 0 | 1.00 | 0 | 0 | 1 | A1 | 0 | A1 |
| 3 | 990.856966 | 1 | 0 | 2.000000 | A1 | e | 1 | 0 | 0 | 0 | 1.00 | 1 | 0 | 0 | A1 | 0 | A1 |
| 4 | 1154.529779 | 1 | 0 | 4.000000 | A1 | e | 0 | 4 | 0 | 0 | 1.00 | 0 | 0 | 2 | A1 | 0 | A1 |
| 5 | 1570.947837 | 1 | 0 | 4.000000 | A1 | e | 1 | 2 | 0 | 0 | 1.00 | 1 | 0 | 1 | A1 | 0 | A1 |
| 6 | 1728.958462 | 1 | 0 | 6.000000 | A1 | e | 0 | 6 | 0 | 0 | 1.00 | 0 | 0 | 3 | A1 | 0 | A1 |
| 7 | 1977.509720 | 1 | 0 | 4.000000 | A1 | e | 2 | 0 | 0 | 0 | 1.00 | 1 | 1 | 0 | A1 | 0 | A1 |
| 8 | 2148.937437 | 1 | 0 | 6.000000 | A1 | e | 1 | 4 | 0 | 0 | 1.00 | 1 | 0 | 2 | A1 | 0 | A1 |
| 9 | 2301.592712 | 1 | 0 | 8.000000 | A1 | e | 0 | 8 | 0 | 0 | 1.00 | 0 | 0 | 4 | A1 | 0 | A1 |
| 10 | 2559.419897 | 1 | 0 | 6.000000 | A1 | e | 2 | 2 | 0 | 0 | 1.00 | 1 | 1 | 1 | A1 | 0 | A1 |
-
•
: State counting number;
-
•
: Term value (in cm-1);
-
•
: Total state degeneracy;
-
•
: Total angular momentum quantum number;
-
•
unc: Estimated uncertainty of energy level (in cm-1);
-
•
: Overall symmetry in ( or );
-
•
: The Kronig (rotationless) parity;
-
•
, , , : Linear-molecule vibrational quantum numbers;
-
•
: Largest coefficient used in the TROVE assignment;
-
•
– : TROVE vibrational quantum numbers;
-
•
: Symmetry of the vibrational contribution in ;
-
•
: Rotational quantum number, projection of onto molecule-fixed axis ();
-
•
: Symmetry of the rotational contribution in .
| 1901572 | 1832882 | 8.4692e-44 |
| 2283835 | 2261046 | 9.7538e-45 |
| 948596 | 1016760 | 9.4147e-35 |
| 1830303 | 1853859 | 2.7761e-42 |
| 4120223 | 4135284 | 1.1104e-41 |
| 649389 | 670531 | 1.0237e-43 |
| 284492 | 332334 | 2.6832e-31 |
| 3288298 | 3306461 | 1.3021e-31 |
| 3796784 | 3812806 | 2.0901e-39 |
| 366209 | 348742 | 3.7795e-33 |
: Upper state ID; : Lower state ID;
: Einstein coefficient (in s-1).
The assignment of the vibrational quantum numbers to each state is performed in TROVE by analysing the contribution from the primitive basis functions of the different modes, which are then converted to the linear-molecule, normal mode quantum numbers (see Table 1). The connection between the assignment and the primitive basis functions is not always straightforward due to the complicated contraction scheme used to build the final symmetrized rovibrational basis set (Yurchenko, Yachmenev & Ovsyannikov, 2017). Thus, in instances where the eigen-coefficient is very small the assignment should be considered as indicative.
The computed energy levels in the OYT3 line list have been assigned uncertainties (in cm-1) in the following way: The three fundamental term values have been given an estimated uncertainty of 2 cm-1, which has then been propagated to all overtone and combination bands using the TROVE normal mode quantum numbers. For example, a state with (, , ) has an estimated uncertainty of 16 cm-1. The initial uncertainty estimate of 2 cm-1 for the fundamentals is based on our previous experience using similar levels of ab initio theory to construct closed-shell molecule potential energy surfaces (Owens et al., 2015a, b, 2016, 2018; Owens & Yurchenko, 2019). This uncertainty scheme is approximate and should not be relied on in instances where the eigen-coefficient is small. We have also opted to round the estimated uncertainties to integer values so that they can be easily differentiated from more robust uncertainties, e.g. derived from experiment. Note that the ground state rovibrational term values, i.e. (, , ) have been assigned uncertainties of 2 cm-1 throughout.
3.3 Simulated spectra of silicon dioxide
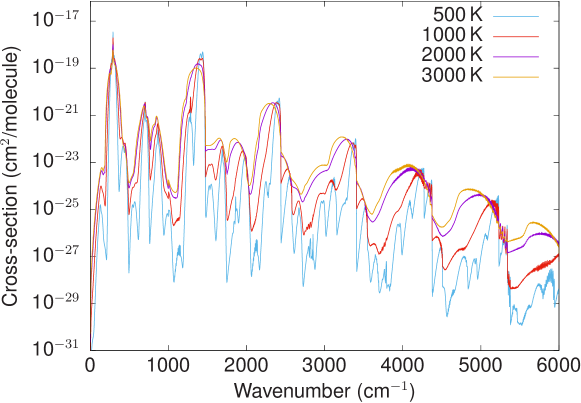
The temperature dependence of the OYT3 line list is illustrated in Fig. 4, where we have plotted integrated absorption cross-sections at a resolution of cm-1 using a Gaussian profile with a half width at half maximum (HWHM) of cm-1. Spectral simulations were performed with the ExoCross program (Yurchenko, Al-Refaie & Tennyson, 2018). As expected, the SiO2 spectrum becomes smoother and more featureless as the temperature increases. This is caused by the increased population of vibrationally excited states with temperature, leading to substantial broadening of the rotational band envelopes.
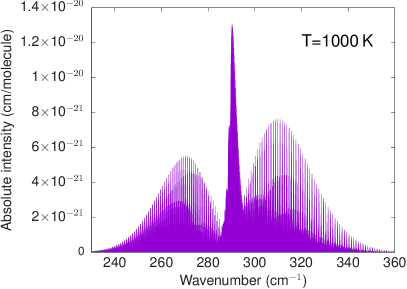
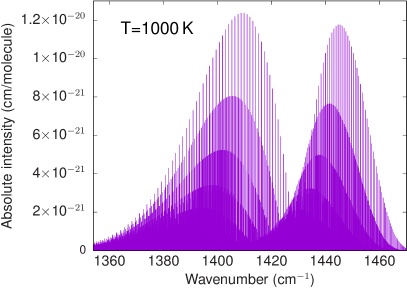
Stick spectra of the two strongest bands at a temperature of 1000 K are shown in Fig. 5, with the fundamental bending mode (left-hand panel) and the stretching band (right-hand panel) displayed. The position of these bands is in broad agreement with previous experimental studies (Andrews & McCluskey, 1992; Schnöckel, 1978, 1980) but given these infrared measurements were performed in solid argon matrices, which are known to shift the measured wavenumbers, we avoid a direct comparison.
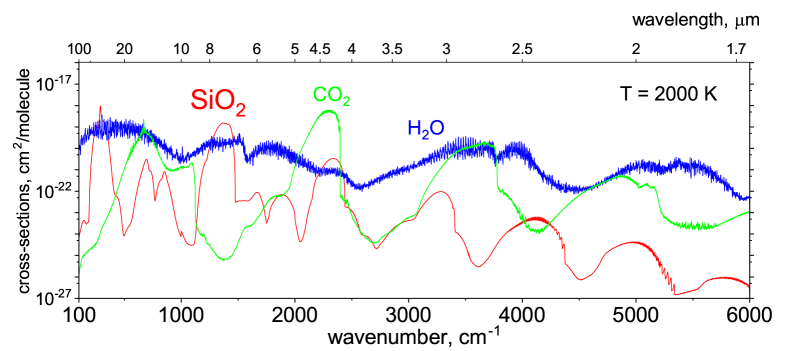
The SiO2 spectrum has a distinct strong feature at 4.5 m. This region plays an important role in the atmospheric applications of exoplanets due to the CO2 photometric band used by the Spitzer Space Telescope (IRAC instrument). For example, this band was used to build the phase curve of super-Earth 55 Cancri e by Demory et al. (2016) and to provide analysis of the atmospheric (day/night) structure of the plane. The atmosphere was shown to have a high temperature contrast, from 1400 K (night side) to 2700 K (day side). In Fig. 6, we show that the CO2 4.5 m region has strong overlap with the spectrum of SiO2, namely the band in the same region, although the strongest absorption bands are and where states are labelled by the quantum numbers (). An absorption spectrum of water is also shown for comparison. Silicon dioxide has also been suggested as a potential constituent of the atmosphere of the super-Earth Corot-7b (Schaefer, Lodders & Fegley, 2012) and thus should be included in retrievals for hot super-Earths.
4 Conclusion
A comprehensive molecular line list for SiO2 has been presented. The line list, named OYT3, covers the 0 – 6000 cm-1 range (wavelengths m) for states below and is applicable for temperatures up to 3000 K. As discussed above, the lack of reliable experimental spectroscopic data on SiO2 has meant that the OYT3 line list has been constructed using purely ab initio methods with no degree of empirical refinement. The accuracy of the predicted line positions will suffer as a result, particularly for highly excited states and shorter wavelengths, but for the fundamental bands, which have the strongest intensity, the errors should be within 1–3 cm-1 as a conservative estimate. The computed line intensities should not be overly affected and are largely expected to be within the 5–10% of experimentally determined intensities. Of course, without reliable experimental data to compare against these are only estimates based on our previous experience constructing ab initio spectroscopic models with similar electronic structure methods (see, for example, our work on SiH4 (Owens et al., 2015b).
The usual ExoMol methodology is to take advantage of laboratory measurements to improve the accuracy of our computed line lists (Tennyson, 2012). However, in the absence of high-resolution spectroscopic measurements for SiO2, this has not proved possible. In practice a number of current line lists are entirely ab initio. Of course, for few electron systems such as HD+ (Amaral et al., 2019), HD (Amaral et al., 2019), HeH+ (Engel et al., 2005; Amaral et al., 2019), H (Mizus et al., 2017) and LiH (Coppola, Lodi & Tennyson, 2011) it is possible to compute high accuracy line lists which should reproduce astronomical spectra within their observational accuracy. More pertinent here is the case of HCN. The original HCN / HNC line list of Harris, Polyansky & Tennyson (2002) was based on a purely ab initio potential energy and dipole surfaces (van Mourik et al., 2001) computed at a lower level of theory, and hence of lower accuracy, than that employed here. This line list has been successively updated (Harris et al., 2006; Barber et al., 2014), and even adapted to H13CN (Harris et al., 2008), by the post hoc insertion of empirical energy levels, something that is explicitly allowed for in the ExoMol data format (Tennyson, Hill & Yurchenko, 2013). The HCN line list both in its original and updated forms has proved to be highly useful and indeed underpins a number of recent (possible) detections of HCN in exoplanets (Tsiaras et al., 2016; Hawker et al., 2018; Gandhi et al., 2020) and much exoplanet modelling; it has also been found useful for combustion studies (Glarborg & Marshall, 2017). We would anticipate the OYT3 SiO2 line list being used in a similar fashion and, should high resolution SiO2 spectra become available, we will update the line list to improve its accuracy. However, we are unaware of any such studies in progress at present.
For present use, we recommend the OYT3 line list for low-resolution studies of exoplanet atmospheres, e.g. with a resolving power of , but we emphasise that the line list is not designed for high-resolution analysis. Interestingly, a recent cold molecular beam study has shown that silicon dioxide can be efficiently formed through the reaction of SiH and O2 under single collision conditions (Yang et al., 2018), demonstrating a low-temperature pathway to gas-phase SiO2 that is plausible in the interstellar medium or molecular clouds. The OYT3 line list will aid other astronomical searches for SiO2 and may find use in industrial processes, for example, in the semiconductor industry where silicon-bearing molecules are commonly encountered.
Acknowledgments
This work was supported by the STFC Projects No. ST/M001334/1 and ST/R000476/1. The authors acknowledge the use of the UCL Legion High Performance Computing Facility (Legion@UCL) and associated support services in the completion of this work, along with the Cambridge Service for Data Driven Discovery (CSD3), part of which is operated by the University of Cambridge Research Computing on behalf of the STFC DiRAC HPC Facility (www.dirac.ac.uk). The DiRAC component of CSD3 was funded by BEIS capital funding via STFC capital grants ST/P002307/1 and ST/R002452/1 and STFC operations grant ST/R00689X/1. DiRAC is part of the National e-Infrastructure.
References
- Adler, Knizia & Werner (2007) Adler T. B., Knizia G., Werner H. J., 2007, J. Chem. Phys., 127, 221106
- Amaral et al. (2019) Amaral P. H. R., Diniz L. G., Jones K. A., Stanke M., Alijah A., Adamowicz L., Mohallem J. R., 2019, ApJ, 878, 95
- Andrews & McCluskey (1992) Andrews L., McCluskey M., 1992, J. Mol. Spectrosc., 154, 223
- Barber et al. (2014) Barber R. J., Strange J. K., Hill C., Polyansky O. L., Mellau G. C., Yurchenko S. N., Tennyson J., 2014, MNRAS, 437, 1828
- Barton, Yurchenko & Tennyson (2013) Barton E. J., Yurchenko S. N., Tennyson J., 2013, MNRAS, 434, 1469
- Brinkmann, Tschumper & Schaefer III (1999) Brinkmann N. R., Tschumper G. S., Schaefer III H. F., 1999, J. Chem. Phys., 110, 6240
- Brown et al. (1975) Brown J. M. et al., 1975, J. Mol. Spectrosc., 55, 500
- Bunker & Jensen (1998) Bunker P. R., Jensen P., 1998, Molecular Symmetry and Spectroscopy, 2nd edn. NRC Research Press, Ottawa
- Carter, Handy & Sutcliffe (1983) Carter S., Handy N., Sutcliffe B., 1983, Mol. Phys., 49, 745
- CFOUR (2019) CFOUR, 2019. A quantum chemical program package written by J. F. Stanton, J. Gauss, M. E. Harding, and P. G. Szalay with contributions from A. A. Auer, R. J. Bartlett, U. Benedikt, C. Berger, D. E. Bernholdt, Y. J. Bomble, L. Cheng, O. Christiansen, M. Heckert, O. Heun, C. Huber, T.-C. Jagau, D. Jonsson, J. Jusélius, K. Klein, W. J. Lauderdale, D. A. Matthews, T. Metzroth, L. A. Mück, D. P. O’Neill, D. R. Price, E. Prochnow, C. Puzzarini, K. Ruud, F. Schiffmann, W. Schwalbach, S. Stopkowicz, A. Tajti, J. Vázquez, F. Wang, J. D. Watts, and the integral packages MOLECULE (J. Almlöf and P. R. Taylor), PROPS (P. R. Taylor), ABACUS (T. Helgaker, H. J. Aa. Jensen, P. Jørgensen, and J. Olsen), and ECP routines by A. V. Mitin and C. van Wüllen. For the current version, see http://www.cfour.de.
- Chubb et al. (2018) Chubb K. L., Yachmenev A., Tennyson J., Yurchenko S. N., 2018, J. Chem. Phys., 149, 014101
- Clark et al. (2020) Clark V. H. J., Owens A., Tennyson J., Yurchenko S. N., 2020, J. Quant. Spectrosc. Radiat. Transf., 246, 106929
- Cooley (1961) Cooley J. W., 1961, Math. Comp., 15, 363
- Coppola, Lodi & Tennyson (2011) Coppola C. M., Lodi L., Tennyson J., 2011, MNRAS, 415, 487
- Császár, Allen & Schaefer III (1998) Császár A. G., Allen W. D., Schaefer III H. F., 1998, J. Chem. Phys., 108, 9751
- de Jong, Harrison & Dixon (2001) de Jong W. A., Harrison R. J., Dixon D. A., 2001, J. Chem. Phys., 114, 48
- Demory et al. (2016) Demory B.-O. et al., 2016, Nature, 532, 207
- Douglas & Kroll (1974) Douglas M., Kroll N. M., 1974, Ann. Phys., 82, 89
- Dunning (1989) Dunning T. H., 1989, J. Chem. Phys., 90, 1007
- Engel et al. (2005) Engel E. A., Doss N., Harris G. J., Tennyson J., 2005, MNRAS, 357, 471
- Fegley et al. (2016) Fegley, Jr. B., Jacobson N. S., Williams K. B., Plane J. M. C., Schaefer L., Lodders K., 2016, ApJ, 824, 103
- Gandhi et al. (2020) Gandhi S. et al., 2020, MNRAS, 495, 224–237
- Glarborg & Marshall (2017) Glarborg P., Marshall P., 2017, Energy & Fuels, 31, 2156
- Gorman, Yurchenko & Tennyson (2019) Gorman M., Yurchenko S. N., Tennyson J., 2019, MNRAS, 490, 1652
- Hao, Xie & Schaefer III (2014) Hao Y., Xie Y., Schaefer III H. F., 2014, RSC Adv., 4, 47163
- Harris et al. (2008) Harris G. J., Larner F. C., Tennyson J., Kaminsky B. M., Pavlenko Y. V., Jones H. R. A., 2008, MNRAS, 390, 143
- Harris, Polyansky & Tennyson (2002) Harris G. J., Polyansky O. L., Tennyson J., 2002, ApJ, 578, 657
- Harris et al. (2006) Harris G. J., Tennyson J., Kaminsky B. M., Pavlenko Y. V., Jones H. R. A., 2006, MNRAS, 367, 400
- Hättig (2005) Hättig C., 2005, Phys. Chem. Chem. Phys., 7, 59
- Hawker et al. (2018) Hawker G. A., Madhusudhan N., Cabot S. H. C., Gandhi S., 2018, ApJL, 863, L11
- Heß (1986) Heß B. A., 1986, Phys. Rev. A, 33, 3742
- Hill, Mazumder & Peterson (2010) Hill J. G., Mazumder S., Peterson K. A., 2010, J. Chem. Phys., 132, 054108
- Hill et al. (2009) Hill J. G., Peterson K. A., Knizia G., Werner H.-J., 2009, J. Chem. Phys., 131, 194105
- Jacox (1994) Jacox M. E., 1994, Chem. Phys., 189, 149
- Jørgensen & Jensen (1993) Jørgensen U. G., Jensen P., 1993, J. Mol. Spectrosc., 161, 219
- Kállay & Gauss (2005) Kállay M., Gauss J., 2005, J. Chem. Phys., 123, 214105
- Kállay & Gauss (2008) Kállay M., Gauss J., 2008, J. Chem. Phys., 129, 144101
- Kállay et al. (2020) Kállay M. et al., 2020, J. Chem. Phys., 152, 074107
- Kaufman, Muenter & Klemperer (1967) Kaufman M., Muenter J., Klemperer W., 1967, J. Chem. Phys., 47, 3365
- Kostko, Ahmed & Metz (2009) Kostko O., Ahmed M., Metz R. B., 2009, J. Phys. Chem. A, 113, 1225
- Miguel et al. (2011) Miguel Y., Kaltenegger L., Fegley B., Schaefer L., 2011, ApJ, 742, L19
- Mizus et al. (2017) Mizus I. I., Alijah A., Zobov N. F., Kyuberis A. A., Yurchenko S. N., Tennyson J., Polyansky O. L., 2017, MNRAS, 468, 1717
- Neale, Miller & Tennyson (1996) Neale L., Miller S., Tennyson J., 1996, ApJ, 464, 516
- Noumerov (1924) Noumerov B. V., 1924, MNRAS, 84, 592
- Owens et al. (2018) Owens A., Yachmenev A., Küpper J., Yurchenko S. N., Thiel W., 2018, Phys. Chem. Chem. Phys., 21, 3496
- Owens & Yurchenko (2019) Owens A., Yurchenko S. N., 2019, J. Chem. Phys., 150, 194308
- Owens et al. (2015a) Owens A., Yurchenko S. N., Yachmenev A., Tennyson J., Thiel W., 2015a, J. Chem. Phys., 142, 244306
- Owens et al. (2016) Owens A., Yurchenko S. N., Yachmenev A., Tennyson J., Thiel W., 2016, J. Chem. Phys., 145, 104305
- Owens et al. (2015b) Owens A., Yurchenko S. N., Yachmenev A., Thiel W., 2015b, J. Chem. Phys., 143, 244317
- Owens et al. (2017) Owens A., Yurchenko S. N., Yachmenev A., Thiel W., Tennyson J., 2017, MNRAS, 471, 5025
- Pacansky & Hermann (1978) Pacansky J., Hermann K., 1978, J. Chem. Phys., 69, 963
- Partridge & Schwenke (1997) Partridge H., Schwenke D. W., 1997, J. Chem. Phys., 106, 4618
- Peterson, Adler & Werner (2008) Peterson K. A., Adler T. B., Werner H.-J., 2008, J. Chem. Phys., 128, 084102
- Polyansky et al. (2018) Polyansky O. L., Kyuberis A. A., Zobov N. F., Tennyson J., Yurchenko S. N., Lodi L., 2018, MNRAS, 480, 2597
- Schaefer & Fegley (2009) Schaefer L., Fegley B., 2009, ApJ, 703, L113
- Schaefer, Lodders & Fegley (2012) Schaefer L., Lodders K., Fegley, Jr. B., 2012, ApJ, 755, 41
- Schnöckel (1978) Schnöckel H., 1978, Angew. Chem. Int. Ed. Engl., 17, 616
- Schnöckel (1980) Schnöckel H., 1980, Z. anorg. allg. Chem., 460, 37
- Sutcliffe & Tennyson (1991) Sutcliffe B. T., Tennyson J., 1991, Intern. J. Quantum Chem., 39, 183
- Ten-No (2004) Ten-No S., 2004, Chem. Phys. Lett., 398, 56
- Tennyson (2012) Tennyson J., 2012, WIREs Comput. Mol. Sci., 2, 698
- Tennyson (2014) Tennyson J., 2014, J. Mol. Spectrosc., 298, 1
- Tennyson (2016) Tennyson J., 2016, J. Chem. Phys., 145, 120901
- Tennyson, Hill & Yurchenko (2013) Tennyson J., Hill C., Yurchenko S. N., 2013, in AIP Conference Proceedings, Vol. 1545, 6th international conference on atomic and molecular data and their applications ICAMDATA-2012, AIP, New York, pp. 186–195
- Tennyson et al. (2004) Tennyson J., Kostin M. A., Barletta P., Harris G. J., Polyansky O. L., Ramanlal J., Zobov N. F., 2004, Comput. Phys. Commun., 163, 85
- Tennyson & Sutcliffe (1982) Tennyson J., Sutcliffe B. T., 1982, J. Chem. Phys., 77, 4061
- Tennyson & Sutcliffe (1986) Tennyson J., Sutcliffe B. T., 1986, Mol. Phys., 58, 1067
- Tennyson & Sutcliffe (1992) Tennyson J., Sutcliffe B. T., 1992, Intern. J. Quantum Chem., 42, 941
- Tennyson & Yurchenko (2012) Tennyson J., Yurchenko S. N., 2012, MNRAS, 425, 21
- Tennyson & Yurchenko (2017a) Tennyson J., Yurchenko S. N., 2017a, Mol. Astrophys., 8, 1
- Tennyson & Yurchenko (2017b) Tennyson J., Yurchenko S. N., 2017b, Intern. J. Quantum Chem., 117, 92
- Tennyson & Yurchenko (2018) Tennyson J., Yurchenko S. N., 2018, Atoms, 6, 26
- Tennyson et al. (2016) Tennyson J. et al., 2016, J. Mol. Spectrosc., 327, 73
- Tsiaras et al. (2016) Tsiaras A. et al., 2016, ApJ, 820, 99
- Tyuterev, Tashkun & Schwenke (2001) Tyuterev V. G., Tashkun S. A., Schwenke D. W., 2001, Chem. Phys. Lett., 348, 223
- Upadhyay et al. (2018) Upadhyay A., Conway E. K., Tennyson J., Yurchenko S. N., 2018, MNRAS, 477, 1520
- van Mourik et al. (2001) van Mourik T., Harris G. J., Polyansky O. L., Tennyson J., Császár A. G., Knowles P. J., 2001, J. Chem. Phys., 115, 3706
- Wang et al. (1996) Wang L.-S., Wu H., Desai S. R., Fan J., Colson S. D., 1996, J. Phys. Chem., 100, 8697
- Watson (2003) Watson J. K. G., 2003, J. Mol. Spectrosc., 219, 326
- Weigend (2002) Weigend F., 2002, Phys. Chem. Chem. Phys., 4, 4285
- Werner et al. (2012) Werner H.-J., Knowles P. J., Knizia G., Manby F. R., Schütz M., 2012, WIREs Comput. Mol. Sci., 2, 242
- Yachmenev & Yurchenko (2015) Yachmenev A., Yurchenko S. N., 2015, J. Chem. Phys., 143, 014105
- Yachmenev et al. (2011) Yachmenev A., Yurchenko S. N., Ribeyre T., Thiel W., 2011, J. Chem. Phys., 135, 074302
- Yang et al. (2018) Yang T., Thomas A. M., Dangi B. B., Kaiser R. I., Mebel A. M., Millar T. J., 2018, Nat. Commun., 9
- Yousaf & Peterson (2008) Yousaf K. E., Peterson K. A., 2008, J. Chem. Phys., 129, 184108
- Yurchenko (2014) Yurchenko S. N., 2014, in Chemical Modelling: Volume 10, Vol. 10, The Royal Society of Chemistry, pp. 183–228
- Yurchenko, Al-Refaie & Tennyson (2018) Yurchenko S. N., Al-Refaie A. F., Tennyson J., 2018, A&A, 614, A131
- Yurchenko et al. (2009) Yurchenko S. N., Barber R. J., Yachmenev A., Thiel W., Jensen P., Tennyson J., 2009, J. Phys. Chem. A, 113, 11845
- Yurchenko et al. (2020) Yurchenko S. N., Tennyson J., Miller S., Melnikov V. V., O’Donoghue J., Moore L., 2020, MNRAS
- Yurchenko, Thiel & Jensen (2007) Yurchenko S. N., Thiel W., Jensen P., 2007, J. Mol. Spectrosc., 245, 126
- Yurchenko, Yachmenev & Ovsyannikov (2017) Yurchenko S. N., Yachmenev A., Ovsyannikov R. I., 2017, J. Chem. Theory Comput., 13, 4368
Supporting Information
Supplementary data are available at MNRAS online. This includes the potential energy and dipole moment surfaces of SiO2 with programs to construct them, and values of the temperature-dependent partition function of SiO2 up to 3000 K. The following references were cited in the supplementary material: (Owens et al., 2015a, b, 2016, 2018; Owens & Yurchenko, 2019; Császár, Allen & Schaefer III, 1998; Adler, Knizia & Werner, 2007; Peterson, Adler & Werner, 2008; Hill et al., 2009; Ten-No, 2004; Yousaf & Peterson, 2008; Weigend, 2002; Hättig, 2005; Werner et al., 2012; Yachmenev et al., 2011; Hill, Mazumder & Peterson, 2010; Kállay & Gauss, 2005, 2008; Kállay et al., 2020; CFOUR, 2019; Dunning, 1989; Douglas & Kroll, 1974; Heß, 1986; de Jong, Harrison & Dixon, 2001; Tyuterev, Tashkun & Schwenke, 2001; Partridge & Schwenke, 1997; Watson, 2003; Jørgensen & Jensen, 1993; Yurchenko, Thiel & Jensen, 2007; Yurchenko et al., 2009; Yachmenev & Yurchenko, 2015; Tennyson & Yurchenko, 2017b; Yurchenko, Yachmenev & Ovsyannikov, 2017; Chubb et al., 2018; Carter, Handy & Sutcliffe, 1983; Sutcliffe & Tennyson, 1991; Noumerov, 1924; Cooley, 1961; Tennyson & Sutcliffe, 1986; Tennyson et al., 2004; Tennyson & Sutcliffe, 1992, 1982; Yurchenko, Al-Refaie & Tennyson, 2018)