HST Proper Motions of NGC 147 and NGC 185: Orbital Histories and Tests of a Dynamically Coherent Andromeda Satellite Plane
Abstract
We present the first proper motion (PM) measurements for the dwarf elliptical galaxies NGC 147 and NGC 185, two satellite galaxies of M31, using multi-epoch HST imaging data with time baselines of years. For each galaxy, we take an error-weighted average of measurements from HST ACS/WFC and WFC3/UVIS to determine the PMs. Our final results for the PMs are for NGC 147, and for NGC 185. The 2-dimensional direction of motion for NGC 147 about M31 is found to be aligned with its tidal tails. The 3-d positions and velocities of both galaxies are transformed into a common M31-centric coordinate system to study the detailed orbital histories of the combined M31+NGC 147+NGC 185 system via numerical orbit integration. We find that NGC 147 (NGC 185) had its closest passage to M31 0.3–0.5 Gyr ( Gyr) within the past 6 Gyr at distances of kpc (70–260 kpc). The pericentric times of NGC 147/NGC 185 correlate qualitatively well with the presence/absence of tidal tails seen around the galaxies. Our PMs show that the orbital poles of NGC 147, and also NGC 185 albeit to a lesser degree, agree within the uncertainties with the normal of the Great Plane of Andromeda (GPoA). These are the first measurements of the 3-d angular momentum vector of any satellite identified as original GPoA members. Our results strengthen the hypothesis that the GPoA may be a dynamically coherent entity. We revisit previous claims that NGC 147 and NGC 185 are binary galaxies and conclude that it is very unlikely the two galaxies were ever gravitationally bound to each other.
1 Introduction
Dynamical histories of satellite dwarf galaxies are essential for understanding their formation and evolution, as well as for exploring what roles they have played in the assembly of their hosts. Access to three-dimensional (3-d) space motions, which requires proper motion (PM) measurements combined with line-of-sight velocities (), allow reconstructing orbits of dwarf galaxies. In the past decade, PM results from both the Hubble Space Telescope (HST) and Gaia have tremendously advanced our understanding of the Milky Way (MW) halo. For example, PMs of satellite galaxies as a whole have allowed us to constrain the total mass of the MW by directly using 3-d motions without relying on model assumptions of the underlying velocity anisotropy distribution (Callingham et al., 2018; Patel et al., 2018; Fritz et al., 2020). Additionally, individual PMs of satellites have revealed interesting physics that has not been accessible through alone. Perhaps, the best examples are results showing that the Magellanic Clouds are on their first passage about the MW (Kallivayalil et al., 2006; Besla et al., 2007; Kallivayalil et al., 2013), and the first confirmation of a ‘satellites of satellites’ hierarchy, i.e., clustering of low-mass dwarf satellites around the Clouds that entered the MW’s halo as a group (Kallivayalil et al., 2018; Erkal et al., 2020; Patel, et al., 2020). While the MW satellite system can be studied with this excellent level of detail, our general knowledge of satellite systems is limited primarily by the lack of equivalent 3-d motions for satellite populations around other MW-like galaxies. The M31 system provides the best opportunity for expanding our knowledge as well as for placing the MW system in a cosmological context since it is the only other MW-like system for which PM measurements are possible using current or planned space-based observatories.
Compared to the MW, PM studies in the M31 system are in their very early stages. Among the M31 satellites, there are only two galaxies with PMs measured so far: M33 using VLBA and Gaia observations (Brunthaler et al., 2005; van der Marel et al., 2019); and IC 10 using VLBA observations (Brunthaler et al., 2007). While Gaia has proven invaluable for MW science, it has limited access to the M31 system since only the brightest stars in star-forming regions are detected at the distance of M31 (van der Marel et al., 2019), whereas most M31 satellites are composed exclusively of old stars as revealed by their star formation histories (SFHs; Weisz et al., 2014; Skillman et al., 2017; Weisz et al., 2019).
NGC 147 and NGC 185 are located in the outer halo of M31 and are the best observed of any dwarf elliptical (dE) galaxies, owing to their proximity to us at heliocentric distances of 724 and 636 kpc, respectively (Geha et al., 2015). Separated by only on the sky, the two galaxies are fairly similar in mass, size, and stellar metallicity (Geha et al., 2010). Because it is considered an impressive coincidence to find two massive and similar satellites of M31 so close together on the sky with nearly identical line-of-sight velocities (), it has often been assumed NGC 147 and NGC 185 form a dynamically bound pair (van den Bergh, 1998).
However, the two galaxies show important differences. Based on the distances as measured by Geha et al. (2015, which agrees very well with the measurements by ), NGC 147 and NGC 185 are respectively located at distances of and kpc (M31-centric distances of and kpc; see Section 3.2 for the details on the M31-centric coordinates), and the three-dimensional (3-d) separation between the two galaxies is kpc. This indicates that NGC 147 and NGC 185 may be a chance alignment rather than a physical pair. If this physical separation is correct, their mutual gravity is unlikely to overcome the tidal force of M31 (i.e., their separation exceeds the Jacobi radius of the pair). Second, NGC 147 and NGC 185 exhibit stark differences in terms of their stellar populations. By studying the color-magnitude diagram (CMD) down to the main sequence with HST ACS/WFC, Geha et al. (2015) found that almost all of NGC 185’s stars formed Gyr ago, whereas NGC 147’s stars formed on average much more recently, with half forming Gyr ago. Third, NGC 185 bears gas, while NGC 147 has a severe lack thereof (Young & Lo, 1997; Marleau et al., 2010). Fourth, NGC 147 exhibits 50 kpc-long tidal tails pointing nearly radially toward and away from M31, while NGC 185 appears relatively undisturbed (Crnojević et al., 2014). Altogether, these properties suggest that the two galaxies may have had different orbital trajectories, although a scenario where they shared orbits until recently is not entirely ruled out (Arias et al., 2016). In this paper, we will reconstruct the mutual orbital histories of NGC 147 and NGC 185, providing the first assessment of these differences from a dynamical point of view.
NGC 147 and NGC 185 are important in the context of the formation of dEs. There are no morphological counterparts of these dE galaxies found in the MW halo, and so their formation mechanism may be related to e.g., environmental differences between the MW and M31. Interestingly, in hydrodynamic cosmological zoom-in simulations, Garrison-Kimmel et al. (2019) successfully reproduced the majority of satellite population found in the Local Group, but they find that “The simulations here do not produce any galaxies with densities as high as those of the baryon-dominated compact dEs around M31 …” Orbits of NGC 147 and NGC 185 may shed light on how such high-density dEs form and evolve in the halos of MW-like galaxies.
Lastly, Ibata et al. (2013) found that more than half of M31’s satellites rotate coherently within a narrow plane of satellites dubbed the ‘Great Plane of Andromeda’ (GPoA). This structure is seen nearly edge-on from the MW allowing to be used directly as a measure of whether the satellites exhibit coherent rotation. However, GPoA-like structures with subhalos exhibiting coherent in cosmological simulations are rare (Ibata et al., 2014; Pawlowski et al., 2019, and references therein) and only last for a short period of time, e.g., less than a typical satellite orbital timescale (Gillet et al., 2015; Fernando et al., 2017; Santos-Santos et al., 2020). It is therefore crucial to understand whether the GPoA is a dynamically stable structure over time (Hodkinson & Scholtz, 2019), or a transient structure. Both NGC 147 and NGC 185 are posited to be members of this plane, and thus provide the first opportunity to test this hypothesis.
In this paper, we present the first PM measurements for the M31 satellite dEs NGC 147 and NGC 185 using multi-epoch data obtained with HST. This paper is organized as follows. In Section 2, we provide details on the data, the PM measurement process, and results of our measurements. In Section 3, we derive the M31-centric space motions of NGC 147 and NGC 185, and use them to gain insights about M31’s mass via escape velocities. In Section 4, we investigate the implications for the past orbits of NGC 147 and NGC 185 under various assumptions for the M31 mass and M31 tangential velocity () zero point. In Section 5, we explore whether the 3-d motions of the satellites are aligned with the GPoA. Finally, in Section 6, we summarize the main results of our study.
2 Proper Motions
2.1 Data
| Epoch 1 | Epoch 2 | |||||||
|---|---|---|---|---|---|---|---|---|
| R.A. (J2000) | Decl. (J2000) | Date | Exp. TimeaaExposure times in (seconds) (number of exposures) format. Here we list the average of the entire exposures, but the actual individual exposure times vary by only a few percent in length. | Date | Exp. TimeaaExposure times in (seconds) (number of exposures) format. Here we list the average of the entire exposures, but the actual individual exposure times vary by only a few percent in length. | |||
| Field | () | () | (Y-M-D) | (s) | (Y-M-D) | (s) | ||
| NGC 147 | F606W | F814W | F606W | |||||
| ACS/WFC | 2009-11-21 | 1368s20 | 1373s32 | 2017-11-18 | 1369s8 | |||
| WFC3/UVIS | 2009-11-21 | 1387s20 | 1392s32 | 2017-11-18 | 1404s8 | |||
| NGC 185 | F606W | F814W | F606W | |||||
| ACS/WFC | 2010-01-14 | 1358s20 | 1363s32 | 2017-12-30 | 1369s8 | |||
| WFC3/UVIS | 2010-01-14 | 1375s20 | 1383s32 | 2017-12-30 | 1404s8 | |||
We use HST data obtained in two different epochs to measure the PMs of NGC 147 and NGC 185. For the first-epoch data of both galaxies, we use the images obtained through HST program GO-11724 (PI: M. Geha). The ACS/WFC images for this program were used by Geha et al. (2015) to construct CMDs that reach several magnitudes below the main-sequence turnoff (MSTO) of the oldest populations, allowing them to study the SFHs of these galaxies in detail. The WFC3/UVIS images were obtained as parallel observations to the ACS/WFC images, and are located much farther from the center of each galaxy. Because of this, the stellar number densities in the WFC3/UVIS fields are far lower than those in the ACS/WFC fields. Both the ACS/WFC and WFC3/UVIS images were obtained using the broadband F606W and F814W filters. Figure 1 shows the location of ACS/WFC and WFC3/UVIS fields on the sky with respect to NGC 147 and NGC 185.
All ACS/WFC and WFC3/UVIS fields were observed again years later through HST program GO-14769 (Co-PIs: S. T. Sohn & M. A. Fardal) to measure the PMs presented in this analysis. We used the same telescope pointings and orientations as in the first-epoch observations to ensure that systematics related to the difference in positions on the detector (e.g., residual geometric distortions and charge transfer efficiency or CTE) are minimized. We obtained images only using the F606W filter in the second epoch since F606W gives the best astrometric handle on background galaxies based on our previous works (Sohn et al., 2012). All individual exposures of the first and second epochs were dithered using pre-defined patterns that maximize pixel-phase coverage. All the data used in the study is available at https://doi.org/10.17909/t9-1pcz-se70 (catalog 10.17909/t9-1pcz-se70).
2.2 Measurements
For the PM measurements of NGC 147 and NGC 185, we closely follow the established methods employed by our previous works on M31, Leo I, and Draco/Sculptor dwarf spheroidal galaxies (Sohn et al., 2012, 2013, 2017). Here we outline the general processes, but we refer readers interested in the details of the measurement process to the papers above.
All first- and second-epoch data are downloaded from the Mikulski Archive for Space Telescopes (MAST). We specifically download the _flc.fits images that have been processed for the imperfect charge transfer efficiency (CTE) using the correction algorithms of Anderson & Bedin (2010). We determine a position and a flux for each star detected in the individual _flc.fits images using the FORTRAN code img2xym_WFC.09x10 for ACS/WFC (Anderson, 2006) and an equivalent code for WFC3/UVIS. The measured positions are corrected for geometric distortion using the solutions provided by Anderson & King (2006) for ACS/WFC and by Bellini et al. (2011) for WFC3/UVIS. For each galaxy, we then create high-resolution stacked images with pixel scales of and arcsec pix-1 for ACS/WFC and WFC3/UVIS, respectively, using the first-epoch data.
Stars associated with NGC 147 and NGC 185 are identified via CMDs constructed from photometry of the first-epoch F606W and F814W images (Geha et al., 2015). Through this process, we select stars for each of NGC 147 and NGC 185 in their ACS/WFC fields. For the WFC3/UVIS fields, our final lists include stars for each of NGC 147 and NGC 185. While there is about an order of magnitude difference compared to the numbers of stars in the ACS/WFC fields, the WFC3/UVIS samples are still large enough for measuring reliable PMs as will be shown in Section 2.3.
Background galaxies are identified through a two-step process: first, an initial objective selection based on the quality-of-fit parameter output from the source detection code described above; second, visually inspecting each source identified in the initial stage, and adding additional extended sources that were missed by the source detection code. Consequently, we identify (NGC 147) and (NGC 185) useful background galaxies in the ACS/WFC fields, and (NGC 147) and (NGC 185) background galaxies in the WFC3/UVIS fields. The number ratios between background galaxies identified in the WFC3/UVIS and ACS/WFC fields correlate very well with the area ratio between the two detectors, , indicating that by and large the number of background galaxies in these parts of the sky is isotropic.
For each star and background galaxy, we construct an empirical template by supersampling the scene extracted from the high-resolution stack. Each template constructed this way takes into account the PSF, the galaxy morphology (in case of the background galaxies), and the pixel binning. Templates are “blotted” back to each individual _flc.fits image to measure the position of each star or galaxy. For images of the first-epoch, templates are fit directly (since the templates were built from that epoch), while for the second-epoch, we include pixel convolution kernels when fitting templates to allow for differences in PSF between the two epochs. These convolution kernels are derived by comparing PSFs of numerous stars associated with the target dwarf galaxies between the first- and second-epoch data.
The reference frames are defined by averaging the template-based positions of stars from repeated exposures of the first epoch. We use the positions of stars in each second-epoch exposure to transform the template-measured positions of the galaxies into the reference frames. We then measure the difference between the first- and second-epoch position of each galaxy with respect to the stars associated with NGC 147 and NGC 185. For each galaxy, we calculate and apply a ‘local correction’ using stars with similar brightness in the vicinity (typically magnitude, and within a 200 pixel radius). This step ensures that any remaining systematics related to detector position or source brightness are corrected. For each individual second-epoch exposure, we take the error-weighted average over all displacements of background galaxies with respect to the NGC 147 and NGC 185 stars to obtain an independent PM estimate. The associated uncertainty is computed using the bootstrap method on the displacements of background galaxies. We note that the uncertainties in individual PM estimates are dominated by the background galaxy measurements, since there are far more stars in our fields than background galaxies, and since positions of stars are generally better determined than those of galaxies. The PM and associated error of each target galaxy are obtained by taking the error-weighted mean of the individual PM estimates. We then convert them to final PM results in units of via multiplying by the pixel scale of our reference frames (0.050 arcsec pix-1 for ACS/WFC and 40 arcsec pix-1 for WFC3/UVIS), and dividing by the time baseline of our observations.
2.3 Results
| NGC 147 | NGC 185 | ||||
|---|---|---|---|---|---|
| aa and are defined as the PMs in West () and North () directions, respectively. | bbLookback time of the most recent peri-/apo-centric passage. | aa and are defined as the PMs in West () and North () directions, respectively. | bbLookback time of the most recent peri-/apo-centric passage. | ||
| () | () | () | () | ||
| ACS/WFC | |||||
| WFC3/UVIS | |||||
| Weighted average | |||||

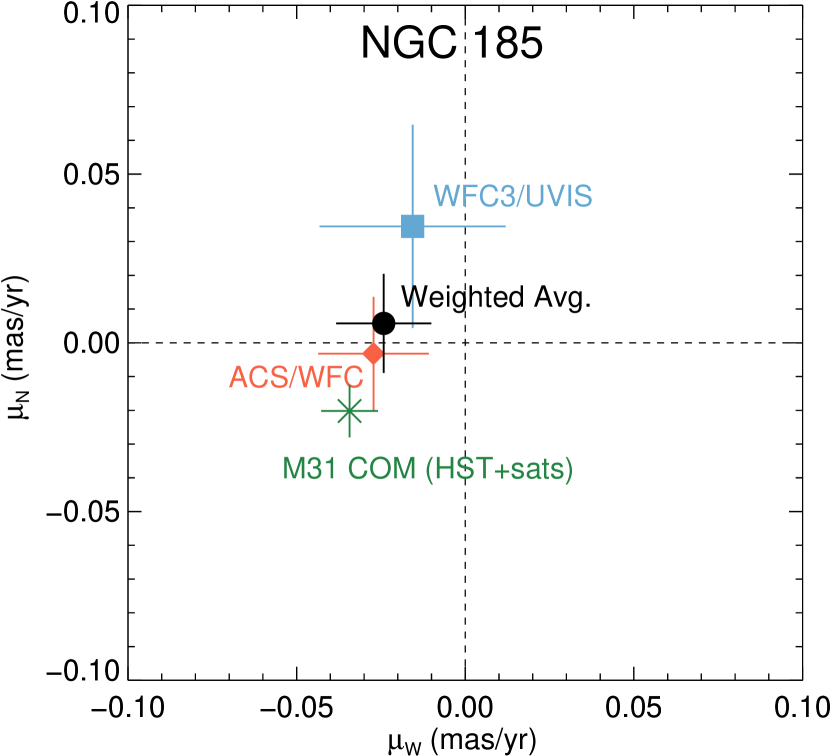
Table 2 lists the PM results of the four target fields along with the error-weighted averages for each galaxy. The corresponding PM diagrams are shown in Figure 2.
The PM measurements for the ACS/WFC and WFC3/UVIS fields of both NGC 147 and NGC 185 appear to agree within their uncertainties in each coordinate. To test the statistical agreement among the measurements for different fields, we calculated the quantity
| (1) |
This quantity is expected to follow a probability distribution with an expectation value of the number of degrees of freedom () with a dispersion of . Since we have two independent measurements each in two directions on the sky per galaxy, the is then expected to have a value of with an uncertainty of . From Table 2 and Equation 1, we find and for NGC 147 and NGC 185, respectively, so we conclude that our results in Table 2 are consistent within the quoted uncertainties.
Because our target fields are offset from the centers of NGC 147 and NGC 185 (Figure 1), we consider the possibility that our measured PMs may not represent the center of mass (COM) motions of each galaxy. Any significant tangential (on-sky) motion of stars in our target fields relative to the center of each galaxy will affect the measured PMs. Here we consider the on-sky rotation (compared to the line-of-sight rotation) for each galaxy. While we are not able to directly measure the speed of on-sky rotation of either galaxy, the line-of-sight rotational motions provide hints on what to expect. Geha et al. (2010) measured the stellar kinematics out to 7–9 times the effective radii () of NGC 147 and NGC 185. For both galaxies, significant lines-of-sight rotation signatures were detected at levels of 15–17 . Our ACS/WFC target fields are in fact located at positions where stars with measurements exist. From Tables 6 and 7 of Geha et al. (2010), we selected stars that lie within the boundaries of our ACS/WFC fields and calculated the average heliocentric with respect to the systemic velocities of each galaxy. Results are and for NGC 147 and 185, respectively. Given the apparent flattening of both galaxies on the sky, it is unlikely that their speed of on-sky rotation will be significantly higher than their line-of-sight rotation. We consider the extreme case of the on-sky rotation being equal to the line-of-sight rotations. At the distances of NGC 147 and 185, our final random PM uncertainties are 50 and 43, respectively. These are significantly larger than the rotation with respect to the COM motion even when the two components are combined. We therefore conclude that our measured PMs and associated uncertainties represent the COM motions of both NGC 147 and NGC 185, and that no further corrections are required to the PMs as listed in the last rows of Table 2.
3 Space Motions
3.1 Two-dimensional Motions of NGC 147 and NGC 185
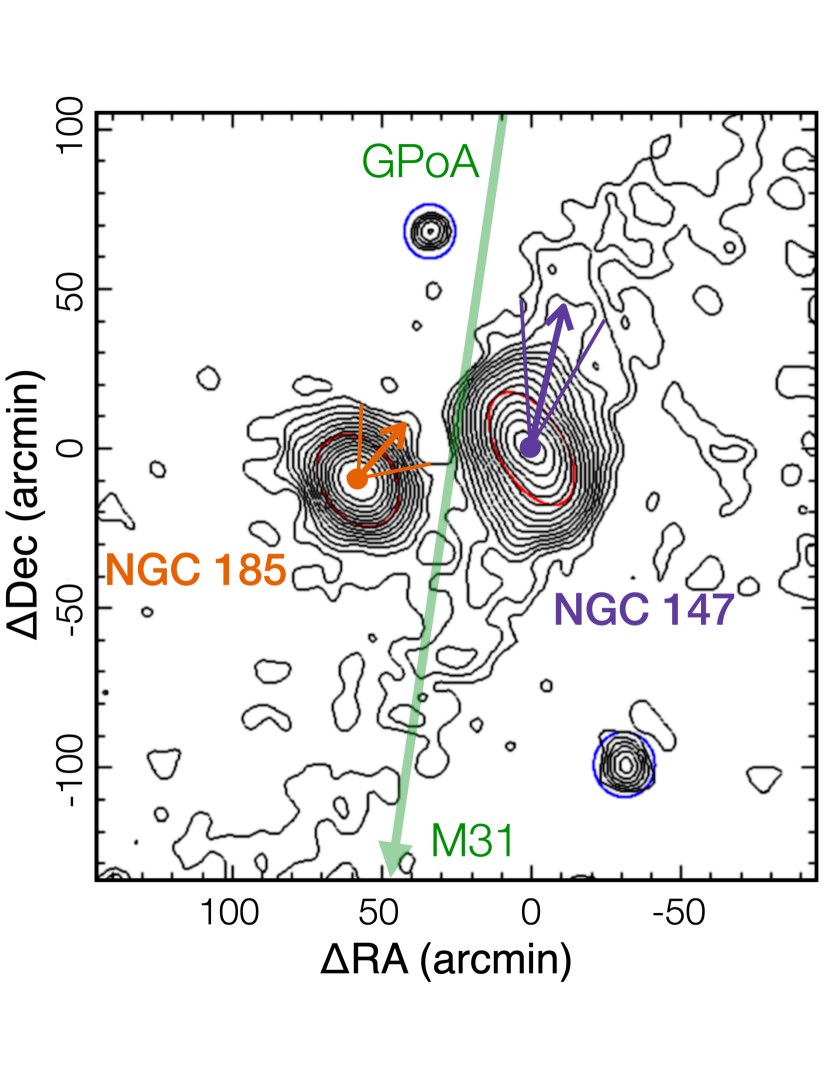
With the measured PMs of NGC 147 and NGC 185, we first illustrate their two-dimensional (2-d) motions with respect to M31 (i.e., projected on the plane of the sky). This is a useful exercise for visualizing how the two galaxies move relative to each other, and relative to other known structures such as the tidal tails around NGC 147. To do this, we subtract the PM contribution of M31 at each galaxy’s distance and location on the sky to bring their 2-d motions into the M31 rest frame. We adopt the M31 PM estimate of van der Marel et al. (2012) for this exercise.111Using the average of HST and Gaia DR2 measurements does not give much difference when visualizing, but we discuss the effect in Section 5. The resulting 2-d motions are shown in Figure 3. The 2-d motion vector of NGC 147 is well aligned with its tidal tails surrounding the main body as expected for the case of an ongoing disruption, as well as with the direction of the GPoA. NGC 185’s motion is not as well aligned, but is still marginally consistent with the direction of GPoA (angular offset between the green and orange lines is °). We will further discuss the 3-d motions of NGC 147 and NGC 185 relative to the GPoA in Section 5.
3.2 Three-dimensional Positions and Velocities in the M31-centric Rest Frame
To describe the space positions and velocities of NGC 147 and NGC 185, we follow a two-step process: first, we convert the observed parameters to Galactocentric positions and velocities; and second, we convert these to positions and velocities in the M31-centric rest frame. For the first step, we calculate the current Galactocentric positions and velocities using measurements of observed parameters, including PM results from Section 2.3, from Geha et al. (2010), and distances from Geha et al. (2015). As with our previous studies (Sohn et al., 2012, 2013, 2017), we adopt a Cartesian coordinate system with the origin at the Galactic center (thus denoted as the subscript GC), the -axis pointing in the direction from the Sun to the Galactic center, the -axis pointing in the direction of the Sun’s Galactic rotation, and the -axis pointing toward the Galactic north pole. The Galactocentric distance of the Sun and the circular velocity of the local standard of rest (LSR) are assumed to be kpc, and , respectively following McMillan (2011). The solar peculiar velocity with respect to the LSR are adopted from the estimates of Schönrich, Binney, & Dehnen (2010), i.e., with uncertainties of . The positions and velocities of NGC 147 and NGC 185 in this frame are
| (2) | |||||
| (3) |
and
| (4) | |||||
| (5) |
respectively.
The conversion of these Galactocentric positions and velocities to the M31-centric ones involve subtracting M31’s Galactocentric positions and velocities from Equations 2–5 so that positions and velocities are as observed from the M31 center, and rotating the axes to make the specific to M31’s orientation. We adopted M31’s Galactocentric position from van der Marel et al. (2012), which assumes a heliocentric distance to the M31 of 770 kpc:
| (6) |
Subtracting this from Equations 2 and 4 gives the Cartesian coordinates shifted to the M31 center, but still oriented along the Galactocentric coordinate axes. To transform this into a coordinate system specific to M31’s orientation, we adopted a system that has its origin at the center of M31, the - plane aligned with the disk of M31, -axis pointing away from the (center of) MW, and -axis pointing normal to the - plane. This is the system adopted by Metz et al. (2007, Appendix B) with slight differences: we used a Galactocentric distance of the Sun of 8.29 kpc, heliocentric distance to M31 of 770 kpc, and inclination and position angle of the M31 disk of and , respectively. The solution provided by Metz et al. (2007)222We note that there is a crucial typo in one of the equations provided by Metz et al. (2007). The resulting matrix shown in Equation B5 for should be transposed from its current form. is for transforming the observed heliocentric coordinates directly to M31-centric ones. For our purpose, we independently derived a rotation matrix that transforms a coordinate system aligned with the Galactocentric but have its zero-point shifted to the center of M31 to a coordinate system specific to M31’s orientation defined by Metz et al. (2007). The resulting matrix is
| (7) |
The full transformation of a given satellite’s Galactocentric position to the M31-centric position is then given by
| (8) |
The Galactocentric velocity of a given satellite can be transformed to the M31-centric velocity using the same rotation matrix as follows:
| (9) |
The Galactocentric velocity of M31 () in Equation 9 is essential since it provides the zero point of the satellites’ motions.
The line-of-sight velocity () of M31 has been known with great accuracy since the first measurement by Slipher (1913), but direct measurements of tangential motion has only been available since 2012. Using multi-epoch HST imaging data obtained using ACS/WFC and WFC3/UVIS, Sohn et al. (2012) determined absolute PM of M31 stars in three fields. van der Marel et al. (2012) corrected these measurements for internal kinematics, and combined them with the M31 motion estimate based on the kinematics of satellite galaxies of M31 and the Local Group. 333Salomon et al. (2016) also provided estimates of M31 based on satellite kinematics. Their methodology and results are similar to those presented in van der Marel et al. (2012), so using the Salomon et al. (2016) results instead would not change Equation 10 significantly. The resulting weighted-average estimate of the M31 COM tangential motion implies a Galactocentric velocity of
| (10) |
A more recent estimate of M31’s tangential motion was provided by van der Marel et al. (2019): their best estimate, after taking the average of the HST and the Gaia DR2 measurements implies
| (11) |
The difference in M31 3-d motions of these two measurements is which is much larger than the uncertainties of NGC 147 and NGC 185’s motions. Hence, the satellites’ motions with respect to M31 will have a non-negligible systematic difference depending on which velocity zero point is adopted. Due to its large distance, the M31 is inherently difficult to determine, and systematic uncertainties for any single measurement or estimate is hard to quantify. We therefore believe the best approach is to average results from independent determinations instead of relying on one. Equations 10 and 11 were both determined by taking error-weighted averages of independent measurements or estimates, and thus considered the most reliable determinations of M31 currently available. To explore the parameter space allowed by these two estimates of the M31 COM motion, and to examine the effects of using significantly different velocity zero points on the satellites’ motions, we decide to consider both as velocity zero points for the M31 system and denote them as HST+sats and HST+Gaia (as in Equations 10 and 11), respectively whenever necessary.
The positions and velocities of NGC 147 and NGC 185 in the M31-centric coordinate system are presented in Table 3. The uncertainties here and hereafter were obtained from a Monte Carlo scheme that propagates all observational uncertainties and their correlations, including uncertainties on the observed parameters adopted for the Sun. In the same table, we also list the M31-centric radial, tangential, and total velocities.
| Galaxy | (kpc) | (kpc) | (kpc) | () | () | () | () | () | () | |
|---|---|---|---|---|---|---|---|---|---|---|
| HST+sats M31 | ||||||||||
| NGC 147 | 66.4 | 58.0 | 60.8 | 63.929.1 | 111.456.8 | 157.952.6 | 110.475.5 | 171.047.8 | 203.545.6 | |
| NGC 185 | 147.6 | 57.5 | 24.6 | 78.027.8 | 17.651.2 | 99.347.6 | 50.344.8 | 117.240.8 | 127.531.8 | |
| HST+Gaia M31 | ||||||||||
| NGC 147 | 66.4 | 58.0 | 60.8 | 46.236.4 | 127.162.0 | 238.656.7 | 175.861.5 | 210.639.0 | 274.354.1 | |
| NGC 185 | 147.6 | 57.5 | 24.6 | 60.235.4 | 33.357.0 | 180.152.1 | 15.943.8 | 192.147.6 | 192.844.5 | |
3.3 Escape Velocity
Since satellite galaxies act as tracers of their host galaxy’s dark matter halo, measurements of their 3-d positions and velocities are powerful tools for constraining the total mass of their hosts. Under the general assumption that a satellite galaxy is bound to its host, the instantaneous total velocity must be smaller than the escape velocity , where is the distance from the center of host galaxy to the satellite, and is the gravitational potential of the halo. Therefore, the escape velocity at the distance of a given satellite provides a lower limit for the total host galaxy mass required to keep the satellite bound. Here, we use the properties of NGC 147 and NGC 185, two satellites at relatively large galactic radii, to place constraints on the virial mass of M31.
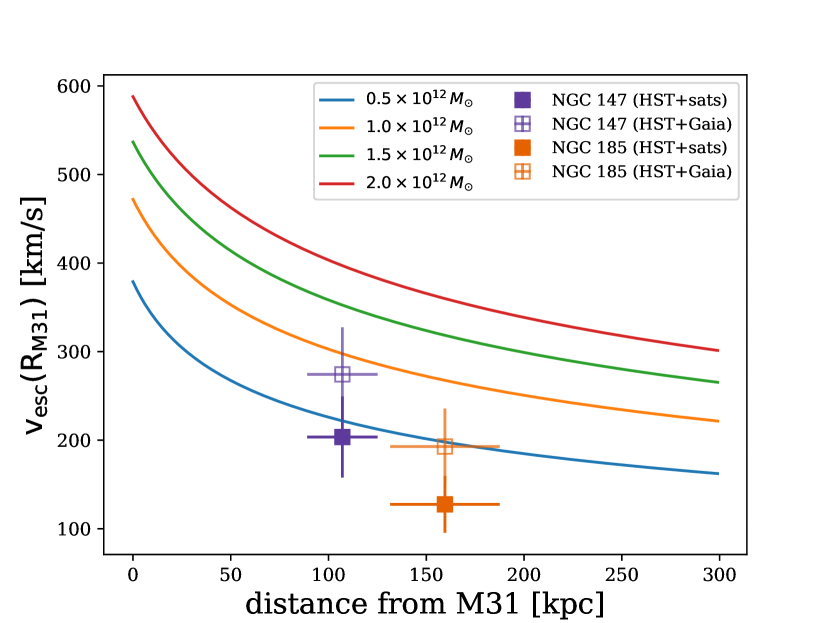
In Figure 4, we compare the observed total velocities of NGC 147 and NGC 185 taken from Table 3 to the escape velocities as a function of M31-centric distance for different cases of M31 virial masses ranging from to . The escape velocity curves were calculated assuming an NFW profile for M31’s halo and a concentration parameter calculated using Eq. 12 from Patel et al. (2017a). Square points indicate the present location of NGC 147 (purple) and NGC 185 (orange) and their values computed using the HST+sats M31 (filled squares) and HST+Gaia M31 (open squares). Figure 4 implies that both satellites are bound to M31 as they only require a minimal M31 virial mass of for . As more PMs become available for additional M31 satellites spanning the full virial extent of M31’s halo, it will be possible to reconstruct M31’s mass profile and derive more robust limits for M31’s virial mass.
4 The Orbital Histories of NGC 147 and NGC 185
4.1 Orbit Integrations
To study the past orbital histories of NGC 147 and NGC 185, we numerically integrated their orbits backward in time using the current observed positions and velocities with respect to M31 as listed in Table 3. The orbital integration scheme follows the methodology introduced in Patel et al. (2017a).
In short, M31’s potential is modeled as a static, axisymmetric, three-component model consisting of a stellar bulge, disk, and a dark matter halo. M31’s position is not held fixed, thus it can move in response to the gravitational influence of the satellites. We consider two mass models for M31: a low mass M31 with a virial mass of and virial radius of 299 kpc, and a high mass M31 with and a virial radius of 329 kpc. The bulge, disk, and halo parameters are adopted from Table 2 of Patel et al. (2017a) for each mass model. The Chandrasekhar (1943) formula is adopted to account for the dynamical friction exerted on the satellites as they pass through the halo of M31.
Each satellite is modeled as a sphere following a Plummer density profile with a halo mass of . This halo mass is derived from the Moster et al. (2013) abundance matching relation using stellar masses adopted in Garrison-Kimmel et al. (2019). To determine the Plummer scale radius of each satellite, we adopt the measured, effective half-light radii and dynamical mass estimates reported in Geha et al. (2010). We then find the scale radius where the Plummer mass enclosed at that distance matches the dynamical mass (i.e., the mass within the effective, half-light radius). This process yields Plummer scale radii of 1.5 kpc (NGC 147) and 0.9 kpc (NGC 185). Each satellite exerts forces on both M31 and the other satellite, thus these orbits consider the full 3-body encounter between M31, NGC 147, and NGC 185.
Orbits were integrated backwards in time for a duration of 10 Gyr. Note that orbital results at times greater than 6 Gyr ago should be taken with caution since these models do not account for mass loss or growth (see Patel et al., 2017a; Patel, et al., 2020, for further justification). Furthermore, orbital uncertainties increase moving backwards in time (see Figure 7) and we have not accounted for any perturbations to the orbits of NGC 147 and NGC 185 owing to the gravitational influences of other massive M31 satellites, such as NGC 205, M32, or M33. To propagate the observed uncertainties, we randomly draw 2,000 samples of positions () and velocities () to use as initial conditions for each satellite. In total, we integrate 8,000 total orbits to account for all four combinations of M31 virial mass and tangential velocity. These results are used to report the standard deviation of the distribution in each orbital parameter and are listed in Table 4.
| aaFraction of orbits that made peri-/apo-centric passage in the past 10 Gyr. | bbLookback time of the most recent peri-/apo-centric passage. | ccM31-centric distance at the most recent peri-/apo-centric passage. | aaFraction of orbits that made peri-/apo-centric passage in the past 10 Gyr. | bbLookback time of the most recent peri-/apo-centric passage. | ccM31-centric distance at the most recent peri-/apo-centric passage. | ||
|---|---|---|---|---|---|---|---|
| Galaxy | () | (%) | (Gyr) | (kpc) | (%) | (Gyr) | (kpc) |
| HST+sats M31 | |||||||
| NGC 147 | |||||||
| NGC 185 | |||||||
| HST+Gaia M31 | |||||||
| NGC 147 | |||||||
| NGC 185 | |||||||
Note. — The orbital parameters listed here are for the representative cases shown in Figures 5 and 6. For uncertainties of the orbital parameters, we quoted percentiles around the median of the distributions (see Appendix B for details). The parameters with missing data are for cases where the pericentric or apocentric passage happened more than 6 Gyr ago, or will happen in the future (negative Lookback time).
4.2 Orbital Analysis
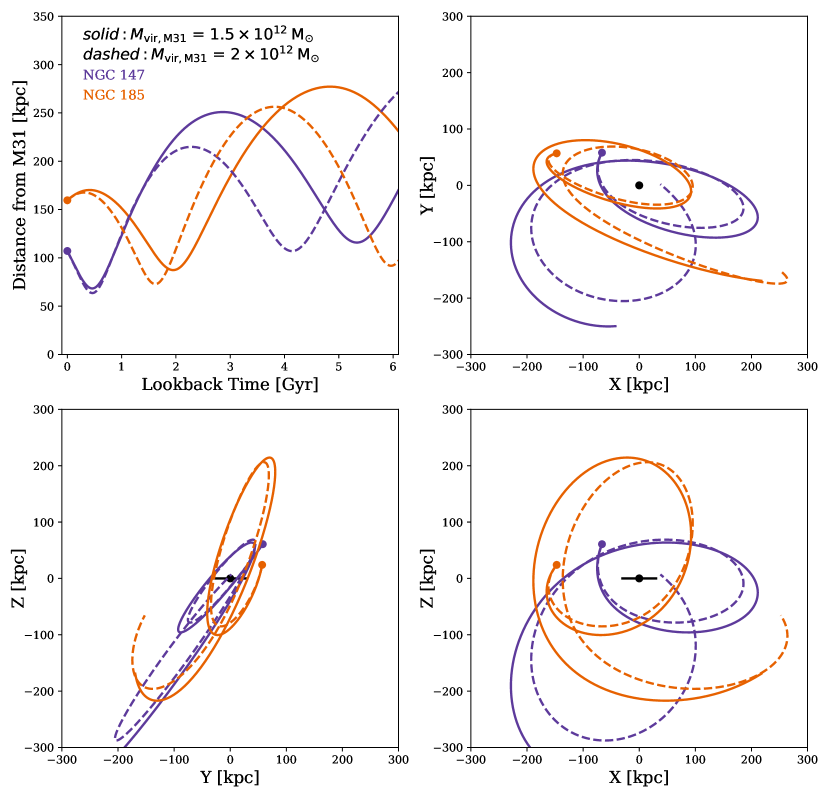
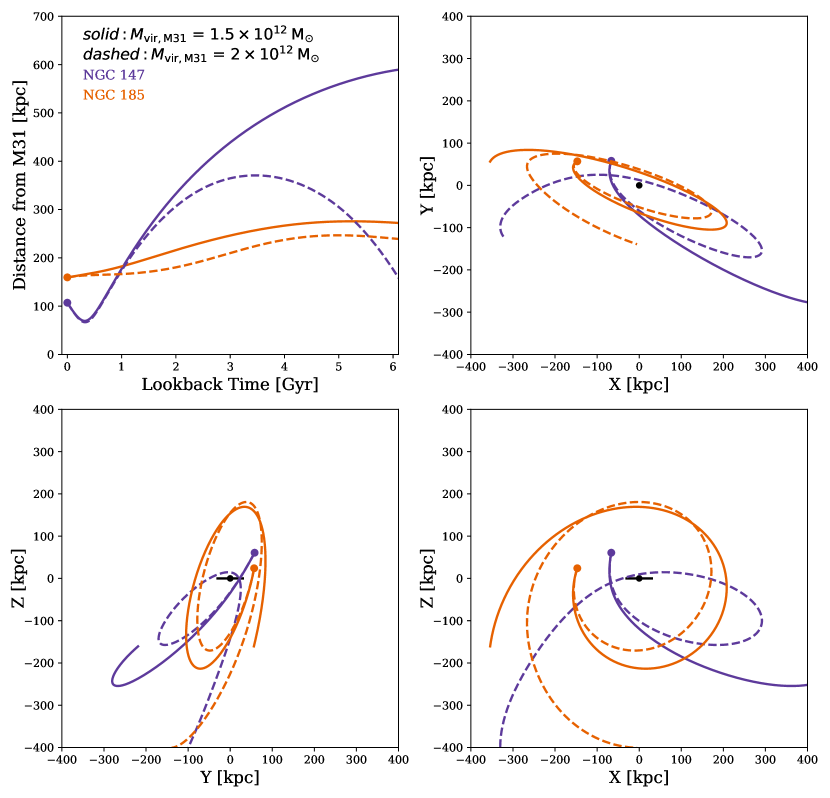
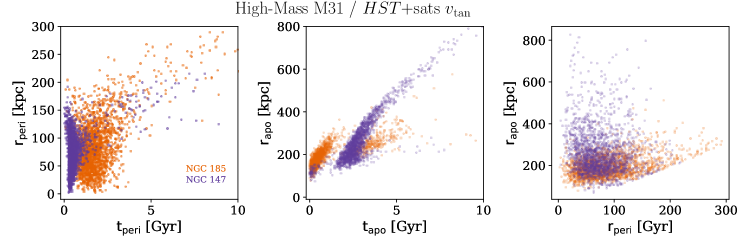
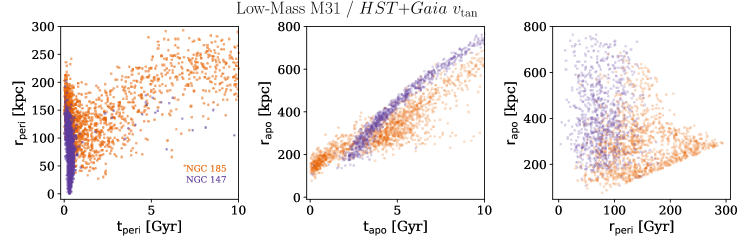
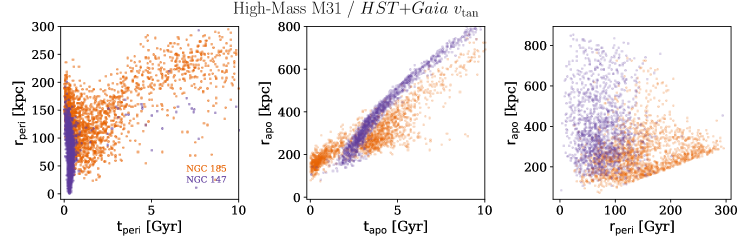
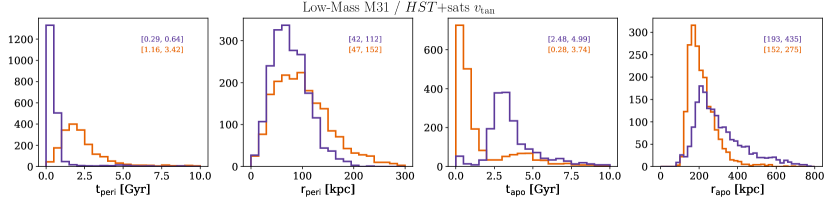
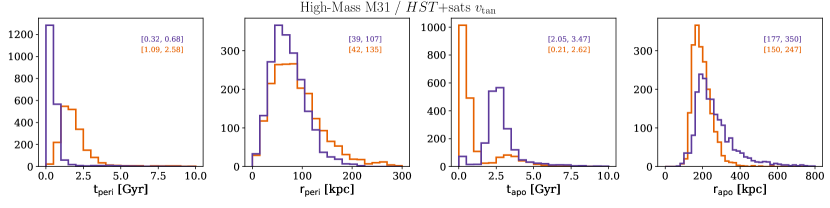
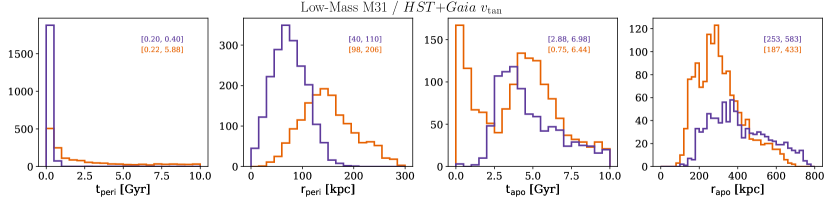
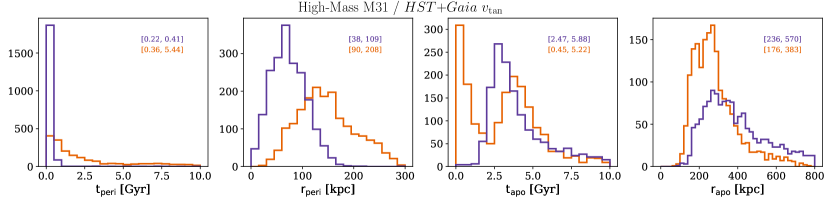
The direct orbits (orbits integrated using observed parameters listed in Table 3) of the two satellites are shown in Figures 5 and 6. These orbits do not account for the measurement error on observed parameters, such as PM, , and distance. Table 4 lists the peri- and apo-centric parameters resulting from the direct orbits. We propagated the uncertainties in a Monte Carlo fashion as described in Section 4.1, and the correlation between these parameters and distributions of orbital parameters are presented in Appendices A and B, respectively. In Table 4, we quoted the percentiles around the median of the distributions (which corresponds to the or 68.2% confidence intervals) as the uncertainties.
Overall, we find that the orbital parameters are strongly dependent on the velocity zero-point used for our orbital calculations. In particular, adopting the HST+sats M31 as the velocity zero point results in tighter orbits than adopting the HST+Gaia M31 for both dwarf galaxies: i.e., the former leads to at least one full orbit around M31 (up to two full orbits for the higher-mass case) within 6 Gyr, while the latter barely results in one full orbit.
There are, however, important similarities found among the four different cases shown in Figure 5 and 6. First, as expected from the signs of radial velocities in Table 3, we find for all cases that NGC 147 is currently moving away from M31, while NGC 185 is on an approaching orbit. We also find that the pericentric distance and time of NGC 147 is very robust with small systematic differences regardless of which M31 mass is used, or which M31 was adopted: i.e., NGC 147 had its pericentric approach to M31 0.3–0.5 Gyr ago at an M31-centric distance of 64–70 kpc on average. The pericentric time and distance for NGC 185, on the other hand, are not as well constrained, although we find that they are at significantly earlier times (1.5-2 Gyr ago for HST+sats M31 and Gyr ago for the HST+Gaia M31 ). The apocenters, in contrast, are less well constrained for NGC 147 than for NGC 185, largely due to the different orbital phase at which we observe them. In the former the expected apocenter ranges from 215 to beyond 300 kpc depending on the choice of model, with the largest values coming for the reference frame and halo mass choice where the satellite is only weakly bound to M31. In the latter the apocenter ranges only from 168–276 kpc.
Interestingly, the pericentric times of NGC 147 and NGC 185 correlate qualitatively very well with the presence and absence of tidal tails seen around the galaxies, respectively. In particular, the prominent tidal tails emanating from NGC 147 are likely still observable because of the recent (0.3–0.5 Gyr ago, but see below) pericentric approach to M31, whereas NGC 185 may have possessed tidal tails comparable to those of NGC 147 in the past (with the HST+sats M31 only), but have since dispersed and become significantly fainter in surface brightness. Future dynamical simulations of the two satellites using our PM results will help to refine these speculations and provide a more consistent physical picture of the tidal tails.
NGC 147 and NGC 185 are known to have contrasting differences regarding their gas (Young & Lo, 1997; Marleau et al., 2010) and stellar contents (Geha et al., 2015). NGC 147 is devoid of gas, and in addition to the ancient stars ( Gyr old) that make up % of its stellar population, more than half of its stars were formed 5–7 Gyr ago. NGC 185 on the other hand, contains some gas and dust with the bulk of the stars being formed 8–12.5 Gyr ago. While the characteristics of our orbits are too sensitive to observational and modeling uncertainties to draw firm conclusions about their relationship to the stellar population (cf. Figures 5 and 6), NGC 147’s orbit is likely more radial and higher-energy than that of NGC 185, with both a larger apocenter and a smaller pericenter. This suggests that NGC 185 may have experienced a longer, more gentle period of evolution within M31’s halo, with its stellar population quenched more by slow starvation than ram pressure stripping. By contrast, the large population of intermediate-age stars in NGC 147 may have been induced by tidal forces owing to M31 at an earlier pericentric passage when it still retained a large amount of gas. Viewed more broadly, our results show that the two galaxies are likely to be orbiting independently, and therefore it is not a surprise that their gas properties and SFHs are significantly different.
4.3 Are NGC 147 and NGC 185 a Bound Pair?
Our orbital results also provide insights into the possibility of past interactions between the two dwarfs. This is important in the context of previous claims that NGC 147 and NGC 185 may be ‘binary galaxies’, i.e., born as a group, and bound to each other while orbiting around M31 (van den Bergh, 1998; Geha et al., 2010). Geha et al. (2010) calculated the energy criterion , which when implies that the potential energy between the two satellites is greater than their kinetic energy. In other words, when the satellites have , they are strongly interacting with one another. In Geha et al. (2010), a value of was calculated using the line-of-sight distance between the two satellites, the difference in their , and a system mass comprised of the sum of their dynamical masses. Here, we use the difference in their 3-d position vectors (89 kpc), their total relative velocities (), and the sum of their halo masses ( to find that , where these values represent the median and the extents of the 25th and 75th quartiles of the resulting values using all 2,000 MC drawings, accounting for measurement errors in all relevant observational parameters. We conclude that NGC 147 and NGC 185 are not strongly interacting with one another at present. A combined mass of at least , about twice the combined mass considered here, is required to reach using the current separation and relative velocity for NGC 147 and NGC 185.
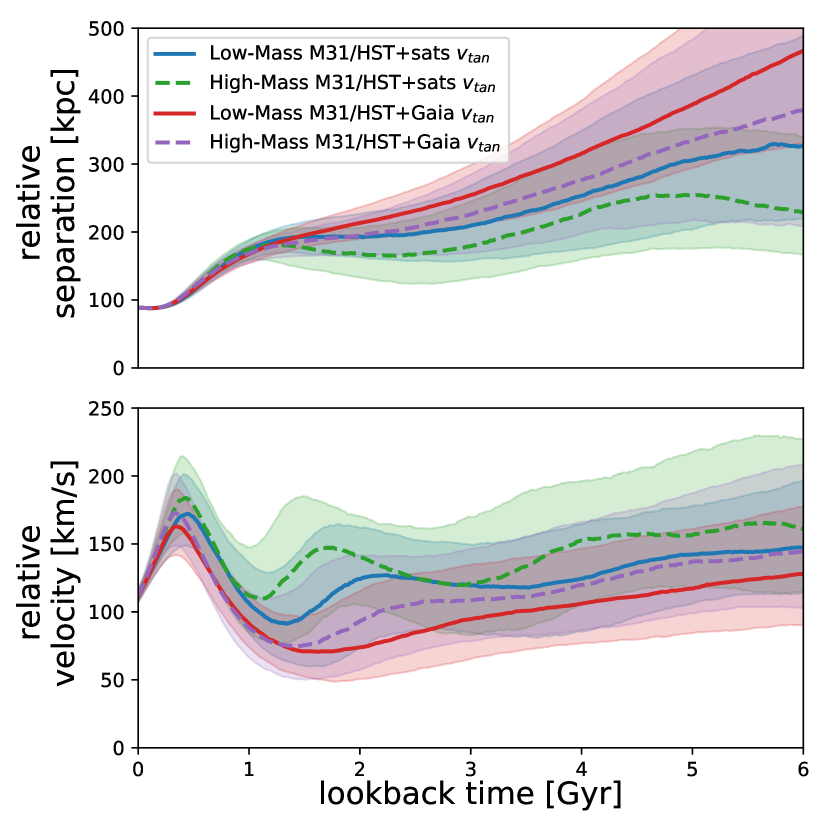
With measured PMs, we can also evaluate whether the satellites were a bound pair in the past. Figure 7 shows the median distance and total relative velocity of NGC 147 and NGC 185 over the last 6 Gyr. These quantities were calculated by taking each set of 2,000 orbits per M31 mass and tangential velocity value, computing the relative orbits of NGC 147 and NGC 185, and then finding the median and quartiles (shaded regions) for the separation and velocity. As their minimum separation of kpc is only achieved in the last 0.5 Gyr, we conclude that the satellites were not a bound pair over the last 6 Gyr and therefore the tidal tails around NGC 147 are likely a result of NGC 147’s recent pericentric passage around M31 at 0.3–0.5 Gyr ago. Furthermore, the satellites likely entered the halo of M31 individually rather than during a group infall, in contrast to the Magellanic Clouds and their associated satellites (e.g. Kallivayalil et al., 2018; Erkal et al., 2020; Patel, et al., 2020).
Our analysis above apply to the typical behavior of our orbit models. A small fraction of our orbits, however, do allow approaches that are much closer than the present-day distances of the two galaxies. For instance, over our combinations of mass and velocity zero point, roughly 2% of the orbits allow approaches closer than , a distance at which one could contemplate the two galaxies being bound. In most cases these close approaches occur on previous encounters, into the past. Thus we do not entirely rule out that the two galaxies were previously bound, though for the combinations of observational uncertainties, M31 mass, and M31 adopted in this analysis we find it highly unlikely.
5 The Great Plane of Andromeda
Both NGC 147 and NGC 185 are considered to be members of the GPoA (Ibata et al., 2013; Conn et al., 2013). In Section 3.1, we have already shown that the 2-d motion of NGC 147 is consistent with evidencing rotation within the GPoA, while NGC 185’s direction of motion is somewhat tilted about it. Here, we use the 3-d motions of NGC 147 and NGC 185 based on our PM measurements to provide clues to whether the satellites are members of the GPoA both today and as a function of time. We also provide useful arguments on whether the GPoA is a long-lived dynamical structure or not using our PM measurements.
5.1 Orbital Poles of M31 Satellites Compared to the GPoA Normal
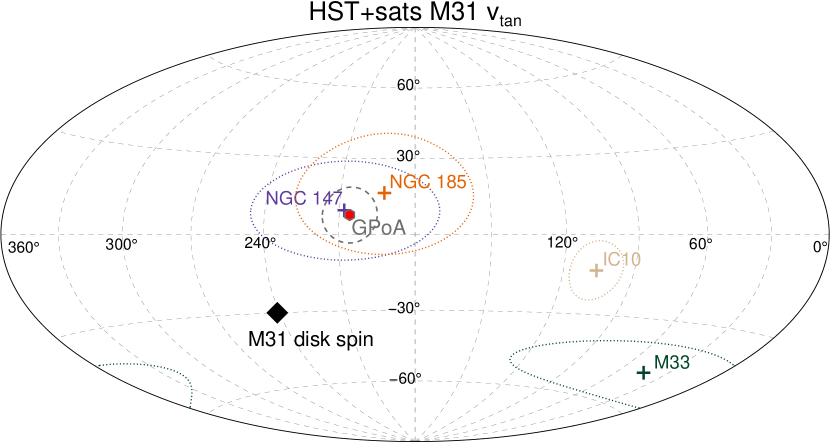
In Figure 8, we plot the present day orbital poles of all M31 satellites with measured PMs, i.e., M33, IC 10, NGC 147, and NGC 185. As expected from Figure 3, the orbital pole of NGC 147 is found to be remarkably close to the normal of the GPoA. This provides support that NGC 147 is rotating within the GPoA. The orbital pole of NGC 185 is offset by ° in angle from the GPoA normal, but it is still consistent with being dynamically associated with the GPoA within uncertainty. Improved PM measurements for NGC 185 (and for M31) are necessary for conclusively judging the association.
In contrast to NGC 147 and NGC 185, the two other satellites shown in Figure 8, M33 and IC 10, are significantly offset from the GPoA. M33 is not part of the GPoA originally identified by Ibata et al. (2013) and Conn et al. (2013), so it is unsurprising that its orbital pole is so far removed from that of the GPoA. IC 10, however, spatially lies within the GPoA though it too was not originally identified as a coplanar satellite based on its . IC10’s large tangential motion with respect to the GPoA indeed indicates that it is most likely not dynamically associated with the GPoA.
With our 3-d orbits, we can also assess whether the orbital poles of NGC 147 and NGC 185 deviate from their present-day values to determine if they have been long-term GPoA members, assuming that the GPoA is not a transient structure (see Section 5.2). To do so, we calculate defined as the angle between the angular momentum vectors of NGC 147/185 (computed from the positions and velocities of each time step from the orbits reported in Section 4) and the M31 disk plane for both M31 zero points. We find only small variations of as the satellites orbit around M31. For NGC 147 and NGC 185, respectively, we find and using the HST+sats M31 . For the HST+Gaia M31 , and for NGC 147 and NGC 185, respectively. All calculations assume a low-mass M31, but results are consistent for a high-mass M31.
The GPoA is tilted relative to the normal of M31’s disk with an uncertainty of approximately 444This uncertainty represents the rms scatter in the angular offsets out of the GPoA plane for the 19 satellites that define the GPoA in Pawlowski et al. (2013, see Table 4). The angular offset is defined as the arctangent of (perpendicular offset from GPoA / radial distance from M31).. For both satellites, the HST+Gaia M31 results in larger offsets from the GPoA. The resulting for NGC 147 suggests that its motion is generally consistent with the orientation of the GPoA to within and either M31 zero point. NGC 185 is consistent with the GPoA and its uncertainty for the HST+sats M31 zero point, however for the HST+Gaia zero point, NGC 185 can be off from the GPoA by up to over the last 6 Gyr when considering uncertainties in the observed parameters. Thus, it is possible that NGC 185 is not dynamically associated to the GPoA either now or in the past and improved PMs for both M31 and the satellites are necessary to conclusively determine if NGC 185 is associated to the GPoA. These results also reinforce that the two galaxies are not strongly interacting, as their orbits do not indicate binary motion about a common center of mass.
Since our orbital calculations assume a spherical halo, it is expected that the satellites orbit approximately in a plane with a constant angle with respect to M31’s disk. As the satellites only complete 1–1.5 orbits around M31 in this time frame, it is unsurprising that these angles do not significantly change with time. Additionally, these calculations do not include the effects of other dynamical perturbers that may have influenced the past orbits of NGC 147 and NGC 185, such as M33, M32, or the progenitor of the Giant Southern Stream.
5.2 Testing the GPoA as a Long-lived Structure
The GPoA and the corresponding satellite planes observed around the MW have given rise to an extensive literature assessing their consistency with current cosmological ideas (see Pawlowski et al., 2019, and references therein). Different authors find varying levels of consistency with cosmological simulations depending on simulation and analysis methods, though in general there is a significant level of tension. Some studies find better agreement by means of baryonic effects not implemented in most simulations (e.g., Sawala et al., 2016), while others argue that the planes are tidal debris structures forming in models outside the CDM paradigm (e.g., Hammer et al., 2013). In most studies, however, the simulated planes are not highly coherent, and therefore claimed as chance alignments rather than long-lived structures (Bahl & Baumgardt, 2014; Buck et al., 2015; Gillet et al., 2015; Santos-Santos et al., 2020). Here we simplify the range of models into two extreme possibilities: entirely chance alignments, or long-lived coherently rotating structures. In the former case, one would expect the random motions normal to the plane to be of order the overall satellite velocity dispersion of (Tollerud et al., 2012; Gilbert et al., 2018). In the latter, these motions should be . Fernando et al. (2017) find the velocity dispersion in a long-lived plane structure should be , and given the size of our observational errors we simply take it to be zero.
The small out-of-plane velocities we have found are, of course, consistent with both models, since these two satellites could just happen by chance to be among the few moving within the plane. We can instead ask how much the new PM results evidence strengthens the case for the GPoA as a long-lived structure. From a Bayesian point of view, this requires evaluating the likelihood function of the new observations in each model (here called “transient” and “stable” models as shorthands).
We use the fact that the plane is viewed almost edge-on. Scaling PM to distance, the observable quantity is the M31-motion-corrected tangential velocity in the direction of the GPoA plane normal vector, . We assume Gaussian distributions in both observational errors and physical velocity. For each model the mean of ’s distribution is zero. For the stable model the likelihood function is then a Gaussian distribution , where the terms in the variance come from the proper motion errors in our observations and in the reference frame. In the transient model the likelihood function is , where the extra term in the variance comes from the random physical velocities.
For NGC 147, the velocity components in W and N directions, corrected for the M31 system motion using the HST+sats M31 , are 38 and 161 . This yields an observed velocity of out of the plane. The observed PM uncertainty of 49 combined with the reference frame uncertainty of 30 yields a total expected dispersion of 57 . Including the expected satellite velocity dispersion raises the expected observed dispersion in the transient model to 115 , twice as high. Evaluating the likelihood functions above gives a likelihood ratio of 2.0; i.e., the stable model yields twice the likelihood of the transient model.
For the case of NGC 185, velocity components in M31’s frame in the W and N directions are 49 and 52 , which yields an observed velocity of out of the plane. The observed PM uncertainty of 43 combined with the reference frame uncertainty yields a total expected dispersion of 52 . The total expected dispersion in the transient model is 113 , and the resulting likelihood ratio is 1.8.
Combining the factors for each galaxy gives a total likelihood ratio of 3.5. Therefore, regardless of one’s assessment on the stability (or even existence) of the plane of satellites in M31, our PM observations strengthen the evidence for the stable model as opposed to the transient model by nearly a factor of 4. This is in addition to all prior evidence for the existence of the plane, based on the sky positions and of the satellites.
Adopting the HST+Gaia zero-point for M31 shifts the out-of-plane velocities of both galaxies somewhat. For NGC 147 increases to 43 , while for NGC 147 it increases to 78 . As a result, the likelihood ratios change from 2.0 to 1.6 for NGC 147 and from 1.8 to 0.9 for NGC 185. Combining the two results reduces the overall likelihood ratio from 3.5 to 1.4. In other words, the new PM observations with this reference frame choice are still positive evidence for the stable model, but not as strong as with HST+sats. We anticipate that the uncertainty in M31’s PM will decrease in the near future, and at that time it will be worth revisiting the various calculations we have made that are sensitive to M31’s reference frame.
6 Conclusions
We used HST ACS/WFC and WFC3/UVIS images to measure the first PMs of NGC 147 and NGC 185, two dwarf satellites of M31. By comparing the average motions from a few thousands to tens of thousands stars associated with the dwarf galaxies against hundreds of compact background galaxies in the fields, we find the PMs to be: and .
We derive space velocities of NGC 147 and NGC 185 in the M31-centric frame. For the rest-frame M31-centric 3-d velocities, we use two different measurements for M31, the average of HST measurement and satellite kinematics by van der Marel et al. (2012), and the average of HST and Gaia DR2 measurements by van der Marel et al. (2019). Using escape velocities based on the measured 3-d velocities, we find that M31 must have a minimal virial mass of for both NGC 147 and NGC 185 to be bound to M31’s halo simultaneously.
We used the PM results to explore the orbital histories of NGC 147 and NGC 185 over the past 6 Gyr. These orbital histories account for the full 3-body encounter between M31+NGC 147+NGC 185 and explore two M31 mass combinations, as well as two M31 zero points. We conclude that NGC 147’s tidal tails are likely the remnants of a recent pericentric passage around M31 at a distance of – kpc just – Gyr ago. The direction of motion for NGC 147 is also spatially well aligned with the tidal tails. The lack of tidal tails around NGC 185 is consistent with the orbital results, which indicate that NGC 185 either passed around M31 at earlier times (1.5–2 Gyr ago) and that these tidal tails are no longer visible today or that NGC 185 passed nearby M31 at very early times ( 6 Gyr ago) and at larger distances ( kpc) such that no tidal features ever existed. Future -body models will help confirming (or refuting) such claims. The disparities in gas content and SFHs found for NGC 147 and NGC 185 can be attributed to the fact that the two galaxies have different orbital characteristics.
The orbital histories of NGC 147 and NGC 185 also allow us to revisit the claim that these two satellites are a bound pair. Based on the orbital histories calculated in this work, we find that the minimum separation between the two galaxies was only achieved in the last 0.5 Gyr at a distance of 100 kpc, thus the satellites show no evidence for a strong interaction in the past such that they might have been bound to each other. This also implies the satellites may not have been born in similar environments, despite their similarities, and furthermore that they did not enter the M31’s halo as a pair.
Finally, our results provide a new test of the nature of the GPoA. For long-term association of a satellite with this plane, its orbital angular momentum must be perpendicular to the plane (i.e., orbital motion within the plane). Our PM measurements yield the first determination of the 3-d angular momentum vector of any of the M31 satellites originally identified as GPoA members. The orbital pole of NGC 147 agrees within the normal direction of the GPoA. The same is true for NGC 185 when using the HST+Gaia M31 zero point, but with larger uncertainties. While additional samples and improved PM uncertainties are required for more stringent tests, our results significantly strengthen the hypothesis that the GPoA is a dynamically coherent entity.
In a separate future work, we will use the orbital histories of NGC 147 and NGC 185 derived from this work to provide insight into the formation and evolution histories of dE satellites using dark matter-only cosmological simulations.
Whereas the increased time baselines for subsequent Gaia data releases will undoubtedly yield enhanced understanding about the formation and evolution of the MW system, PM measurements at the distance of M31 will require deep imaging using space telescopes like HST, JWST, and WFIRST. Fortunately, there are a number of existing and ongoing (GO-15902; PI: D. R. Weisz) HST programs targeting virtually all known M31 satellites to measure their SFHs. These can be used as first-epoch data for PM measurements with follow-up by additional HST (or even JWST/WFIRST) observations. Additionally, the refined M31 PM measurements from the ongoing HST program GO-15658 (PI: S. T. Sohn) will provide improved zero points for the satellites’ tangential velocities. In this regard, prospects of M31 satellite dynamics studies are very bright.
Appendix A Correlations between Orbital Parameters
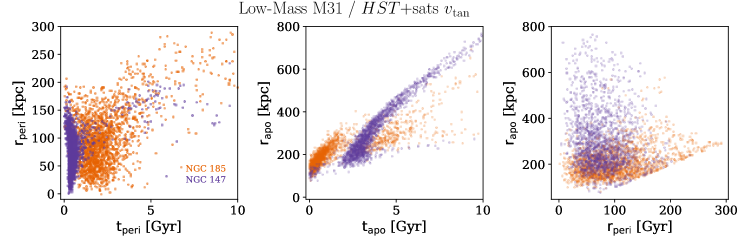
In Figure 9, we show the correlations of peri- and apo-centric parameters from the samplings drawn from our propagation of observed uncertainties.
Appendix B Uncertainties in Orbital Parameters
In Figure 10, we show the distributions of peri-/apo-centric times and distances resulting from propagating the observed parameters in a Monte Carlo fashion.
References
- Anderson (2006) Anderson, J., 2006, in The 2005 HST Calibration Workshop, ed., A. M. Koekemoer, P. Goudfrooij, & L. Dressel (Baltimore, MD: STScI), 11
- Anderson & King (2006) Anderson, J., & King, I. R. 2006, ACS/ISR 2006-01, PSFs, Photometry, and Astrometry for the ACS/WFC (Baltimore, MD: STScI)
- Anderson & Bedin (2010) Anderson, J. & Bedin, L. R. 2010, PASP, 122, 1035
- Arias et al. (2016) Arias, V., Guglielmo, M., Fernando, N., et al. 2016, MNRAS, 456, 1654
- Bahl & Baumgardt (2014) Bahl,H., & Baumgardt, H. 2014, MNRAS, 438, 2916
- Bellini et al. (2011) Bellini, A., Anderson, J., & Bedin, L. R. 2011, PASP, 123, 622
- Besla et al. (2007) Besla, G., Kallivayalil, K., Hernquist, L., et al. 2007, ApJ, 668, 949
- Brunthaler et al. (2005) Brunthaler, A., Reid, M. J., Falcke, H., Greenhill, L. J., & Henkel, C. 2005, Science, 307, 1440
- Brunthaler et al. (2007) Brunthaler, A., Reid, M. J., Falcke, H., Henkel, C., & Menten, K. M. 2007, A&A, 462, 101
- Buck et al. (2015) Buck, T., Macciò, A. V., & Dutton, A. A. 2015, ApJ, 809, 49
- Callingham et al. (2018) Callingham, T. M., Cautun, M., Deason, A. J., et al. 2018, MNRAS, 484, 5453
- Chandrasekhar (1943) Chandrasekhar, S. 1943, ApJ, 97, 255
- Conn et al. (2012) Conn, A. R., Ibata, R. A., Lewis, G. F., et al. 2012, ApJ, 758, 11
- Conn et al. (2013) Conn, A. R., Lewis, G. F., Ibata, R. A., et al. 2013, ApJ, 766, 120
- Crnojević et al. (2014) Crnojević, D., Ferguson, A. M. N., Irwin, M. J., et al. 2014, MNRAS, 445, 3862
- Erkal et al. (2020) Erkal, D., & Belokurov, V. 2020, MNRAS, 495, 2554
- Fernando et al. (2017) Fernando, N., Arias, V., Guglielmo, M., et al. 2017, MNRAS, 465, 641
- Fritz et al. (2020) Fritz, T. K., Di Cinto, A., Battaglia, G., Brook, C., & Taibi, S. 2020, MNRAS, in press (arXiv:2001.02651)
- Garrison-Kimmel et al. (2019) Garrison-Kimmel, S., Hopkins, P. F., Wetzel, A., et al. 2019, MNRAS, 487, 1380
- Geha et al. (2010) Geha, M., van der Marel, R. P., Guhathakurta, P., et al. 2010, ApJ, 711, 361
- Geha et al. (2015) Geha, M., Weisz, D., Grocholski, A., et al. 2015, ApJ, 811, 114
- Gilbert et al. (2018) Gilbert, K. M., Tollerud, E., Beaton, R. L., et al. 2018, ApJ, 852, 128
- Gillet et al. (2015) Gillet, C., Ocvirk, P., Aubert, D., et al. 2015, ApJ, 800, 34
- Hammer et al. (2013) Hammer, F., Yang, Y., Fouquet, S., et al. 2013, MNRAS, 431, 3543
- Hodkinson & Scholtz (2019) Hodkinson, B., & Scholtz, J. 2019, MNRAS, 488, 3231
- Huchra et al. (1999) Huchra, J. P., Vogeley, M. S., & Geller, M. J. 1999, ApJS, 121, 287
- Ibata et al. (2013) Ibata, R. A., Lewis, G. F., Conn, A. R., et al. 2013, Nature, 493, 62
- Ibata et al. (2014) Ibata, R. A., Ibata, N. G., Lewis, G. F., et al. 2014, ApJ, 784, 6
- Kallivayalil et al. (2006) Kallivayalil, N., van der Marel, R. P., Alcok, C., et al. 2006, ApJ, 638, 772
- Kallivayalil et al. (2013) Kallivayalil, N., van der Marel, R. P., Besla, G., Anderson, J., & Alcock, C. 2013, ApJ, 764, 161
- Kallivayalil et al. (2018) Kallivayalil, N., Sales, L. V., Zivick, P., et al. 2018, ApJ, 867, 19
- Marleau et al. (2010) Marleau, F. R., Noriega-Crespo, A., & Misselt, K. A. 2010, ApJ, 713, 992
- McConnachie (2012) McConnachie, A. W. 2012, AJ, 144, 4
- McMillan (2011) McMillan, P. J. 2011, MNRAS, 414, 2446
- McQuinn et al. (2017) McQuinn, K. B. W., Bother, M. L., Mitchell, M. B., et al. 2017, ApJ, 834, 78
- Metz et al. (2007) Metz, M., Kroupa, P., & Jerjen, H. 2007, MNRAS, 374, 1125
- Moster et al. (2013) Moster B. P., Naab T., White S. D. M., 2013, MNRAS, 428, 3121
- Patel et al. (2017a) Patel, E., Besla, G., & Sohn, S. T. 2017, MNRAS, 464, 3825
- Patel et al. (2018) Patel, E., Besla, G., Mandel, K., & Sohn, S. T. 2018, ApJ, 857,78
- Patel, et al. (2020) Patel E., Kallivayalil, N. K., Garavito-Camargo, N. et al. 2020, ApJ, 893, 121
- Pawlowski et al. (2013) Pawlowski, M. S., Kroupa, P., & Jerjen, H. 2013, MNRAS, 435, 1928
- Pawlowski et al. (2019) Pawlowski, M. S., Bullock, J. S., Kelley, T., & Famaey, B. 2019, ApJ, 875, 105
- Pawlowski & Kroupa (2020) Pawlowski, M. S., & Kroupa, P. 2020, MNRAS, 491, 3042
- Salomon et al. (2016) Salomon, J.-B., Ibata, R. A., Famaey, B., Martin, N. F., & Lewis, G. F. 2016, MNRAS, 456, 4432
- Santos-Santos et al. (2020) Santos-Santos, I., Domínguez-Tenreiro, R. Artal, H., et al. 2020, ApJ, in press (arXiv:2004.11585)
- Sawala et al. (2016) Sawala, T., Frenk, C. S., Fattahi, A., et al. 2016, MNRAS, 457, 1931
- Schönrich, Binney, & Dehnen (2010) Schönrich, R., Binney, J., & Dehnen, W. 2010, MNRAS, 403, 1829
- Skillman et al. (2017) Skillman, E. D., Monelli, M., Weisz, D. R., et al. 2017, ApJ, 837, 102
- Slipher (1913) Slipher, V. 1913, Lowell Observatory Bulletin, vol. 1, pp.56–57
- Sohn et al. (2012) Sohn, S. T., Anderson, J., & van der Marel, R. P. 2012, ApJ, 753, 7
- Sohn et al. (2013) Sohn, S. T., Besla, G., van der Marel, R. P., et al. 2013, ApJ, 768, 139
- Sohn et al. (2017) Sohn, S. T., Patel, E., Besla, G., et al. 2017, ApJ, 849, 93
- Tollerud et al. (2012) Tollerud, E. J., Beaton, R. L., Geha, M. C., et al. 2012, ApJ, 752, 45
- van den Bergh (1998) van den Bergh, S. 1998, AJ, 116, 1688
- van der Marel & Guhathakurta (2008) van der Marel, R. P., & Guhathakurta, P. 2008, ApJ, 678, 187
- van der Marel et al. (2012) van der Marel, R. P., Fardal, M., Besla, G., et al. 2012, ApJ, 753, 8
- van der Marel et al. (2019) van der Marel, R. P., Fardal, M., Sohn, S. T., et al. 2019, ApJ, 872, 24
- Weisz et al. (2014) Weisz, D. R., Dolphin, A. E., Skillman, E. D., et al. 2014, ApJ, 789, 147
- Weisz et al. (2019) Weisz, D. R., Martin, N. F., Dolphin, A. E., et al. 2019, ApJ, 885, 8
- Young & Lo (1997) Young, L. M., & Lo, K. Y. 1997, ApJ, 476, 127