Thermal conductivity of the quasi-1D materials TaSe3 and ZrTe3
Abstract
The high breakdown current densities and resilience to scaling of the metallic transition metal trichalcogenides TaSe3 and ZrTe3 make them of interest for possible interconnect applications, and it motivates this paper of their thermal conductivities and phonon properties. These crystals consist of planes of strongly bonded one-dimensional chains more weakly bonded to neighboring chains. Phonon dispersions and the thermal conductivity tensors are calculated using density functional theory combined with an iterative solution of the phonon Boltzmann transport equation. The phonon velocities and the thermal conductivities of TaSe3 are considerably more anisotropic than those of ZrTe3. The maximum longitudinal-acoustic velocity in ZrTe3 occurs in the cross-chain direction, and this is consistent with the strong cross-chain bonding that gives rise to large Fermi velocities in that direction. The thermal conductivities are similar to those of other metallic two-dimensional transition metal dichalcogenides. At room temperature, a significant portion of the heat is carried by the optical modes. In the low frequency range, the phonon lifetimes and mean free paths in TaSe3 are considerably shorter than those in ZrTe3. The shorter lifetimes in TaSe3 are consistent with the presence of lower frequency optical branches and zone-folding features in the acoustic branches that arise due to the doubling of the TaSe3 unit cell within the plane.
I Introduction
The transition metal trichalcogenides (TMTs) have a quasi-one-dimensional (quasi-1D) crystalline structure that can give rise to quasi-1D behavior of the electronic and phononic properties Bullett (1979); Srivastava and Avasthi (1992); Island et al. (2017). The lattice structures of TMTs consist of a transition metal (M) atom, contained at the center of a prism of chalcogen (X) atoms Furuseth et al. (1975). The MX3 prisms create strongly M-X covalently bonded chains arranged side-by-side via longer, weaker M-X bonds, and planarly stacked with even weaker van der Waals type X-X bonds which effectively makes these materials two-dimensional layers of quasi-1D chains Endo et al. (1981), giving them the apt name of quasi-1D materials. The crystalline anisotropy gives rise to directional anisotropy in electrical, optical, phononic, and thermal propertiesRashid and Sellmyer (1984); Jin et al. (2015); Dai and Zeng (2015); Island et al. (2016); Pant et al. (2016); Dai et al. (2016); Kong et al. (2017).
The low dimensionality of the MX3 materials makes them particularly susceptible to multiple phase transitions such as superconductivity Sambongi et al. (1977); Haen et al. (1978); Yamamoto (1978); Yamaya et al. (2012) and charge density wave (CDW) formation Grüner (1988, 1994); Monceau (2012); Pokrovskii et al. (2013). The latter has motivated extensive, prolonged research into CDW transitions Fleming et al. (1978); Bullett (1979); Itkis et al. (1990); Zybtsev et al. (2017), sliding Zettl and Grüner (1982); Hall et al. (1988), dynamics Bardeen et al. (1982); Zettl et al. (1982); Thorne et al. (1987); van der Zant et al. (2001a); Zybtsev et al. (2009), dimensional scaling Zaitsev-Zotov (2004); McCarten et al. (1992); van der Zant et al. (1999, 2001b); Slot et al. (2004); Inagaki et al. (2005); Hor et al. (2005); Zybtsev and Pokrovskii (2011) in the metallic TMTs, and their use for device applications Bha ; Adelman et al. (1995); CDW ; Mihailovic et al. (2002). The Fermi surface nesting, CDW, and their signatures in the phonon spectrum of ZrTe3 are a topic of ongoing interest Stöwe and Wagner (1998); Seshardi et al. (1998); Felser et al. (1998); Yokoya et al. (2005); Hoesch et al. (2009a, b); Hu et al. (2015); Gleason et al. (2015); Ganose et al. (2018); Hoesch et al. (2019); Yue et al. (2020). Inelastic x-ray scattering revealed a Kohn anomaly in the transverse acoustic (TA) phonon of ZrTe3 at the CDW wavevector for temperatures up to 292 K Hoesch et al. (2009a). As the temperature was reduced to and below , partial Fermi surface splitting was observed by angle-resolved photoelectron spectroscopy Yokoya et al. (2005); Hoesch et al. (2009b).
There has been a recent resurgence of interest in 1D and quasi-1D materials, in part motivated by, and evolving from, the intense interest in two-dimensional (2D) van der Waals materials. Reference Patra and Rout (2020) provides a review of the more recent work on the transition metal trichalcogenides. The direct gap semiconductor TiS3 has received much attention after it was exfoliated to few layer thicknesses and shown to have a high photo-response with a bandgap of 1.1 eV Island et al. (2014). Investigations of few layer and nanoribbon TiS3 transistors followed, and experimentally extracted mobilities were in the range of 20-70 cm2V-1s-1 Island et al. (2015); Lipatov et al. (2015); Island et al. (2016); Gilbert et al. (2019); Randle et al. (2019). BN encapsulation of 26 nm thick TiS3 resulted in two and four terminal room-temperature mobilities of 54 and 122 cm2V-1s-1, respectively Papadopoulos et al. (2019). The properties of the MX3 materials with M = Ti, Zr, Hf, and X = S, Se, Te, have been investigated with density functional theory (DFT) to determine electronic structure, bandgaps, specific heats, and elastic constants Abdulsalam and Joubert (2015). Exploiting the anisotropy inherent in TMTs has been proposed for application in next generation electronics, contacts, polarizers and photo-detectors Zhang et al. (2016); Yuan et al. (2015).
The metallic TMTs have also received renewed attention after it was discovered that the breakdown current densities of TaSe3 ( MA/cm2 where MA represents mega-amperes) and ZrTe3 ( MA/cm2) are higher than that of Cu Stolyarov et al. (2016); Geremew et al. (2018). Furthermore, in contrast to Cu wires, the resistivity of TaSe3 did not degrade as the cross-sectional dimensions were scaled down to 10 nm Empante et al. (2019). This was attributed to the single crystalline nature of the nanowires and the self-passivation of the surfaces that eliminate grain-boundary and surface roughness scattering. Because of these properties, metallic TMTs were proposed for local interconnect applications in nano-scaled electronics Stolyarov et al. (2016); Empante et al. (2019).
Since the metallic TMTs can carry record current densities and have been proposed for interconnect applications, it is necessary to also understand their thermal transport properties. A secondary motivation to explore the thermal transport properties of low-dimensional materials is their potential of exhibiting higher thermoelectric efficiency Dresselhaus et al. (1999). Recently, a high thermoelectric figure of merit was predicted for monolayer ZrSe3 resulting from a high power factor and relatively low thermal conductivity Zhou et al. (2018).
Although the electronic structure and the electronic transport properties of quasi-1D materials have been extensively studied, their phononic and thermal transport properties have received less attention. Recently, a thermal conductivity of 7 Wm-1K-1 was measured in bulk polycrystalline ZrTe3 Hooda et al. (2019). A DFT investigation of monolayer ZrSe3 found room temperature thermal conductivities parallel to the chain direction of 8 Wm-1K-1 and perpendicular to the chain direction of 3 Wm-1K-1 [Zhou et al., 2018]. A recent study of TiS3 found room temperature thermal conductivities of 5.78 Wm-1K-1 and 2.84 Wm-1K-1 along the chain and interchain directions, respectively Liu et al. (2020).
In this paper, we calculate the phonon modes of TaSe3 and ZrTe3, using DFT. We determine the anisotropic velocities of the acoustic branches along the high-symmetry directions, and we compare the frequencies of the optical modes to experimental Raman frequencies and determine the associated mode displacements. We then solve the phonon Boltzmann transport equation (PBTE) to determine the lattice thermal conductivities and to investigate the phonon lifetimes and mean free paths in these two quasi-1D materials.
II Crystallographic Structures and Properties
Because the TMTs consist of planes of 1D chains of strongly bonded trigonal MX3 prisms with each chain bonded to its neighbor chain through longer, weaker M-X bonds and each plane bonded to its neighbor plane through even weaker van der Waals type bonds, we define three different directions: chain, cross-chain (cc), and cross-plane (cp). The chain direction is parallel to the 1D chains and along the lattice vector for both crystals as shown in Fig. 1. The cross-chain direction is perpendicular to the 1D chains and within the same van der Waals plane, and the cross-plane direction is perpendicular to the van der Waals planes.
TaSe3 and ZrTe3 are metallic with monoclinic crystal structures belonging to space group P21/m. Both crystals have inversion symmetry so that the phonon modes at have either even or odd parity. The experimentally determined lattice constants of TaSe3 are Å, Å, Å, and ∘; and those of ZrTe3 are Å, Å, Å, and ∘ as shown in Fig. 1(a,b).Bjerkelund and Kjekshus (1965) The van der Waals gaps are visible, and the interchain metal-chalcogen bond is longer than the intrachain metal-chalcogen bond. The unit cell of TaSe3 contains 16 atoms, and the unit cell of ZrTe3 contains 8 atoms. The electrical conductivity along the chain direction of TaSe3 at room temperature is reported to be 1.7 105 (m)-1 [Haen et al., 1978] and it remains metallic down to liquid He temperatures Sambongi et al. (1977); Haen et al. (1978). ZrTe3 undergoes a CDW phase transition at = 63 K Seshardi et al. (1998); Nakajima et al. (1986). For that reason, we limit our thermal conductivity calculations to temperatures 100 K and above.
The structural and electronic properties of ZrTe3 have been investigated extensively both experimentally and theoretically Takahashi et al. (1984); Seshardi et al. (1998); Felser et al. (1998). The electrical conductivity of ZrTe3 is highest in the cross-chain direction (along the direction of the lattice vector), and, depending on the experimental work, it is a factor of 1.4 to 1.9 larger than the conductivity in the chain direction (along the lattice vector) Takahashi et al. (1984); Felser et al. (1998). At K, experimental values of the electrical conductivity measured along the -axis are (m)-1 [Takahashi et al., 1984] and (m)-1 [Felser et al., 1998]; and the values measured along the -axis are (m)-1 [Takahashi et al., 1984] and (m)-1 [Felser et al., 1998]. This is a result of Te-Te and bands formed from Te orbitals. The intrachain Te-Te distance is 2.80 Å, and the cross-chain distance is 3.10 Å allowing for Te-Te bonding that results in highly dispersive electronic bands. We will see a similar anisotropy in the acoustic phonon velocities with the highest velocity also occuring in the cross-chain direction.
To investigate the effect of crystal anisotropy, we calculate the phonon dispersions and the acoustic phonon velocities along the chain, cross-chain, and cross-plane directions. The chain direction always corresponds to the reciprocal lattice vector and the paths in the Brillouin zones shown in Fig. 1(c,d). For ZrTe3, the cross-chain direction also corresponds to the lattice vector in Fig. 1(b) and the direction in Cartesian coordinates. The cross-plane direction is perpendicular to and therefore parallel to the reciprocal lattice vector. Thus, for ZrTe3, the phonon dispersion in the cross-plane direction is along the path in the Brillouin zone shown in Fig. 1(d). The closest high symmetry line in the Brillouin zone to the cross-chain direction () is and this differs from by for ZrTe3. In terms of the reciprocal lattice vectors, the direction for ZrTe3 is .
For TaSe3, the and lattice vectors have both cross-chain and cross-plane components, and the lattice vector points in the direction. The cross-chain direction is in the direction of the sum of the lattice vectors .Yamaya and Oomi (1982) The cross-plane direction is perpendicular to and therefore in the direction of where and are the reciprocal lattice vectors in the plane. Thus, for TaSe3, the phonon dispersion in the cross-plane direction is along the path in the Brillouin zone shown in Fig. 1(c). The closest high symmetry line in the Brillouin zone to the cross-chain direction is along which runs between and the corner of the and faces in Fig. 1(c). This differs from the true cross chain direction by . The true cross chain direction is .
III Methods
Structural optimization of each material is performed using density functional theory with projector-augmented-wave (PAW) method Blöchl (1994) and Perdew-Burke-Ernzerhof (PBE) exchange correlation functionals Perdew et al. (1996), as implemented in the Vienna ab initio simulation package (VASP) Kresse and Hafner (1993); Kresse and Furthmüller (1996). The van der Waals interactions are included by semi-empirical correction of Grimme-D2 Grimme (2006). Converged Monkhorst-Pack grids of 993 are used for TaSe3 and ZrTe3. All structures are relaxed until the forces on each atom is less than 10-5 eV/Å and the energy convergence reaches 10-8 eV. The relaxed lattice constants of TaSe3 and ZrTe3 are within 1% of the experimentally reported values. The magnitudes and angles are provided in the Appendix along with the calculated electronic dispersion.
| Material | Mode | |||||
|---|---|---|---|---|---|---|
| LA | 3962 | 4956 | 3814 | 2342 | 4105 | |
| TaSe3 | TA1 | 1558 | 1256 | 2000 | 1467 | 1824 |
| - | 2143 (35.6) | - | - | - | ||
| TA2 | 2374 | 2294 | 2446 | 1963 | 2481 | |
| - | 2409 (38.0) | - | - | - | ||
| LA | 4723 | 4343 | 3256 | 4686 | 4734 | |
| ZrTe3 | TA1 | 1618 | 1629 | 1562 | 1634 | 1511 |
| - | 1829 (23.1) | - | 1651 (13.5) | - | ||
| TA2 | 2127 | 2406 | 2257 | 2391 | 2081 | |
| - | 2563 (37.4) | - | - | - |
To obtain the phonon frequency dispersion and other thermodynamics properties, the second-order (harmonic) interatomic force constants (IFCs) are required. The second-order IFCs are calculated using the finite-displacement, supercell approach as implemented in PHONOPY Togo et al. (2008); Togo and Tanaka (2015). For the phonon dispersion of TaSe3 and ZrTe3, a supercell size of 222, has been used, with a K-point grid of 262 and 664, respectively.
The thermal conductivity tensor is calculated from the phonon Boltzmann transport equation, within the three-phonon scattering approximation as implemented within ShengBTE, Li et al. (2014a); Li and Mingo (2015)
| (1) |
In Eq. (1), is the phonon energy of each phonon mode , is the equilibrium Bose-Einstein distribution of that mode and is the group velocity. represents both the phonon branch index and wave vector . is the volume and is the number of points in the irreducible Brillouin zone. The quantity where is the lifetime in the relaxation-time approximation (RTA), and is a correction to the RTA from an iterative solution of the PBTE. Full details of the theory are described in Ref. Li et al. (2014a). Diagonal elements of along other directions are obtained by a unitary transformation (rotation) of the thermal conductivity tensor.
The calculation of the three-phonon matrix elements, needed for the calculation of and Li et al. (2014a), requires the third-order (anharmonic) IFCs. A 221 supercell is used to calculate the anharmonic IFCs, which generates 3472 and 520 atomic structure configurations for TaSe3 and ZrTe3, respectively. Atomic interactions up to fifth-nearest neighbor are considered. Both the RTA and full iterative approach, are used to solve the phonon BTE, as implemented in the ShengBTE package Li et al. (2014a, 2012). In the iterative approach, is converged to a precision of 10-5 between iterative steps. Convergence with respect to the k-point grid is also checked. The converged Monkhorst-Pack grids are 14146 for TaSe3 and 8148 for ZrTe3.
IV Results and discussions
IV.1 Phonon dispersion
The phonon dispersions of TaSe3 and ZrTe3 are shown in Fig. 1(e,f). The color scheme indicates the absolute group velocity at each phonon q-vector and phonon branch with the magnitudes given by the color bars. The large number of atoms in the unit cells result in many low-frequency optical modes. A number of the optical modes are highly dispersive. Experimentally, the many optical modes create complex Raman spectra with closely spaced peaks. The red circles indicate the peaks from experimental Raman data.Wieting et al. (1982); Zwick et al. (1980) Most of the experimental Raman peaks match well with the DFT calculated phonon frequencies at as shown in Fig. 1(e,f). The experimental and calculated values are listed in the Supplementary Information along with images of the displacements and symmetry of each mode at . Below, we first discuss the anisotropy of the acoustic modes, and then we discuss the nature of several of the lower frequency, dispersive optical modes.
The anisotropy of the transition metal trichalcogenides has been a topic of long-term interest. The degree with which a crystal behaves as quasi-1D or 2D depends on the strength of the interchain coupling, and the interchain coupling manifests itself in the directional dispersions of both the electrons and phonons. Larger coupling results in more dispersive bands and higher velocities. Thus, the phonon velocities give one measure of the anisotropy of the crystals. The velocities of the three acoustic modes along four high symmetry lines of the Brillouin zone and the exact cross-chain direction are given in Table 1.
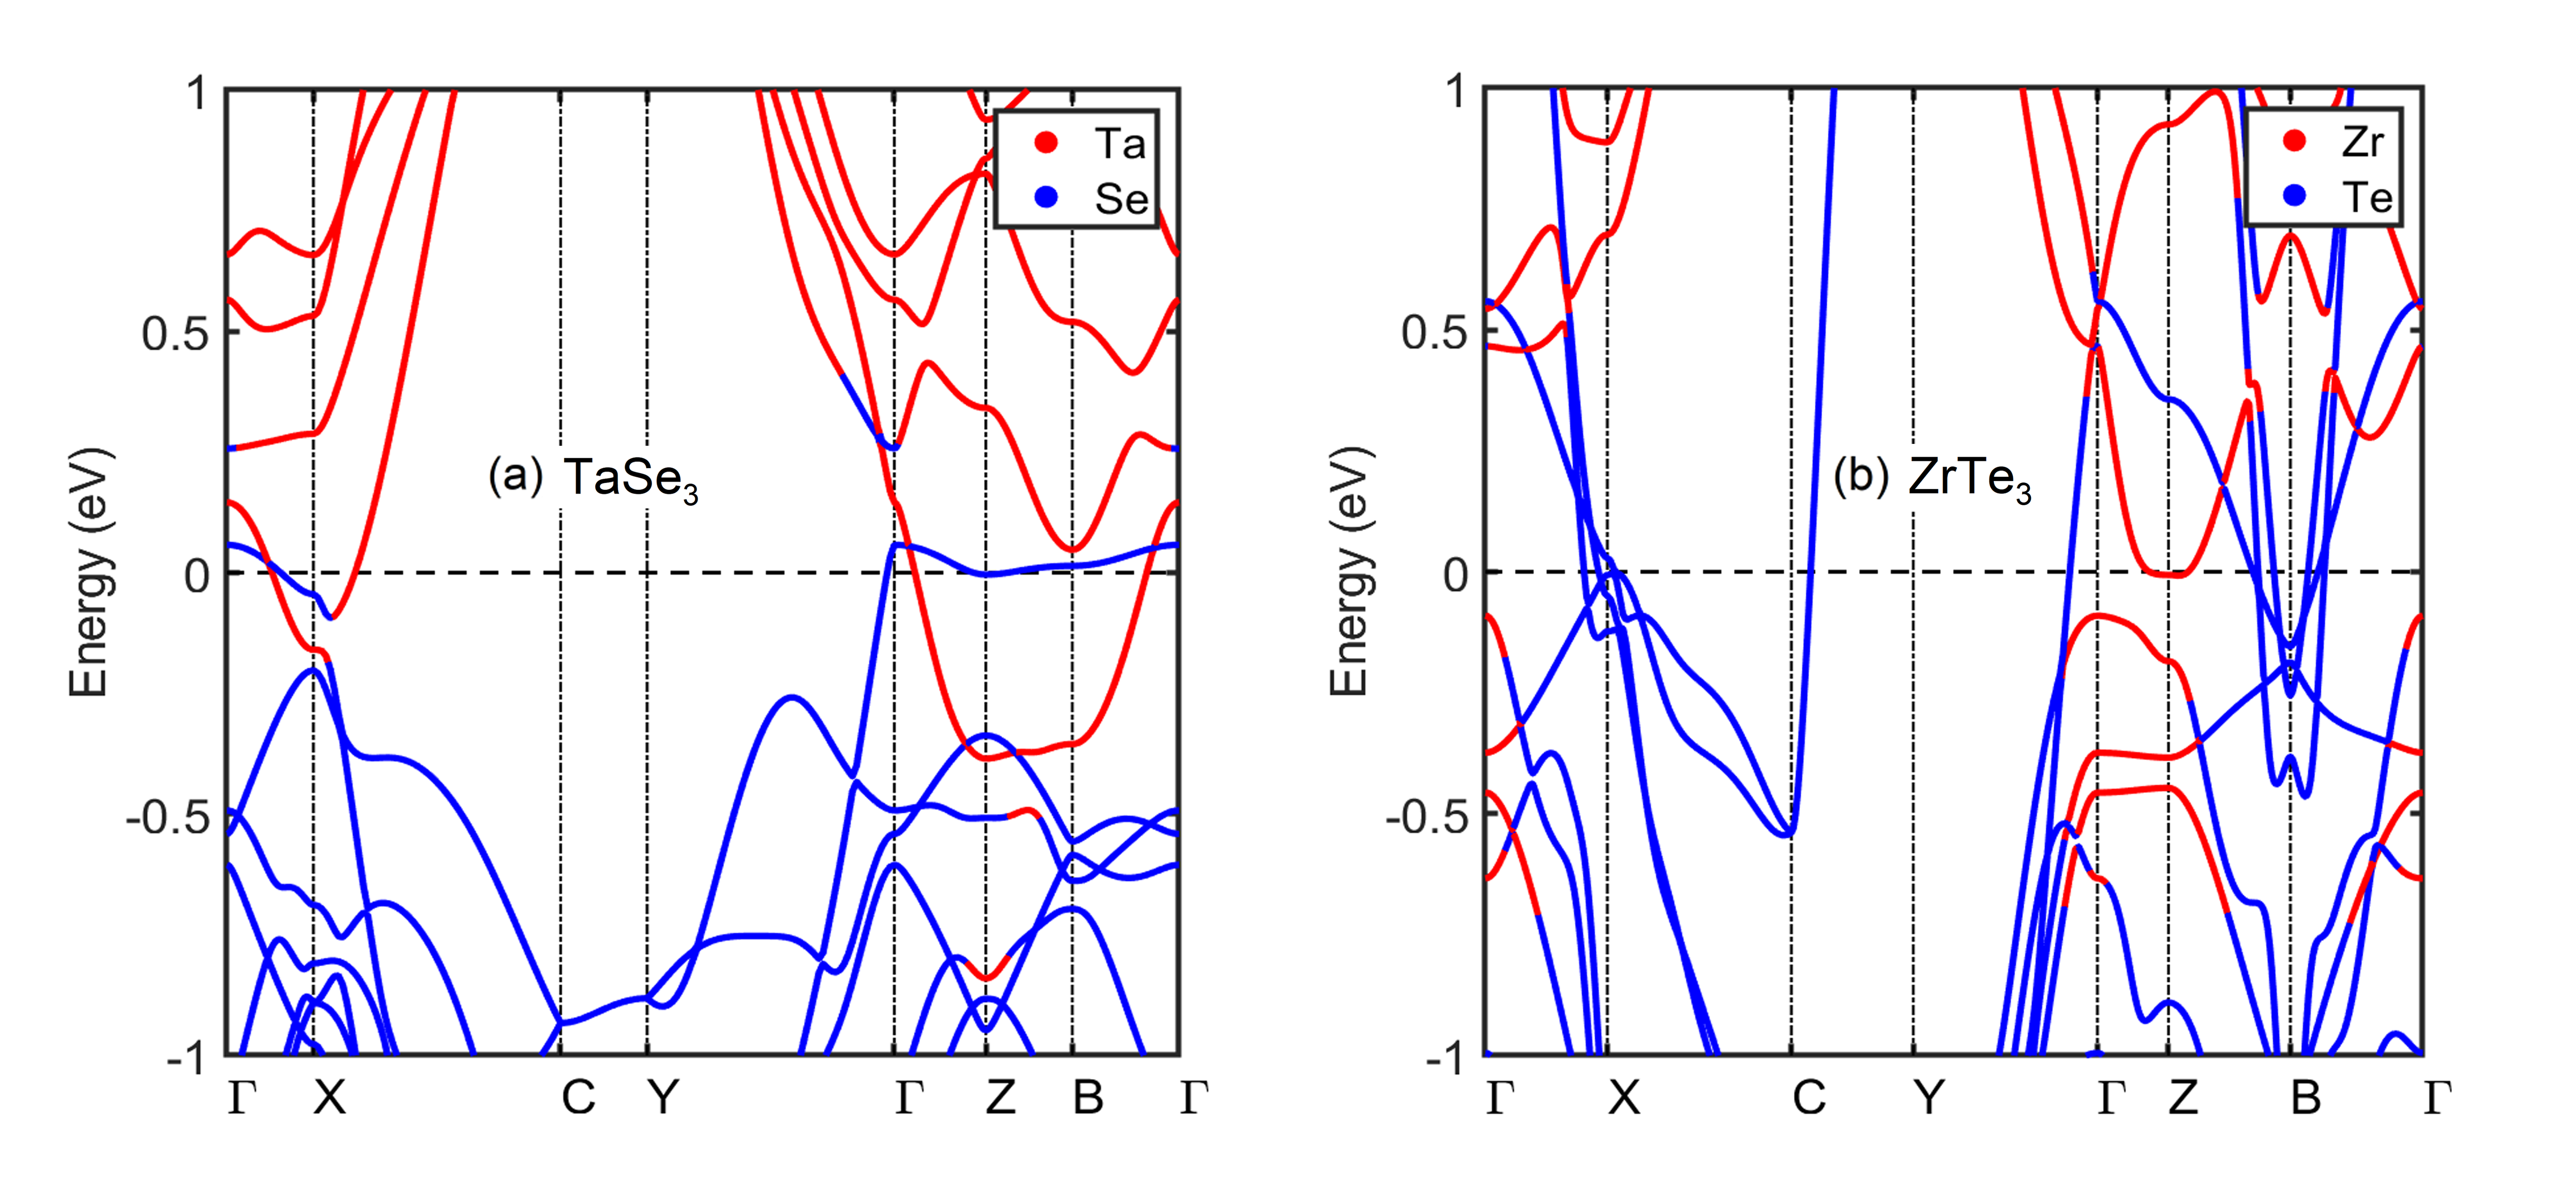
For these crystals, the LA velocities along the chain directions () are high, and for TaSe3, they are the maximum velocities among all modes and all directions, as one would expect from a quasi-1D crystal structure. For ZrTe3, the highest velocity phonon is the LA mode in the cross-chain direction. This is consistent with its electronic anisotropy in which the highest Fermi velocities occur for the Te px bands in the cross-chain direction (electronic structure plots are shown in the Appendix).
The maximum velocities of the TA shear modes are highest along the chain directions for these crystals, with the one exception of the TA2 mode of TaSe3 which has its highest velocity in the cross-chain direction. Also, there is more nonlinearity to the TA mode dispersions, such that the maximum velocities of the TA modes occur at a finite frequency on the order of 1 THz.
Finally, the lowest velocity LA modes for both crystals are in the cross-plane direction. For TaSe3, the lowest velocity TA modes are also in the cross-plane direction, and for ZrTe3, the lowest velocity TA modes are in the cross-chain direction.
The acoustic phonon velocities exhibit different degrees of anisotropy for these two crystals. If we consider, for example, the LA mode, then its anisotropy in TaSe3 is significantly larger than in ZrTe3. For TaSe3, the ratios of the maximum velocities in the chain (), cross-chain (), and cross-plane () directions are , , and . For ZrTe3, the ratios are , , and . Every ratio in TaSe3 is greater than or equal to the corresponding one in ZrTe3. The LA mode of both materials appears to be more quasi-two-dimensional rather than quasi-one-dimensional, since the in-plane anisotropy, as characterized by the ratio or , is considerably less than the cross-plane anisotropy as characterized by the ratios and . The anisotropy of the maximum velocities of the TA modes is always less than that of the LA modes. For example, in TaSe3, the TA1 velocity ratios are , , and ; and the TA2 ratios are , , and .
We now consider the optical modes. The vibrational modes of TaSe3, shown in Fig. 1(e), can be represented at as Wieting et al. (1982),
| (2) |
The modes have vibrations along the chain axis ( axis), and the modes are polarized in the plane. Illustrations of the displacements of the modes based on the point group symmetry of the isolated chains are shown in Ref. [Wieting et al., 1979]. For each mode at , the frequency, symmetry and images of the displacements calculated for the periodic unit cell are provided in the Supplementary Information (SI). The measured Raman frequency taken from the literature is also listed for each and mode.
Relevant to thermal transport, there are several low-frequency optical modes that have relatively large dispersion along the chain () direction with maximum velocities in the range of km/s. The three low-frequency optical modes with the largest dispersions (highest velocities) are or modes with displacements along the chain direction. Modes 5 (56.3 cm-1) (), 6 (57.1 cm-1) (), and 8 (74.5 cm-1) () at (counting upwards from 0 frequency) are examples of such modes. Mode 4 (52.0 cm-1, ), with displacements in the plane is slightly less dispersive immediately near , but it has a relatively constant velocity of km/s along the entire line. Above 75 cm-1, the longitudinal acoustic mode appears to hybridize with many optical modes resulting in significant dispersion along for modes between 75 cm-1 and 130 cm-1.
The other types of optical modes are the and modes with either rotation or libration type non-collinear displacements in the plane perpendicular to the 1D chains. The 4th (51.7 cm-1) (), 7th (70.2 cm-1) (), and 9th (82.7 cm-1) () modes at correspond to such modes. In mode 4, each half of the unit cell, on either side of the van der Waals gap, has a rotational type displacement, and the rotational displacements of each half are out of phase by . This is typical of all of the rotational type modes with displacements on the plane.
Fig. 1(f) shows the phonon dispersion of ZrTe3. For ZrTe3, there are 24 vibrational modes which can be represented at as Zwick et al. (1980)
| (3) |
Similar to TaSe3, the displacements of the modes have vibrations along the chain () axis, and the modes have displacements on the plane. There are 4 optical modes with relatively large dispersions along the chain (): modes 5 (64.0 cm-1, ), 8 (69.1 cm-1, ), 9 (70.4 cm-1, ), and 12 (91.1 cm-1, ). For ZrTe3, both types of displacements give rise to these relatively high velocity optical modes. Modes 5 and 8 have displacements along the chain and modes 9 and 12 have displacements on the plane. Between 75 cm-1 and 110 cm-1, hybridization occurs between the longitudinal acoustic mode and the optical modes resulting in significant dispersion of the modes in that frequency window.
Although the highest velocity acoustic mode is in the cross-chain () direction, there are fewer dispersive optical modes along than in the chain direction. For this reason, the thermal conductivity is highest in the chain direction, since, as we shall see, a significant proportion of the heat is carried by the optical modes.
| Type | Materials | Thermal Conductivity (Wm-1K-1) | Remarks | Reference |
|---|---|---|---|---|
| TaSe3 | 6.2, 0.80, 0.13 | Chain, cross-chain and cross-plane directions | This paper | |
| ZrTe3 | 9.6, 3.9, 2.3 | Chain, cross-chain and cross-plane directions | This paper | |
| TaSe3 | 4.8 | Experimental result (extrapolated to 300K) | Zawilski et al. (2010) | |
| NbSe3 | 24 | Bulk Material | Brill et al. (1981) | |
| Quasi-1D | TiS3 | 5.8, 2.8 | Chain and cross-chain | Liu et al. (2020) |
| ZrTe3 | 7 | Bulk polycrystalline | Hooda et al. (2019) | |
| ZrTe5 | 11.2 | Bulk material | Smontara and Biljakovic (1985) | |
| ZrTe5 | 3.9, 1.9, 0.4 | Chain, cross-chain and cross-plane directions | Zhu et al. (2018) | |
| ZrTe5 | 2.2 | Bulk polycrystalline | Hooda and Yadav (2017) | |
| HfS2 | 9 | First principle study | Yumnam et al. (2015) | |
| HfSe2 | 8 | First principle study | Yumnam et al. (2015) | |
| MoS2 | 1 | Pristine | Kim et al. (2010) | |
| MoSe2 | 0.9 | Pristine | Kim et al. (2010) | |
| MoSe2 | 2.3 | Compacted polycrystalline | Brixner (1962) | |
| MoTe2 | 1.9 | Compacted polycrystalline | Brixner (1962) | |
| NbS2 | 11.8 | Bulk material | Nishio (1994) | |
| NbSe2 | 2.1 | Compacted polycrystalline | Brixner (1962) | |
| NbTe2 | 1.9 | Compacted polycrystalline | Brixner (1962) | |
| TaS2 | 5 | Bulk material | Núñnez-Regueiro et al. (1985) | |
| 2D | TaSe2 | 16 | Bulk material | . Núñnez-Regueiro et al. (1985); Yan et al. (2013) |
| TaSe2 | 1.7 | Compacted polycrystalline | Brixner (1962) | |
| TaTe2 | 1.4 | Compacted polycrystalline | Brixner (1962) | |
| TiS2 | 6.8, 4.2 | In-plane and out-of-plane | Imai et al. (2001) | |
| WSe2 | 1.7 | Compacted polycrystalline | Brixner (1962) | |
| WS2 | 2.2 | Pristine | Kim et al. (2010) | |
| WSe2 | 0.8 | Pristine | Kim et al. (2010) | |
| WTe2 | 1.6 | Compacted polycrystalline | Brixner (1962) | |
| ZrSe2 | 10 | First principle study | Yumnam et al. (2015) | |
| ZrS2 | 18 | First principle study | Yumnam et al. (2015) |
IV.2 Thermal conductivity
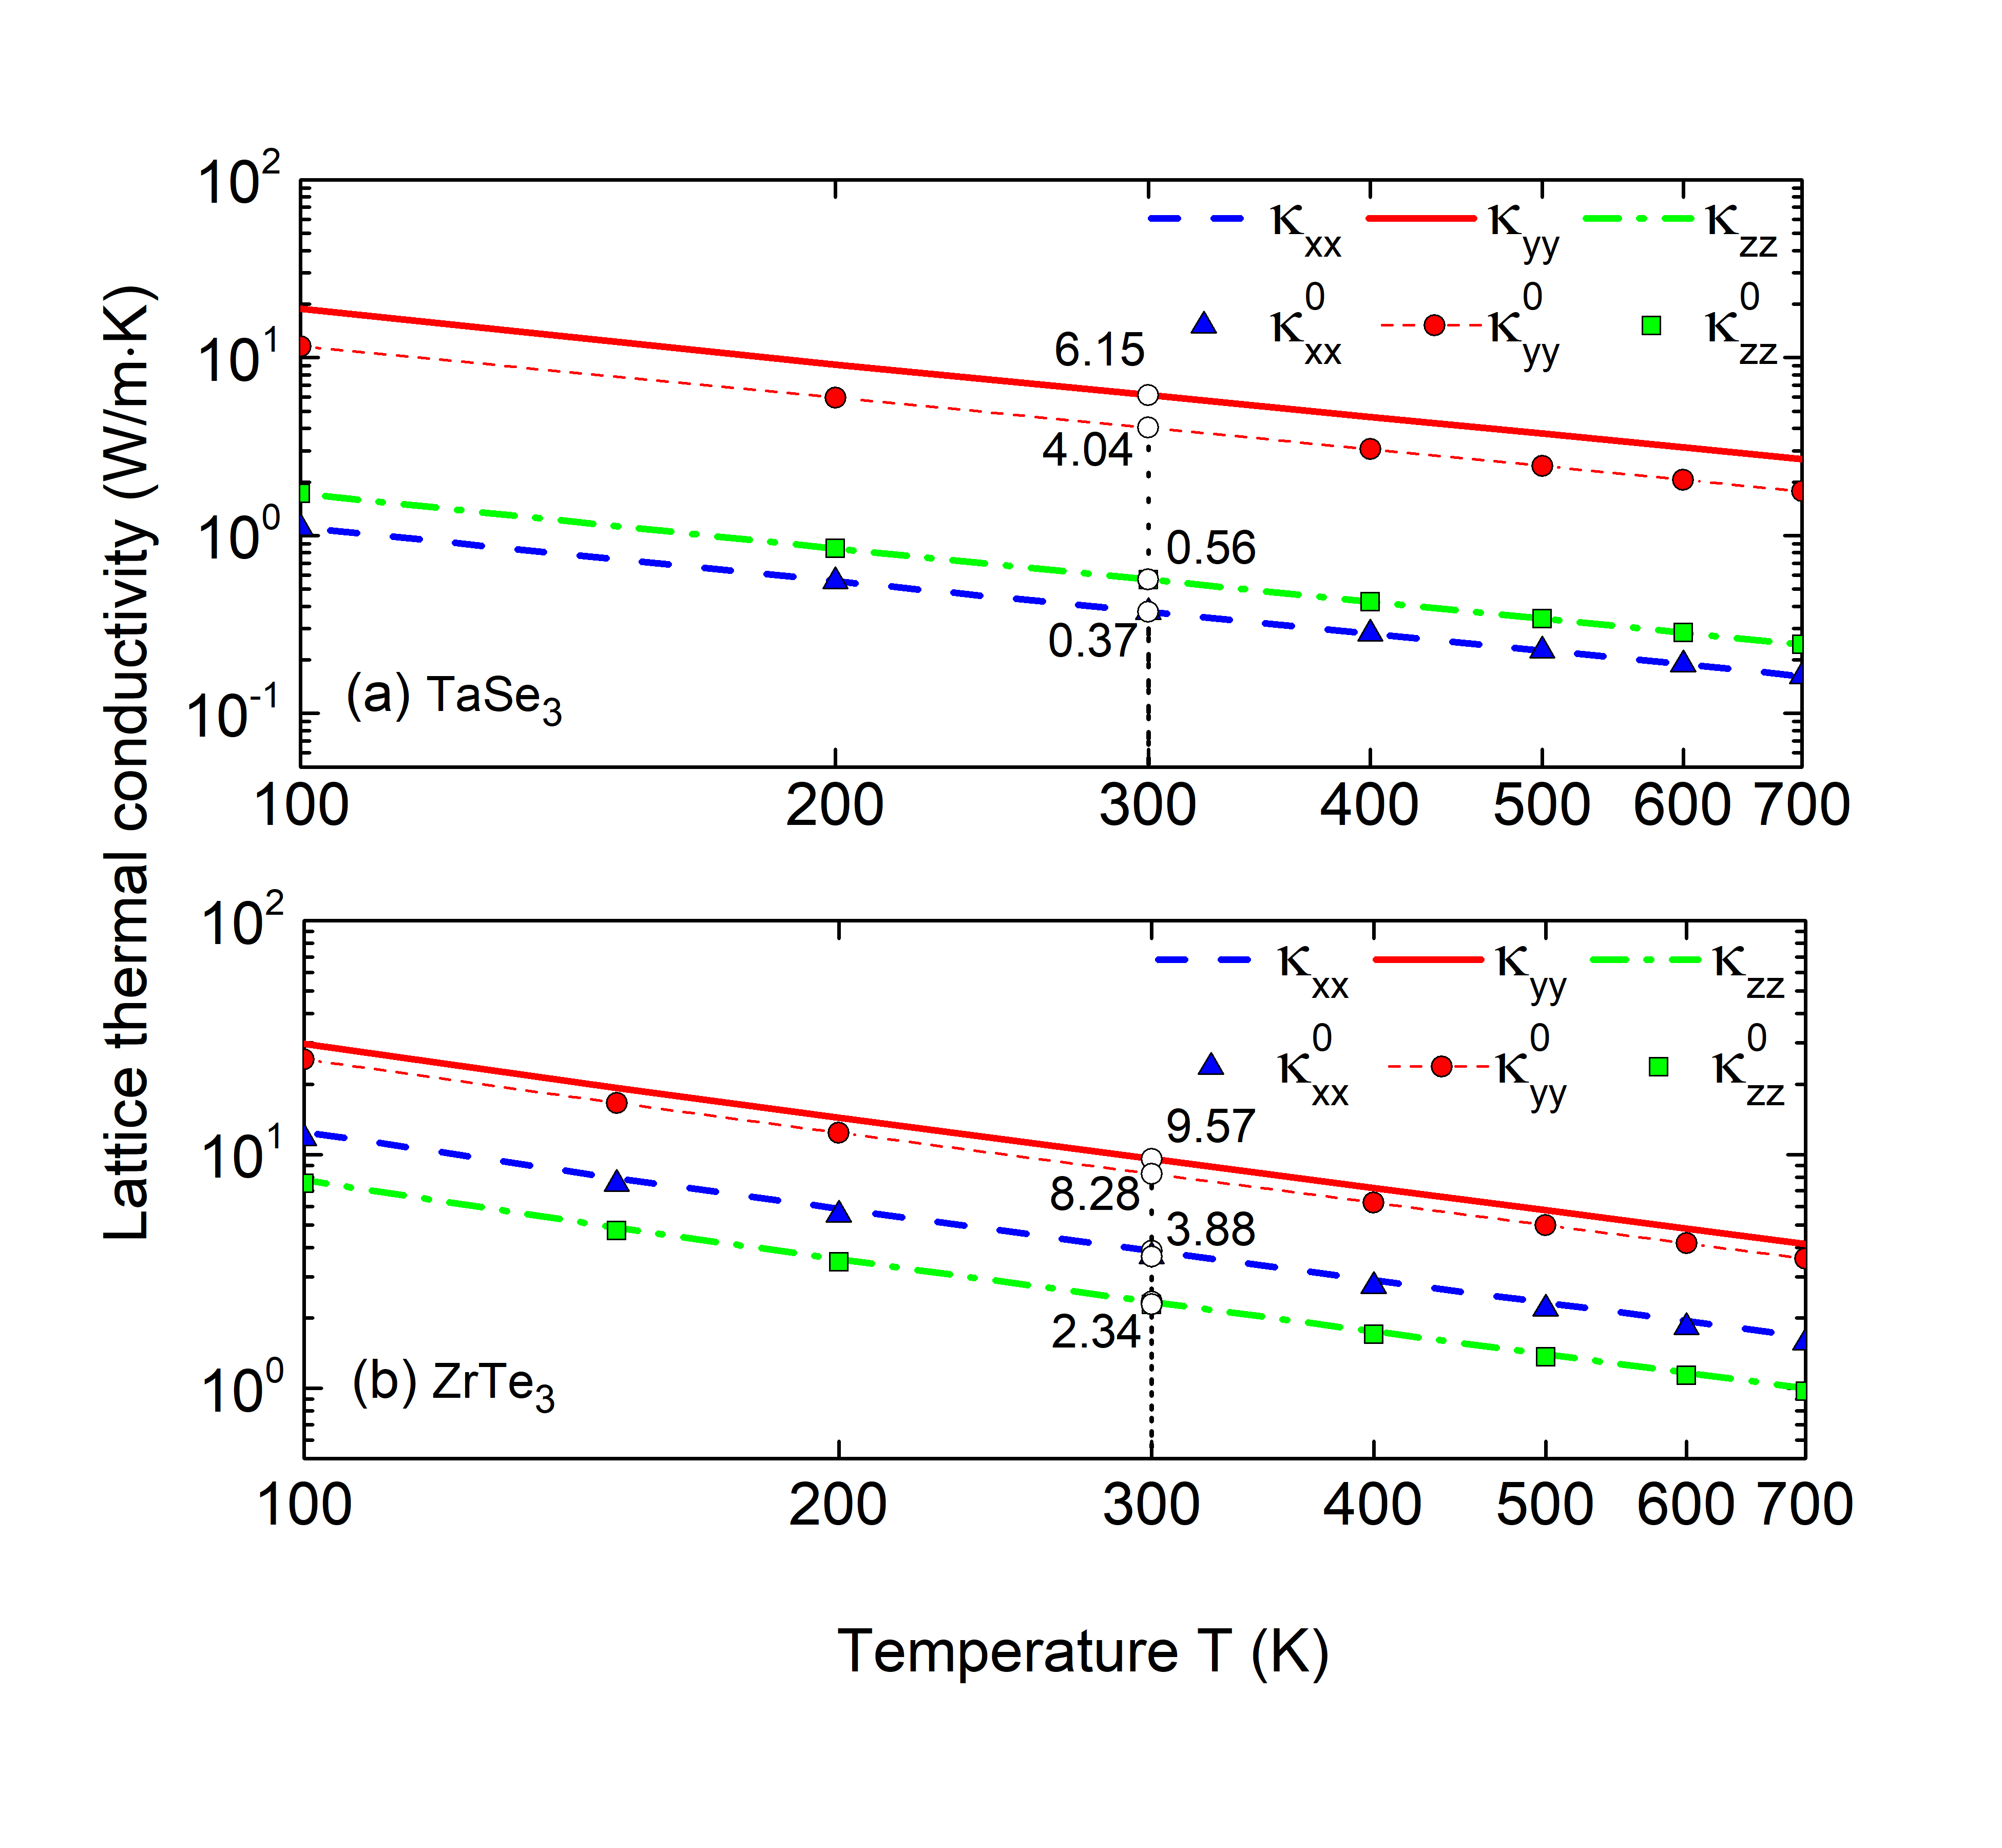
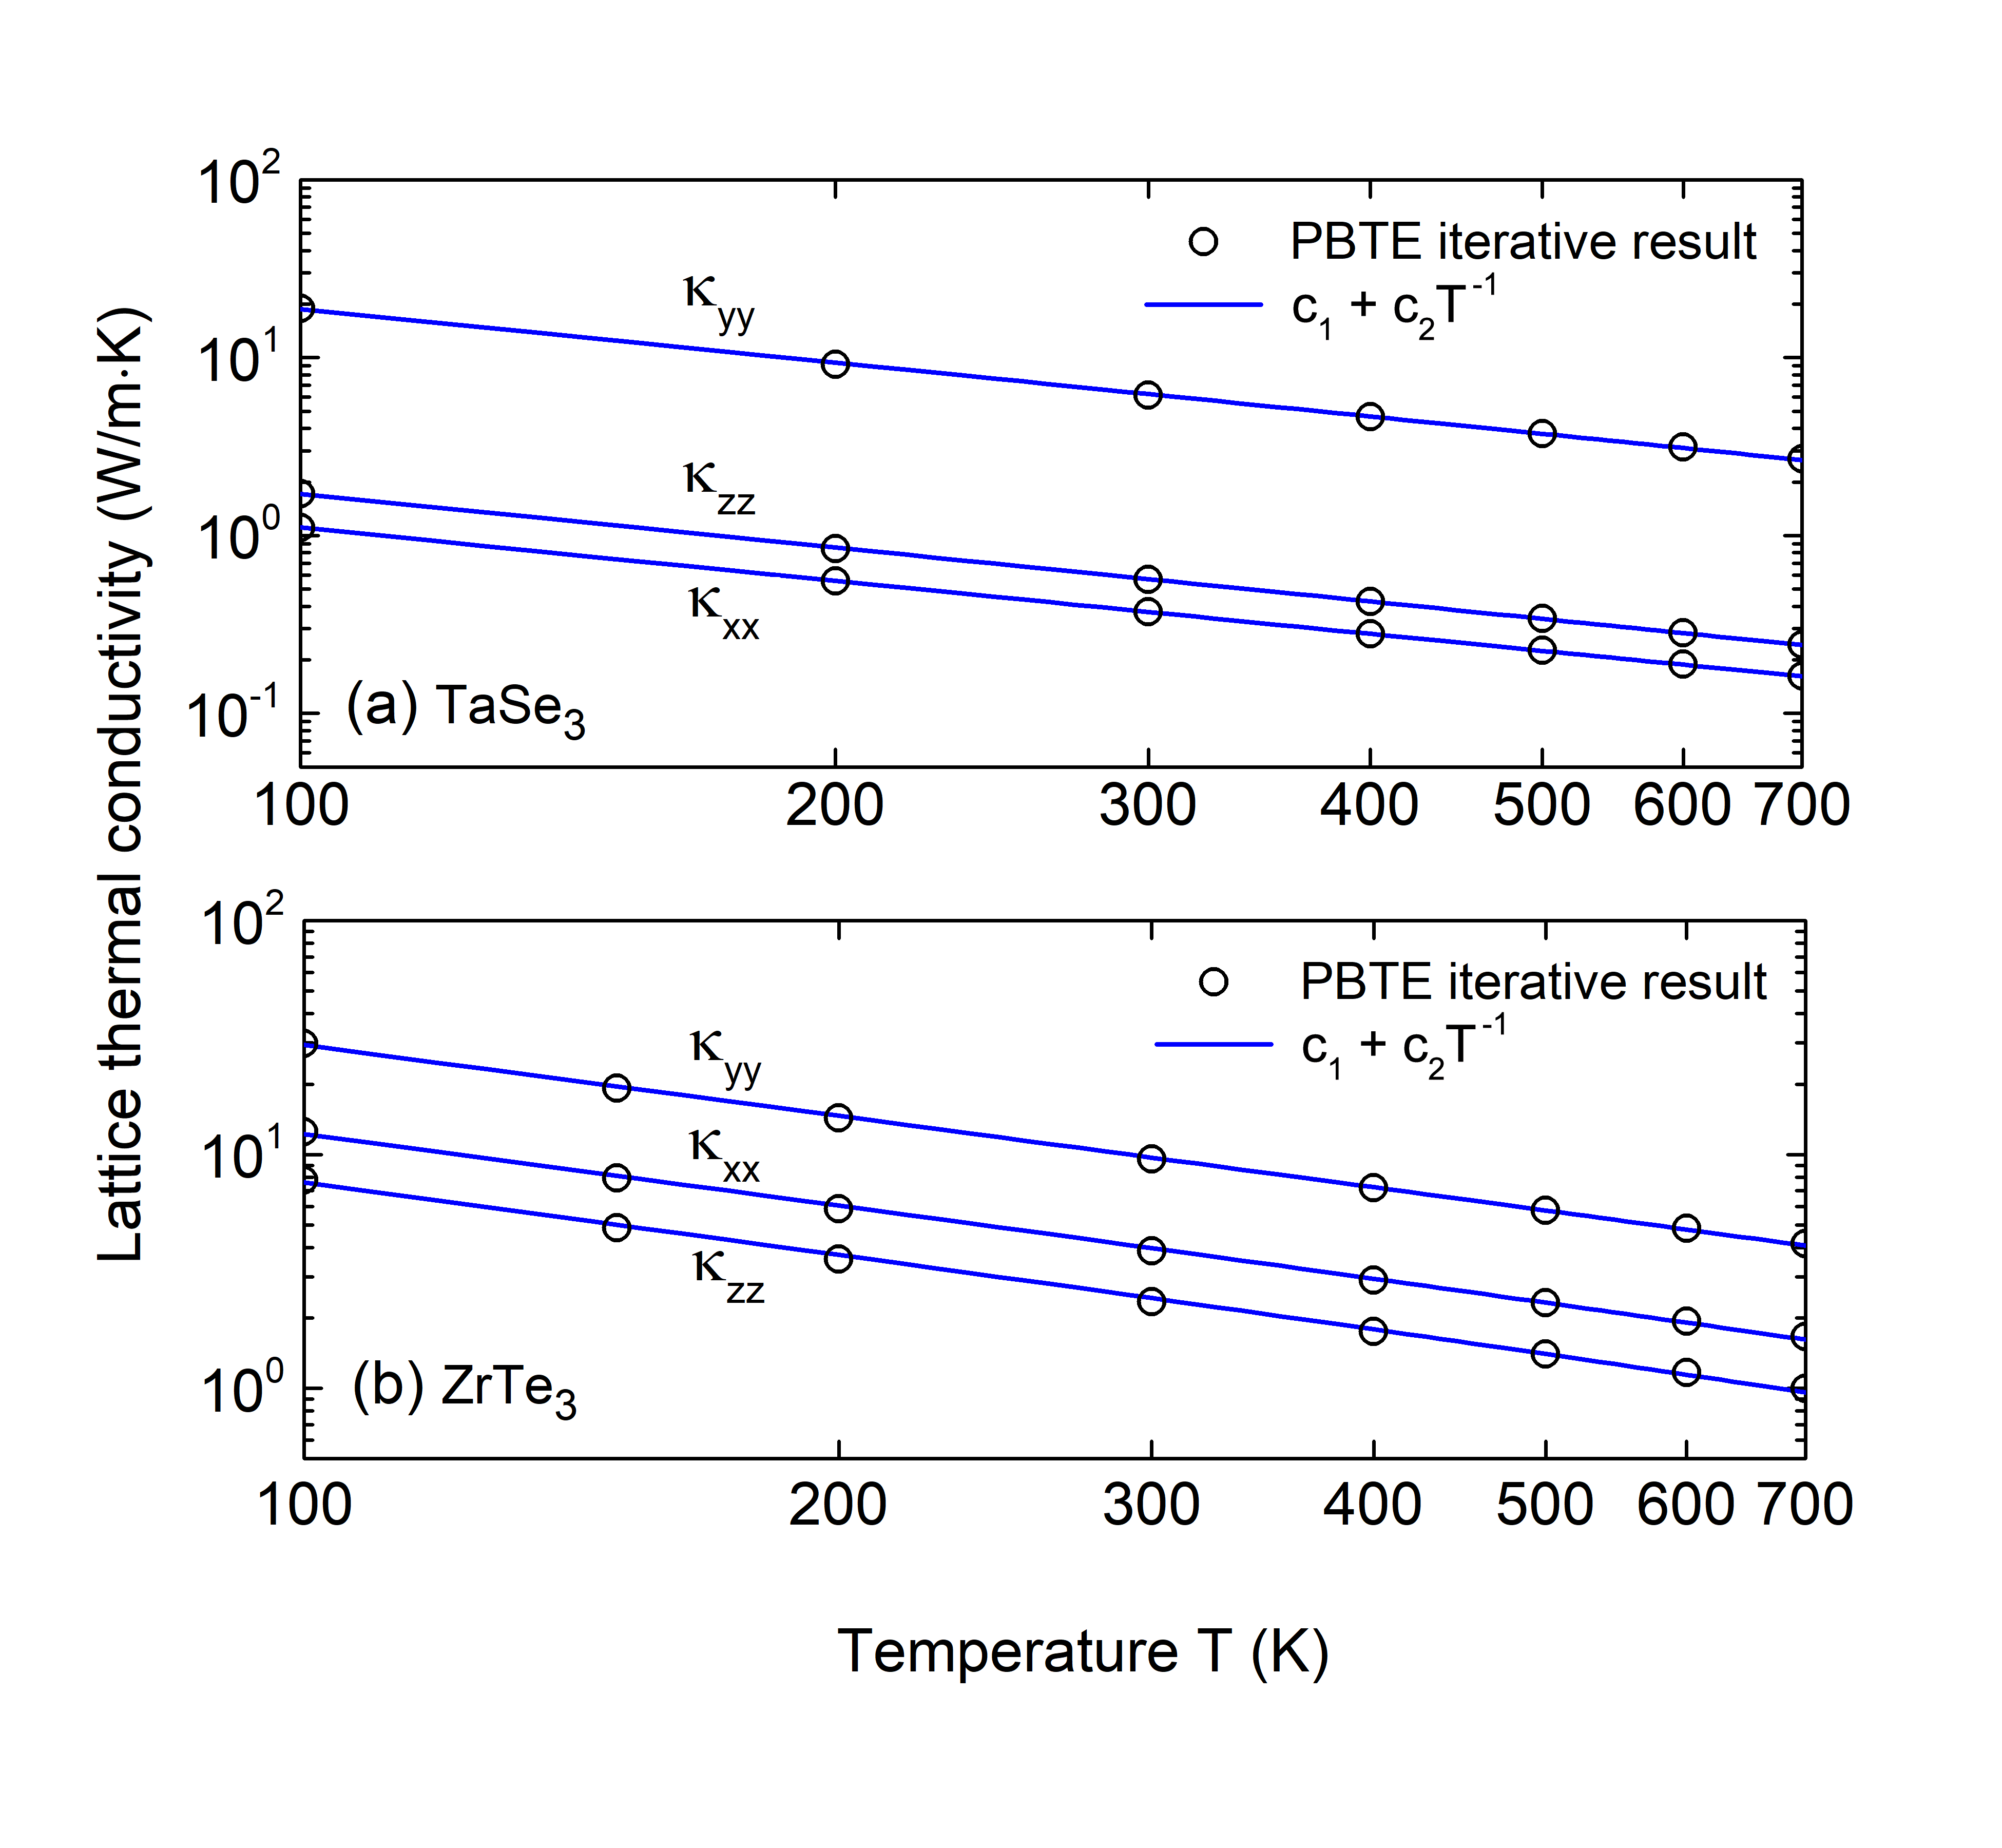
Figure 2 shows the lattice thermal conductivity for TaSe3 and ZrTe3 calculated from the PBTE using the full iterative approach. The iterative approach gives values slightly higher than those from the relaxation time approximation, and a comparison of the results from the two approaches is given in the Appendix. Below, we discuss the magnitudes and anisotropies of the thermal conductivities using the K values shown in Fig. 2. The lattice thermal conductivities in the chain directions () of TaSe3 and ZrTe3, are 6.15 Wm-1K-1 and 9.57 Wm-1K-1, respectively. These values are similar to those of other metallic 2D TMD materials as shown in Table 2. The calculated lattice thermal conductivities of TaSe3 and ZrTe3 follow a T-1 dependence expected when the thermal conductivity is limited by three-phonon scattering. Yao et al. (2017) The diagonal elements of are fitted to the function , and the values of the coefficients are tabulated in the Appendix. The root mean square errors of all fits to the numerical data are less than Wm-1K-1.
The anisotropy of the thermal conductivity in TaSe3, as indicated by the ratios and is large. For ZrTe3, the anisotropy given by the ratios and is considerably less. Unlike the electrical conductivity which is maximum in the cross-chain direction, the thermal conductivity of ZrTe3 is maximum in the chain direction, even though the maximum phonon velocity occurs at very low frequencies for the LA mode in the cross-chain direction.
The experimental reports of thermal conductivity of quasi-1D materials are rare, due to the difficulty in measuring the thermal conduction in such ribbon-like geometries Zawilski et al. (2010). To our knowledge, only one experimental study of the thermal conductivity of TaSe3 has been reported using a parallel thermal conductance (PTC) technique Zawilski et al. (2001), and the data points are shown in Fig. 2(a)Zawilski et al. (2010). The experimental values are lower than the calculated values, and the comparison improves at higher temperatures when the phonon-phonon scattering mechanism starts to dominate. At T = 200 K, the experimental and calculated values are 6.62 Wm-1K-1 and 9.11 Wm-1K-1, respectively. From the experimental side, the accuracy of PTC technique to handle chain-structures like TaSe3 is under question Zawilski et al. (2010). Missing from the calculations are the effects of impurities, surface scattering, finite grain sizes, and random isotopes Lindsay et al. (2013). For ZrTe3, there is one reported measurement of the thermal conductivity in a bulk, polycrystalline sample with a value of 7 Wm-1K-1 at room temperature which is similar to our calculated value of 9 Wm-1K-1.
| (nm) | |||||
|---|---|---|---|---|---|
| x | y | z | cross-chain | cross-plane | |
| TaSe3 | 7.3 | 10.6 | 8.5 | 8.2 | 7.1 |
| ZrTe3 | 25.3 | 43.7 | 178 | 25.3 | 178 |
Order-of-magnitude estimates of the electronic components of the thermal conductivities can be obtained from the Wiedemann-Franz law using the Sommerfeld value of the Lorenz number, 2.44 10-8 W K-2. Values for the Lorenz number do vary, but for room temperature metals, they tend to lie within a range of 0.6 to 2 times the Sommerfeld value. Kumar et al. (1993) Using the values for the electrical conductivities from Sec. II, the estimated room-temperature electrical component of the thermal conductivity along the chain direction for TaSe3 is 1.2 Wm-1K-1. For ZrTe3, the estimated room-temperature electrical component of the thermal conductivity along the chain direction ranges from 2.9 to 5.1 Wm-1K-1, and along the cross-chain direction, it ranges from 4.1 to 9.6 Wm-1K-1. For comparison, the corresponding values of the room temperature lattice thermal conductivities for TaSe3 and ZrTe3 along the chain direction are 6.2 and 9.6 Wm-1K-1, respectively, and for ZrTe3 along the cross chain direction, it is 3.9 Wm-1K-1. Thus, the Wiedemann-Franz law with the Sommerfeld approximation for the Lorenz number gives room-temperature electrical components of the thermal conductivities that are on the same order as the lattice components.
To understand the contribution of the phonon modes and frequencies to the lattice thermal conductivity, we consider the room-temperature, normalized thermal conductivity as a cumulative function of phonon frequency in Fig. 3. In TaSe3, 50% of the thermal conductivity in the chain direction () is contributed by modes with frequencies below 75 cm-1. The thermal conductivity in the plane has a larger contribution from lower frequency phonons. In the cross-chain direction, 50% of is contributed by modes with frequencies below 64 cm-1, and in the cross-plane direction, 50% of is contributed by modes with frequencies below 36 cm-1.
In ZrTe3, the heat is carried by lower frequency phonons than in TaSe3. In ZrTe3, 50% of thermal conductivity along both the chain direction () and cross-chain direction () is contributed by phonons with frequencies below 52 cm-1. In the cross-plane direction 50% of is contributed by modes with frequencies below 26 cm-1.
For both of these materials, a significant percentage of the heat at room temperature is carried by the optical modes. This phenomenon has also recently been observed in TiS3 Liu et al. (2020). Consider the chain direction, . In TaSe3, essentially all of the modes above 75 cm-1 are optical modes, as can be seen in Fig. 1(e). Thus, approximately 50% of the heat in TaSe3 at room temperature is carried by optical modes. In ZrTe3, the spectrum along the chain direction above 64 cm-1 is composed primarily of optical modes, and it carries 33% of the heat.
Another way to analyze the physics of the heat current carried by phonons is to calculate the normalized as a function of the cut-off mean free path. The results are shown in Fig. 4. For TaSe3, 90% of the thermal conductivity in the chain direction is carried by phonons with a mean free path of 25 nm or less. In both the cross-chain and cross-plane directions 90% of the thermal conductivity is carried by phonons with mean free paths of 21 nm or less. The corresponding cut-off mean free paths for ZrTe3 are approximately an order of magnitude greater. For ZrTe3, in the chain, cross-chain, and cross-plane directions, 90% of the heat is carried by phonons with mean free paths less than or equal to 365 nm, 110 nm, and 700 nm, respectively.
To obtain a representative mean free path () of heat-carrying phonons, the cumulative with respect to the cut-off mean free path () in Fig. 4, is fitted to a single parametric function, Li et al. (2014a); Wang et al. (2017)
| (4) |
where, is the maximum thermal conductivity. The values for for the different transport directions are tabulated in Table 3. They correspond closely to the cut off mean free paths in Fig. 4 that account for 50% of the thermal conductivity in each direction. These values serve as indicators as to how and when the thermal conductivity will be affected by geometrical scaling. When dimensions are reduced below , the thermal conductivity will be reduced. The representative mean free path () for TaSe3 is lower than that of ZrTe3, as shown in Table 3. This is consistent with the fact that, in the low frequency ( cm-1) region, the phonon scattering lifetimes in TaSe3 are approximately one order of magnitude shorter than those of ZrTe3, as discussed below and shown in Fig. 5(c,d). The cross-plane thermal conductivity of ZrTe3 has the longest representative mean free path of 178 cm-1. This is consistent with the fact that the phonons contributing to the cross-plane thermal conductivity are very low frequency (50% of the heat is carried by phonons with frequencies below 25 cm-1). This frequency range is well below the optical branches, so that three phonon scattering is strongly restricted by energy and momentum conservation.
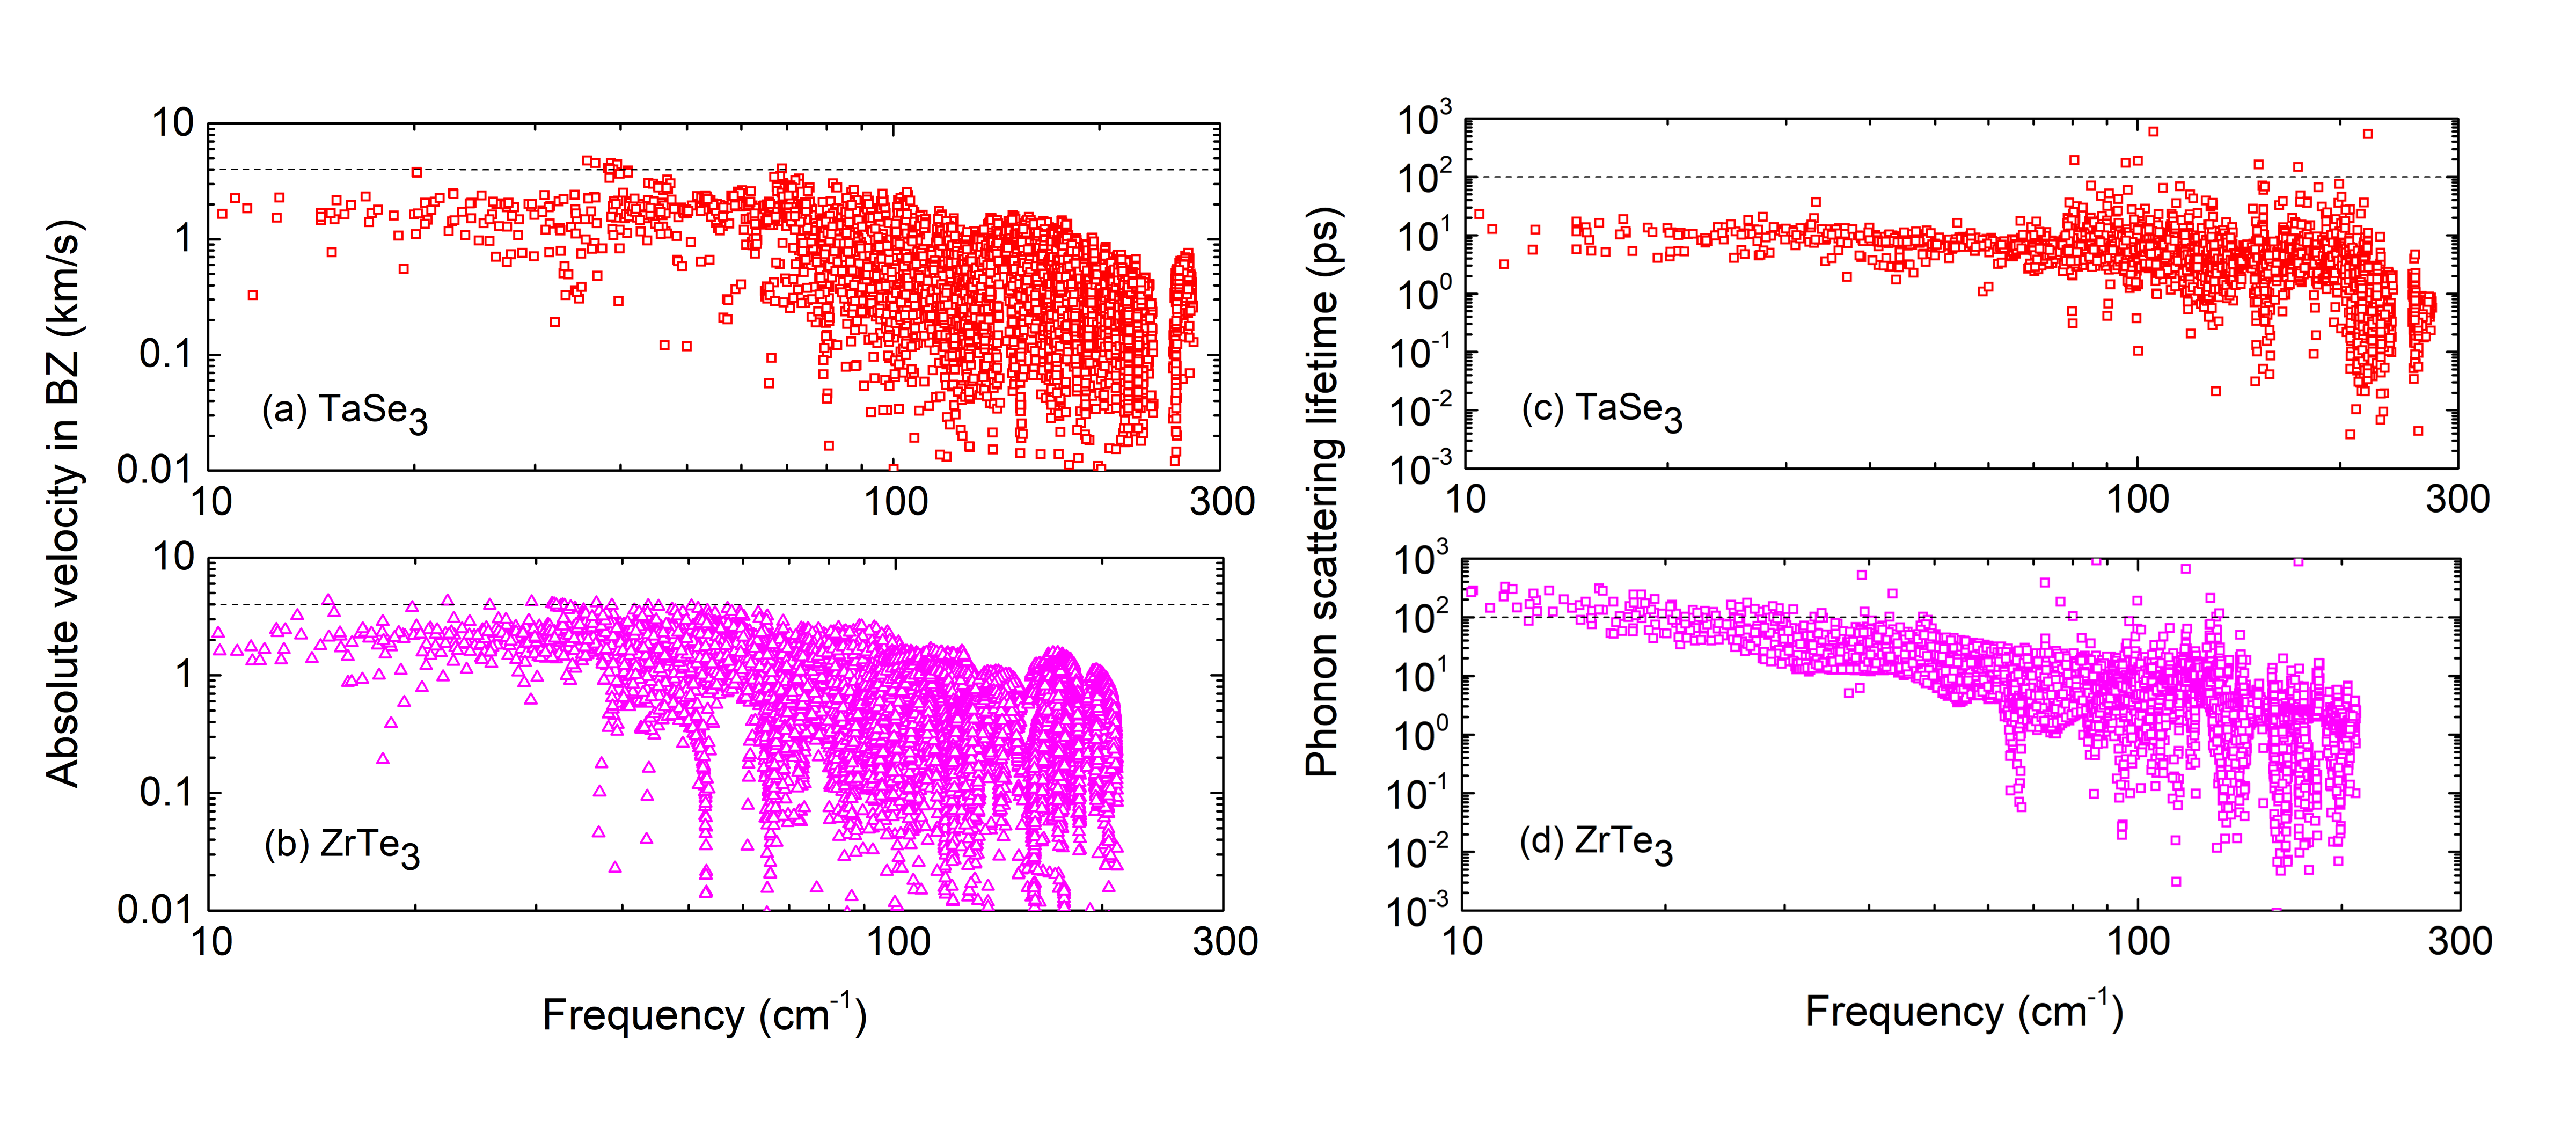
To gain further insight into why there is a significant difference between the thermal conductivity in these materials, we inspect the phonon velocity as well as the phonon lifetimes of the thermal modes. Figure 5(a,b) shows the absolute velocity distributions of the heat-carrying phonons, for each phonon mode inside the irreducible Brillouin zone (BZ), and the reference horizontal lines are at 4 km/s. The lifetimes are shown in Fig. 5(c,d), and the reference horizontal lines are at 100 ps. In the low frequency range cm-1, ZrTe3 has higher velocity phonons with longer lifetimes than those of TaSe3.
In this low frequency range, the phonon lifetimes of ZrTe3 are approximately one order of magnitude longer than those of TaSe3. For ZrTe3, the optical modes are close to or above 50 cm-1. For TaSe3, there are several optical branches that fall below 50 cm-1 accompanied by a number of band crossings and anti-crossings. Also, since the unit cell of TaSe3 is twice as large in the plane as that of ZrTe3, there are features in the acoustic dispersion along and that resemble zone-folding in which the acoustic branches fold back at the zone boundary and return to . Both of these features result in a greater number of channels for low-frequency phonon relaxation in TaSe3 compared to those in ZrTe3 and correspondingly lower phonon lifetimes. A simple illustration of how zone-folding opens new phonon relaxation channels is shown in Ref. [Li et al., 2014b].
V Summary and Conclusion
The phonon dispersions and lattice thermal conductivities of TaSe3 and ZrTe3 are determined using density functional theory and the phonon BTE. The anisotropy of the LA acoustic phonons, as characterized by the ratios of the chain, cross-chain, and cross-plane velocities, is considerably larger in TaSe3 than in ZrTe3. The anisotropy of the maximum velocities of the TA modes is always less. The maximum LA velocity in ZrTe3 occurs in the cross-chain direction, and this is consistent with the strong cross-chain bonding that gives rise to large Fermi velocities.
However, the thermal conductivity for both crystals is maximum in the chain direction. The thermal conductivity of ZrTe3 is larger than that of TaSe3 in each of the three directions: chain, cross-chain, and cross-plane; and it is considerably more isotropic. For TaSe3 (ZrTe3), the room temperature diagonal thermal conductivity values in the three directions are = 6.2 (9.6), = 0.80 (3.9), and = 0.13 (2.3) Wm-1K-1.
A significant percentage of the heat at room temperature is carried by the optical phonons. In TaSe3, the spectrum along the chain direction above 75 cm-1 is composed of the optical branches and this part of the spectrum carries 50% of the heat at room temperature. In ZrTe3, the spectrum along the chain direction above 64 cm-1 is composed primarily of optical branches, and it carries 33% of the heat at room temperature. For TaSe3 (ZrTe3) along the chain direction at K, 50% of the heat is carried by phonons below 75 (50) cm-1, and this part of the phonon spectra consists primarily of the acoustic branches.
The differences between the two materials in their phonon velocities and lifetimes are most apparent in the low frequency range cm-1. In this frequency range, the maximum phonon velocities of ZrTe3 are approximately a factor of 2 greater than those of TaSe3 and the phonon lifetimes in ZrTe3 are approximately an order of magnitude greater than those in TaSe3. The longer lifetimes result in considerably longer mean free paths in ZrTe3 compared to those in TaSe3. The representative mean free paths in the chain, cross-chain, and cross-plain directions for TaSe3 (ZrTe3) are 10.6 (43.7), 8.2 (25.3), and 7.1 (178) nm, respectively. The shorter lifetimes in the low frequency range of TaSe3 are consistent with the presence of optical branches and zone-folding features of the acoustic branches that arise due to the doubling of the TaSe3 unit cell in the plane compared to the unit cell of ZrTe3. Both of these features serve to introduce more scattering channels for low frequency phonon relaxation.
VI Acknowledgment
This work was supported in part by the NSF under Grant No EFRI-1433395. Calculations of ZrTe3 were supported, in part, by Spins and Heat in Nanoscale Electronic Systems (SHINES) an Energy Frontier Research Center funded by the U.S. Department of Energy, Office of Science, Basic Energy Sciences under Award No DE-SC0012670. This work used the Extreme Science and Engineering Discovery Environment (XSEDE)Towns et al. (2014), which is supported by National Science Foundation Grant No. ACI-1548562 and Allocation ID TG-DMR130081.
Appendix: ADDITIONAL TABLES AND FIGURES
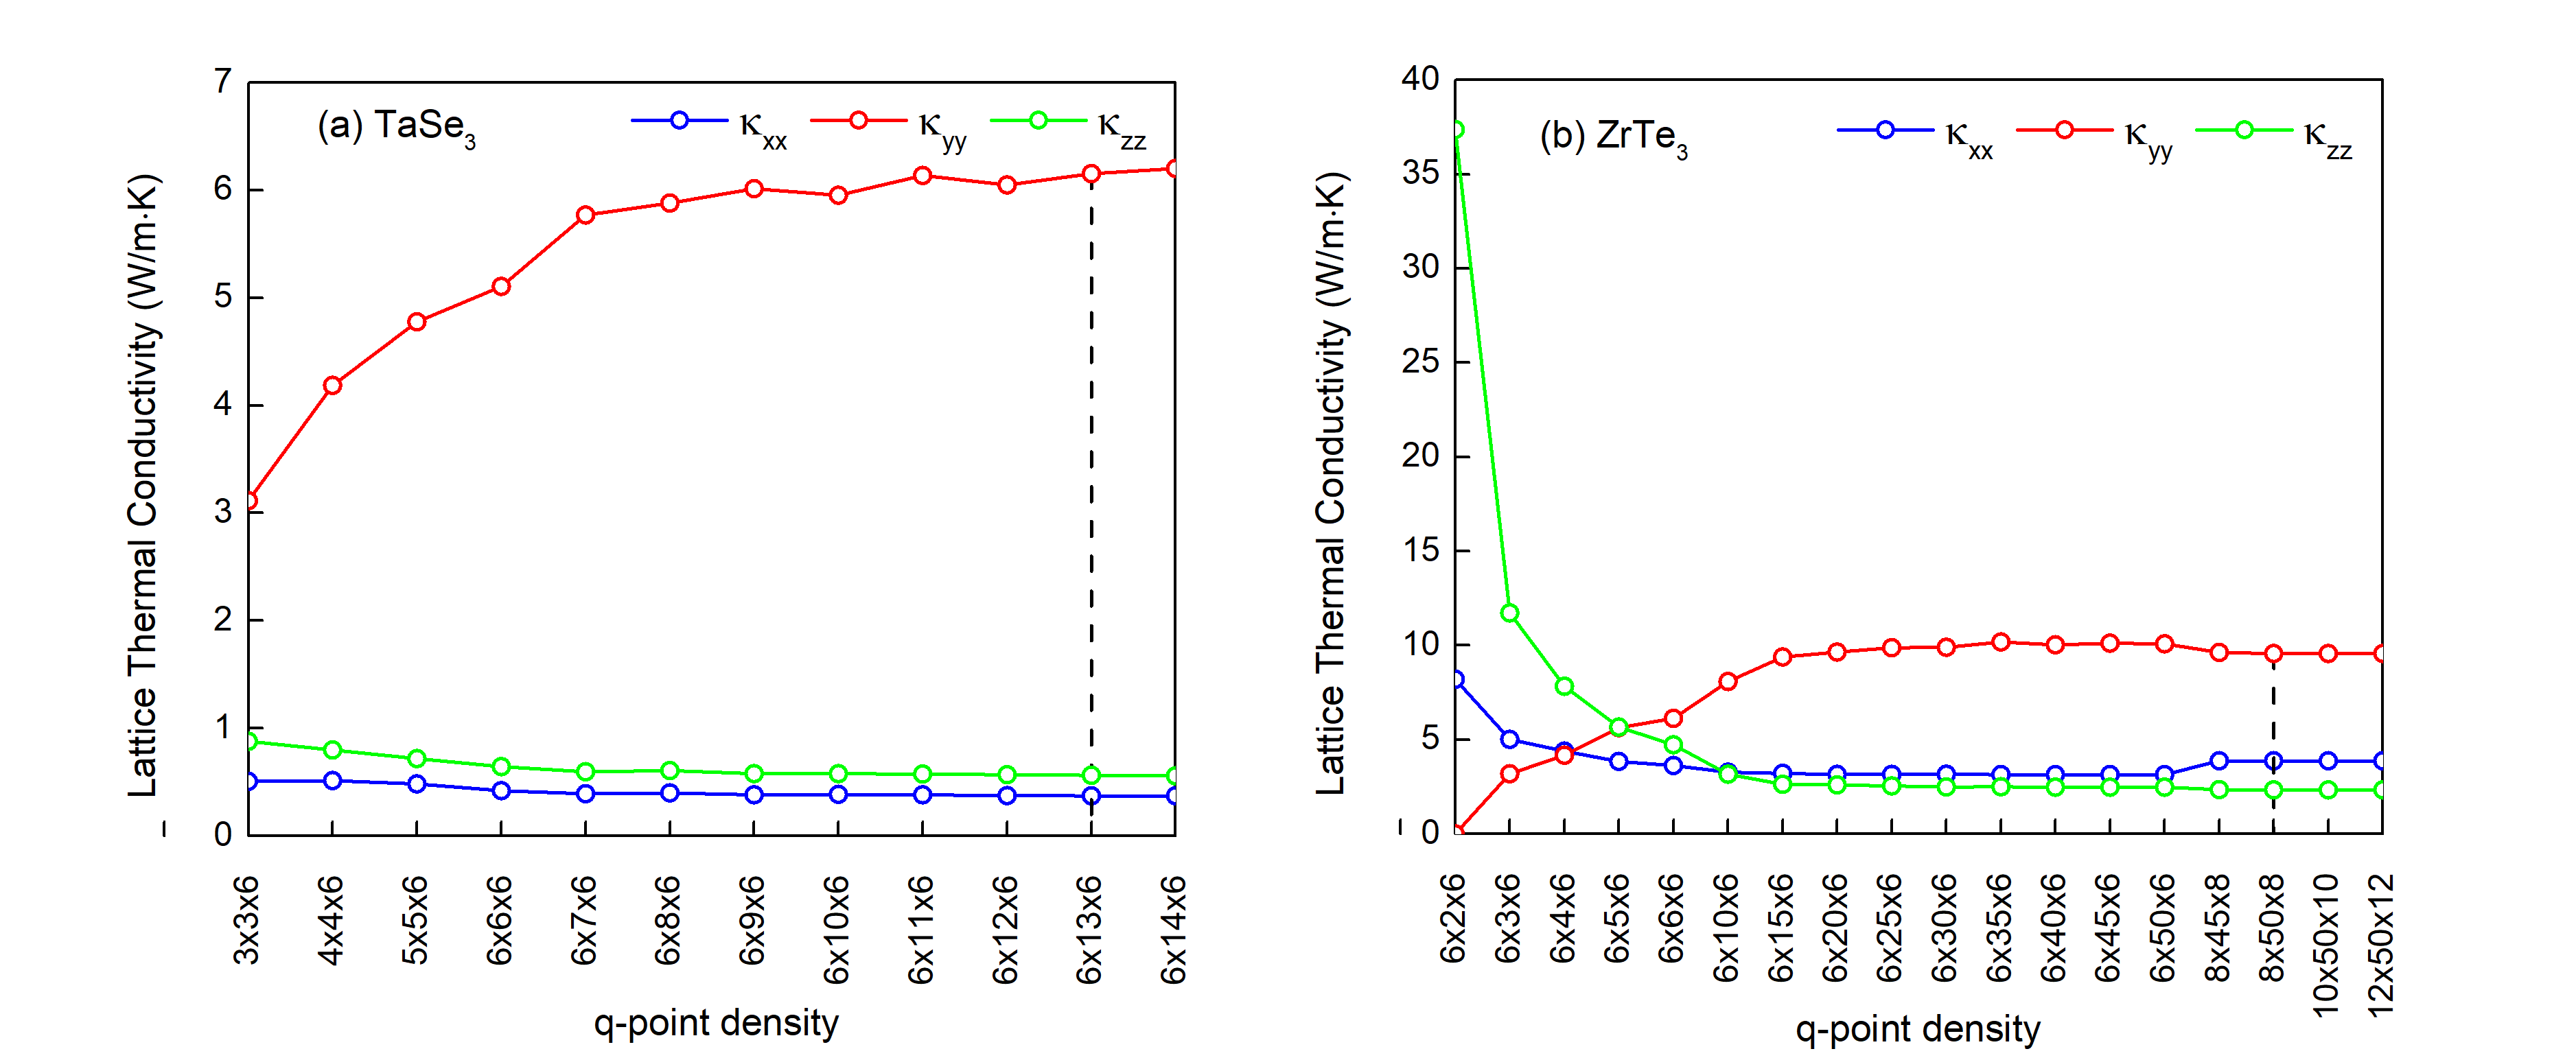
The calculated and experimental lattice constants and angles for TaSe3 and ZrTe3 are provided in Table 4. The room temperature values of the diagonal elements of the thermal conductivity tensors calculated from the RTA and the full iterative approaches are listed in Table 5, and the comparison for all temperatures is shown in Fig. 6. The fitting coefficients for the temperature dependent thermal conductivities are provided in Table 6, and the plot showing the quality of the fits is given in Fig. 7. Electronic structure plots for TaSe3 and ZrTe3 are shown in Fig. 8. The convergence of the lattice thermal conductivities for different -point grids is shown in Fig. 9.
| Crystal | Remark | ||||||
|---|---|---|---|---|---|---|---|
| TaSe3 | This paper | 10.452 | 3.508 | 9.875 | 90 | 106.36 | 90 |
| Experiment Bjerkelund and Kjekshus (1964, 1965) | 10.411 | 3.494 | 9.836 | 90 | 106.36 | 90 | |
| ZrTe3 | This paper | 5.915 | 3.882 | 10.152 | 90 | 97.94 | 90 |
| Experiment Furuseth and Fjellvag (1991) | 5.895 | 3.926 | 10.104 | 90 | 97.93 | 90 |
| Method | ||||
|---|---|---|---|---|
| TaSe3 | RTA | 0.3718 | 4.0423 | 0.5644 |
| Iterative | 0.3722 | 6.1522 | 0.5643 | |
| ZrTe3 | RTA | 3.6621 | 8.2807 | 2.2823 |
| Iterative | 3.8764 | 9.5748 | 2.3435 |
| coefficient | ||||||
|---|---|---|---|---|---|---|
| TaSe3 | 0.003989 | -0.02828 | -0.003387 | -0.001137 | 0.001768 | |
| 110.4 | 1880. | 171.9 | 243.2 | 39.10 | ||
| ZrTe3 | -0.1578 | -0.1457 | -0.1441 | - | - | |
| 1241 | 2956 | 772.3 | - | - |
References
- Bullett (1979) D. W. Bullett, J. Phys. C: Sol. St. Phys. 12, 277 (1979).
- Srivastava and Avasthi (1992) S. K. Srivastava and B. N. Avasthi, J. Mat. Sci. 27, 3693 (1992).
- Island et al. (2017) J. O. Island, A. J. Molina-Mendoza, M. Barawi, R. Biele, E. Flores, J. M. Clamagirand, J. R. Ares, C. Sánchez, H. S. J. van der Zant, R. D’Agosta, I. J. Ferrer, and A. Castellanos-Gomez, 2D Mater 4, 022003 (2017).
- Furuseth et al. (1975) S. Furuseth, L. Brattas, and A. Kjekshus, Acta Chemica Scandinavica A 29, 623 (1975).
- Endo et al. (1981) K. Endo, H. Ihara, S. Gonda, and K. Watanabe, Physica B+ C 105, 159 (1981).
- Rashid and Sellmyer (1984) M.H. Rashid and D.J. Sellmyer, Physical Review B 29, 2359 (1984).
- Jin et al. (2015) Y. Jin, X. Li, and J. Yang, Phys. Chem. Chem. Phys. 17, 18665 (2015).
- Dai and Zeng (2015) J. Dai and X. C. Zeng, Angew. Chem. Int. Ed. 54, 7572 (2015).
- Island et al. (2016) J. O. Island, R. Biele, M. Barawi, J. M. Clamagirand, J. R. Ares, C. Sánchez, H. S. J. van der Zant, I. J. Ferrer, R. D’Agosta, and A. Castellanos-Gomez, Scientific Reports 6, 22214 (2016).
- Pant et al. (2016) A. Pant, E. Torun, B. Chen, S. Bhat, X. Fan, K. Wu, D. P. Wright, F. M. Peeters, E. Soignard, H. Sahin, et al., Nanoscale 8, 16259 (2016).
- Dai et al. (2016) J. Dai, M. Li, and X. C. Zeng, Wiley Interdisciplinary Reviews: Computational Molecular Science 6, 211 (2016).
- Kong et al. (2017) W. Kong, C. Bacaksiz, B. Chen, K. Wu, M. Blei, X. Fan, Y. Shen, H. Sahin, D. Wright, D. S. Narang, et al., Nanoscale 9, 4175 (2017).
- Sambongi et al. (1977) T. Sambongi, M. Yamamoto, K. Tsutsumi, Y. Shiozaki, K. Yamaya, and Y. Abe, Journal of the Physical Society of Japan 42, 1421 (1977).
- Haen et al. (1978) P. Haen, F. Lapierre, P. Monceau, M. N. nez Regueiro, and J. Richard, Solid State Communications 26, 725 (1978).
- Yamamoto (1978) M. Yamamoto, Journal of the Physical Society of Japan 45, 431 (1978).
- Yamaya et al. (2012) K. Yamaya, S. Takayanagi, and S. Tanda, Phys. Rev. B 85, 184513 (2012).
- Grüner (1988) G. Grüner, Rev. Mod. Phys. 60, 1129 (1988).
- Grüner (1994) G. Grüner, Density Waves in Solids (Perseus Publishing, Boston, 1994).
- Monceau (2012) P. Monceau, Advances in Physics 61, 325 (2012).
- Pokrovskii et al. (2013) V. Y. Pokrovskii, S. G. Zybtsev, M. V. Nikitin, I. G. Gorlova, V. F. Nasretdinova, and S. V. Zaitsev-Zotov, Physics–Uspekhi 56, 29 (2013).
- Fleming et al. (1978) R. M. Fleming, D. E. Moncton, and D. B. McWhan, Phys. Rev. B 18, 5560 (1978).
- Itkis et al. (1990) M. E. Itkis, F. Y. Nad, and P. Monceau, J. Phys.: Condens. Matter 2, 8327 (1990).
- Zybtsev et al. (2017) S. G. Zybtsev, V. Y. Pokrovskii, V. F. Nasretdinova, S. V. Zaitsev-Zotov, V. V. Pavlovskiy, A. B. Odobesco, W. W. Pai, M.-W. Chu, Y. G. Lin, E. Zupanič, H. J. P. van Midden, S. Šturm, E. Tchernychova, A. Prodan, J. C. Bennett, I. R. Mukhamedshin, O. V. Chernysheva, A. P. Menushenkov, V. B. Loginov, B. A. Loginov, A. N. Titov, and M. Abdel-Hafiez, Phys. Rev. B 95, 035110 (2017).
- Zettl and Grüner (1982) A. Zettl and G. Grüner, Physical Review B 26, 2298 (1982).
- Hall et al. (1988) R. P. Hall, M. F. Hundley, and A. Zettl, Phys. Rev. B 38, 13002 (1988).
- Bardeen et al. (1982) J. Bardeen, E. Ben-Jacob, A. Zettl, and G. Grüner, Phys. Rev. Lett. 49, 493 (1982).
- Zettl et al. (1982) A. Zettl, C. M. Jackson, and G. Grüner, Phys. Rev. B 26, 5773 (1982).
- Thorne et al. (1987) R. E. Thorne, W. G. Lyons, J. W. Lyding, J. R. Tucker, and J. Bardeen, Phys. Rev. B 35, 6360 (1987).
- van der Zant et al. (2001a) H. S. J. van der Zant, E. Slot, S. V. Zaitsev-Zotov, and S. N. Artemenko, Phys. Rev. Lett. 87, 126401 (2001a).
- Zybtsev et al. (2009) S. G. Zybtsev, V. Y. Pokrovskii, V. F. Nasretdinova, and S. V. Zaitsev-Zotov, Appl. Phys. Lett. 94, 152112 (2009).
- Zaitsev-Zotov (2004) S. V. Zaitsev-Zotov, Physics Uspekhi 47, 533 (2004).
- McCarten et al. (1992) J. McCarten, D. A. DiCarlo, M. P. Maher, T. L. Adelman, and R. E. Thorne, Phys. Rev. B 46, 4456 (1992).
- van der Zant et al. (1999) H. S. J. van der Zant, A. Kalwij, O. C. Mantel, N. Markovic, Y. I. Latyshev, B. Pannetier, and P. Monceau, J. De Physique IV 9, Pr10-157 (1999).
- van der Zant et al. (2001b) H. S. J. van der Zant, N. Marković, and E. Slot, Physics-Uspekhi) 44, 61 (2001b).
- Slot et al. (2004) E. Slot, H. S. J. van der Zant, K. O’Neill, and R. E. Thorne, Phys. Rev. B 69, 073105 (2004).
- Inagaki et al. (2005) K. Inagaki, T. Toshima, S. Tanda, and K. Yamaya, Appl. Phys. Lett. 86, 073101 (2005).
- Hor et al. (2005) Y. S. Hor, Z. L. Xiao, U. Welp, Y. Ito, J. F. Mitchell, R. E. Cook, W. K. Kwok, and G. W. Crabtree, Nano Letters 5, 397 (2005).
- Zybtsev and Pokrovskii (2011) S. G. Zybtsev and V. Y. Pokrovskii, Phys. Rev. B 84, 085139 (2011).
- (39) S. Bhattacharya, A. N. Bloch, and J. P. Stokes, ‘Frequency Modulator Using Material Having Sliding Charge Density Waves,’ U.S. Patent 4,580,110 (1986).
- Adelman et al. (1995) T. L. Adelman, S. V. Zaitsev-Zotov, and R. E. Thorne, Phys. Rev. Lett. 74, 5264 (1995).
- (41) G. Blumberg and P. B. Littlewood, ‘Electronic devices based on density wave dielectrics,’ U.S. Patent 6,735,073 (2004).
- Mihailovic et al. (2002) D. Mihailovic, D. Dvorsek, V. V. Kabanov, J. Demsar, L. Forró, and H. Berger, Appl. Phys. Lett. 80, 871 (2002).
- Stöwe and Wagner (1998) K. Stöwe and F. R. Wagner, Journal of Solid State Chemistry 138, 160 (1998).
- Seshardi et al. (1998) R. Seshardi, E. Suard, C. Felser, E. W. Finckh, A. Maignan, and W. Tremel, J. Mater. Chem. 8, 2869 (1998).
- Felser et al. (1998) C. Felser, E. W. Finckh, H. Kleinke, F. Rocker, and W. Tremel, J. Mater. Chem. 8, 1787 (1998).
- Yokoya et al. (2005) T. Yokoya, T. Kiss, A. Chainani, S. Shin, and K. Yamaya, Phys. Rev. B 71, 140504(R) (2005).
- Hoesch et al. (2009a) M. Hoesch, A. Bosak, D. Chernyshov, H. Berger, and M. Krisch, Phys. Rev. Lett. 102, 086402 (2009a).
- Hoesch et al. (2009b) M. Hoesch, X. Cui, K. Shimada, C. Battaglia, S.-i. Fujimori, and H. Berger, Phys. Rev. B 80, 075423 (2009b).
- Hu et al. (2015) Y. Hu, F. Zheng, X. Ren, J. Feng, and Y. Li, Phys. Rev. B 91, 144502 (2015).
- Gleason et al. (2015) S. L. Gleason, Y. Gim, T. Byrum, A. Kogar, P. Abbamonte, E. Fradkin, G. J. MacDougall, D. J. Van Harlingen, X. Zhu, C. Petrovic, and S. L. Cooper, Phys. Rev. B 91, 155124 (2015).
- Ganose et al. (2018) A. M. Ganose, L. Gannon, F. Fabrizi, H. Nowell, S. A. Barnett, H. Lei, X. Zhu, C. Petrovic, D. O. Scanlon, and M. Hoesch, Phys. Rev. B 97, 155103 (2018).
- Hoesch et al. (2019) M. Hoesch, L. Gannon, K. Shimada, B. J. Parrett, M. D. Watson, T. K. Kim, X. Zhu, and C. Petrovic, Phys. Rev. Lett. 122, 017601 (2019).
- Yue et al. (2020) L. Yue, S. Xue, J. Li, W. Hu, A. Barbour, F. Zheng, L. Wang, J. Feng, S. B. Wilkins, C. Mazzoli, et al., Nature communications 11, 1 (2020).
- Patra and Rout (2020) A. Patra and C. S. Rout, RSC Adv. 10, 36413 (2020).
- Island et al. (2014) J. O. Island, M. Buscema, M. Barawi, J. M. Clamagirand, J. R. Ares, C. Sánchez, I. J. Ferrer, G. A. Steele, H. S. J. van der Zant, and A. Castellanos-Gomez, Adv. Optical Mater. 2, 641 (2014).
- Island et al. (2015) J. O. Island, M. Barawi, R. Biele, A. Almazán, J. M. Clamagirand, J. R. Ares, C. Sánchez, H. S. J. van der Zant, J. V. Álvarez, R. D’Agosta, I. J. Ferrer, and A. Castellanos-Gomez, Advanced Materials 27, 2595 (2015).
- Lipatov et al. (2015) A. Lipatov, P. M. Wilson, M. Shekhirev, J. D. Teeter, R. Netusil, and A. Sinitskii, Nanoscale 7, 12291 (2015).
- Gilbert et al. (2019) S. J. Gilbert, A. Lipatov, A. J. Yost, M. J. Loes, A. Sinitskii, and P. A. Dowben, Appl. Phys. Lett. 114, 101604 (2019).
- Randle et al. (2019) M. Randle, A. Lipatov, A. Kumar, C.-P. Kwan, J. Nathawat, B. Barut, S. Yin, K. He, N. Arabchigavkani, R. Dixit, T. Komesu, J. Avila, M. C. Asensio, P. A. Dowben, A. Sinitskii, U. Singisetti, and J. P. Bird, ACS Nano 13, 803 (2019).
- Papadopoulos et al. (2019) N. Papadopoulos, E. Flores, K. Watanabe, T. Taniguchi, J. R. Ares, C. Sanchez, I. J. Ferrer, A. Castellanos-Gomez, G. A. Steele, and H. S. J. van der Zant, 2D Materials 7, 015009 (2019).
- Abdulsalam and Joubert (2015) M. Abdulsalam and D. P. Joubert, Eur. Phys. J. B 88, 177 (2015).
- Zhang et al. (2016) E. Zhang, P. Wang, Z. Li, H. Wang, C. Song, C. Huang, Z.-G. Chen, L. Yang, K. Zhang, S. Lu, et al., ACS nano 10, 8067 (2016).
- Yuan et al. (2015) H. Yuan, X. Liu, F. Afshinmanesh, W. Li, G. Xu, J. Sun, B. Lian, A. G. Curto, G. Ye, Y. Hikita, et al., Nature nanotechnology 10, 707 (2015).
- Stolyarov et al. (2016) M. A. Stolyarov, G. Liu, M. A. Bloodgood, E. Aytan, C. Jiang, R. Samnakay, T. T. Salguero, D. L. Nika, S. L. Rumyantsev, M. S. Shur, K. N. Bozhilov, and A. A. Balandin, Nanoscale 8, 15774 (2016).
- Geremew et al. (2018) A. Geremew, M. Bloodgood, E. Aytan, B. Woo, S. Corber, G. Liu, K. Bozhilov, T. Salguero, S. Rumyantsev, M. Rao, et al., IEEE Electron Device Letters 39, 735 (2018).
- Empante et al. (2019) T. A. Empante, A. Martinez, M. Wurch, Y. Zhu, A. K. Geremew, K. Yamaguchi, M. Isarraraz, S. Rumyantsev, E. J. Reed, A. A. Balandin, and L. Bartels, Nano Letters 19, 4355 (2019).
- Dresselhaus et al. (1999) M. Dresselhaus, G. Dresselhaus, X. Sun, Z. Zhang, S. Cronin, and T. Koga, Physics of the Solid State 41, 679 (1999).
- Zhou et al. (2018) Z. Zhou, H. Liu, D. Fan, G. Gao, and C. Sheng, ACS Appl. Mater. Interfaces 10, 37031 (2018).
- Hooda et al. (2019) M. Hooda, T. Tripathi, and C. Yadav, Journal of Alloys and Compounds 785, 603 (2019).
- Liu et al. (2020) H. Liu, X. Yu, K. Wu, Y. Gao, S. Tongay, A. Javey, L. Chen, J. Hong, and J. Wu, Nano Letters 20, 5221 (2020).
- Wieting et al. (1982) T. Wieting, A. Grisel, and F. Levy, Molecular Crystals and Liquid Crystals 81, 117 (1982).
- Zwick et al. (1980) A. Zwick, M. A. Renucci, and A. Kjekshus, Journal of Physics C: Solid State Physics 13, 5603 (1980).
- Bjerkelund and Kjekshus (1965) E. Bjerkelund and A. Kjekshus, Acta Chem. Scared 19, 11 (1965).
- Nakajima et al. (1986) H. Nakajima, K. Nomura, and T. Sambongi, Physica B+C 143, 240 (1986).
- Takahashi et al. (1984) S. Takahashi, T. Sambongi, J. Brill, and W. Roark, Solid state communications 49, 1031 (1984).
- Yamaya and Oomi (1982) K. Yamaya and G. Oomi, J. Phys. Soc. Jap. 51, 3512 (1982).
- Blöchl (1994) P. E. Blöchl, Phys. Rev. B 50, 17953 (1994).
- Perdew et al. (1996) J. P. Perdew, K. Burke, and M. Ernzerhof, Phys. Rev. Lett. 77, 3865 (1996).
- Kresse and Hafner (1993) G. Kresse and J. Hafner, Phys. Rev. B 48, 13115 (1993).
- Kresse and Furthmüller (1996) G. Kresse and J. Furthmüller, Computational Materials Science 6, 15 (1996).
- Grimme (2006) S. Grimme, Journal of computational chemistry 27, 1787 (2006).
- Togo et al. (2008) A. Togo, F. Oba, and I. Tanaka, Phys. Rev. B 78, 134106 (2008).
- Togo and Tanaka (2015) A. Togo and I. Tanaka, Scr. Mater. 108, 1 (2015).
- Li et al. (2014a) W. Li, J. Carrete, N. A. Katcho, and N. Mingo, Computer Physics Communications 185, 1747 (2014a).
- Li and Mingo (2015) W. Li and N. Mingo, Physical Review B 91, 144304 (2015).
- Li et al. (2012) W. Li, N. Mingo, L. Lindsay, D. A. Broido, D. A. Stewart, and N. A. Katcho, Phys. Rev. B 85, 195436 (2012).
- Wieting et al. (1979) T. J. Wieting, A. Grisel, F. Lévy, and P. Schmid, “Phonon studies of chemical bonding in the IVB and VB trichalcogenides,” in Lecture Notes in Physics, Quasi One-Dimensional Conductors I, Vol. 95 (Springer-Verlag, Berlin, 1979) pp. 354–358.
- Zawilski et al. (2010) B. Zawilski, R. L. IV, N. Lowhorn, and T. Tritt, Solid State Communications 150, 1299 (2010).
- Yao et al. (2017) M. Yao, M. Zebarjadi, and C. P. Opeil, Journal of Applied Physics 122, 135111 (2017).
- Zawilski et al. (2001) B. M. Zawilski, R. T. Littleton, and T. M. Tritt, Review of Scientific Instruments 72, 1770 (2001).
- Lindsay et al. (2013) L. Lindsay, D.A. Broido, and T.L. Reinecke, Physical Review B 88, 144306 (2013).
- Kumar et al. (1993) G. S. Kumar, G. Prasad, and R. O. Pohl, J. Mat. Sci. 28, 4261 (1993).
- Wang et al. (2017) H. Wang, Y. Gao, and G. Liu, RSC Adv. 7, 8098 (2017).
- Li et al. (2014b) H. Li, H. Ying, X. Chen, D. L. Nika, A. I. Cocemasov, W. Cai, A. A. Balandin, and S. Chen, Nanoscale 6, 13402 (2014b).
- Towns et al. (2014) J. Towns, T. Cockerill, M. Dahan, I. Foster, K. Gaither, A. Grimshaw, V. Hazlewood, S. Lathrop, D. Lifka, G. D. Peterson, et al., Computing in Science & Engineering 16, 62 (2014).
- Bjerkelund and Kjekshus (1964) E. Bjerkelund and A. Kjekshus, Zeitschrift für Anorganische und Allgemeine Chemie 328, 235 (1964).
- Furuseth and Fjellvag (1991) H. Furuseth and S. Fjellvag, Acta Chem. Scandin 45, 694 (1991).
- Brill et al. (1981) J. Brill, C. Tzou, G. Verma, and N. Ong, Solid State Communications 39, 233 (1981).
- Smontara and Biljakovic (1985) A. Smontara and K. Biljakovic, Molecular Crystals and Liquid Crystals 121, 141 (1985).
- Zhu et al. (2018) J. Zhu, T. Feng, S. Mills, P. Wang, X. Wu, L. Zhang, S. T. Pantelides, X. Du, and X. Wang, ACS Applied Materials & Interfaces 10, 40740 (2018).
- Hooda and Yadav (2017) M. K. Hooda and C. S. Yadav, Applied Physics Letters 111, 053902 (2017).
- Yumnam et al. (2015) G. Yumnam, T. Pandey, and A. K. Singh, The Journal of Chemical Physics 143, 234704 (2015).
- Kim et al. (2010) J.-Y. Kim, S. M. Choi, W.-S. Seo, and W.-S. Cho, Bulletin of the Korean Chemical Society 31, 3225 (2010).
- Brixner (1962) L. Brixner, Journal of Inorganic and Nuclear Chemistry 24, 257 (1962).
- Nishio (1994) Y. Nishio, Journal of the Physical Society of Japan 63, 223 (1994).
- Núñnez-Regueiro et al. (1985) M. D. Núñnez-Regueiro, J. M. Lopez-Castillo, and C. Ayache, Phys. Rev. Lett. 55, 1931 (1985).
- Yan et al. (2013) Z. Yan, C. Jiang, T. R. Pope, C. F. Tsang, J. L. Stickney, P. Goli, J. Renteria, T. T. Salguero, and A. A. Balandin, Journal of Applied Physics 114, 204301 (2013).
- Imai et al. (2001) H. Imai, Y. Shimakawa, and Y. Kubo, Physical Review B 64, 241104(R) (2001).