Action Sequence Augmentation for
Early Graph-based Anomaly Detection
Abstract.
The proliferation of web platforms has created incentives for online abuse. Many graph-based anomaly detection techniques are proposed to identify the suspicious accounts and behaviors. However, most of them detect the anomalies once the users have performed many such behaviors. Their performance is substantially hindered when the users’ observed data is limited at an early stage, which needs to be improved to minimize financial loss. In this work, we propose Eland, a novel framework that uses action sequence augmentation for early anomaly detection. Eland utilizes a sequence predictor to predict next actions of every user and exploits the mutual enhancement between action sequence augmentation and user-action graph anomaly detection. Experiments on three real-world datasets show that Eland improves the performance of a variety of graph-based anomaly detection methods. With Eland, anomaly detection performance at an earlier stage is better than non-augmented methods that need significantly more observed data by up to 15% on the Area under the ROC curve.
1. Introduction
Social networks and review platforms indirectly create a market for malicious incentives, enabling malicious users to make huge profits via suspicious behaviors, e.g., fake reviews, hijacking trending topics. Such behaviors have severe negative impact on our society. User behavior data plays an essential role in the detection of malicious users. In the databases, each user creates a sequence of actions like giving a review to a particular item. In order to leverage the homophily of users, a great line of research work has been done to construct a user-item bipartite weighted graph and develop graph-based anomaly detection algorithms such as graph embeddings and graph neural networks. The weight is for the frequency of behaviors that associate the user and item in his/her action sequence. For example, Kumar et al. (2018) created a “user-reviewed-product” graph from each Amazon user’s sequence of reviews; Rayana and Akoglu (2015) built “user-reviewed-restaurants/hotels” graphs from Yelp users’ reviewing behaviors; Zhao et al. (2020) studied a “user-posted-message” graph from posting behaviors on social media.
Most of the existing work focuses on detecting anomalous users reactively, i.e., when their malicious behaviors have already affected many people (Shu et al., 2020). For example, a hijacked topic might have been on the trending list on Twitter for hours, and millions of users already saw and believed it; fake reviews on Yelp could have already damaged a restaurant’s reputation. Therefore, we argue that anomaly detection would be much more useful when it could be done early, or proactively to stop the malicious users before they achieve their targets. In this work, we study the problem of early graph-based anomaly detection when the observed behavior data is limited.
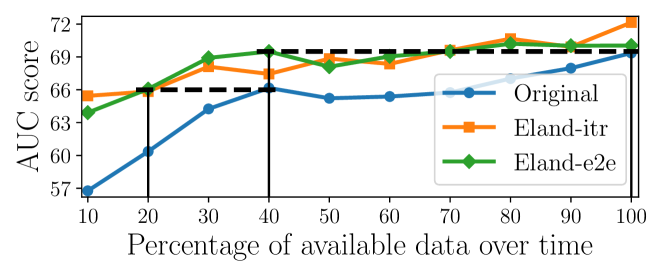
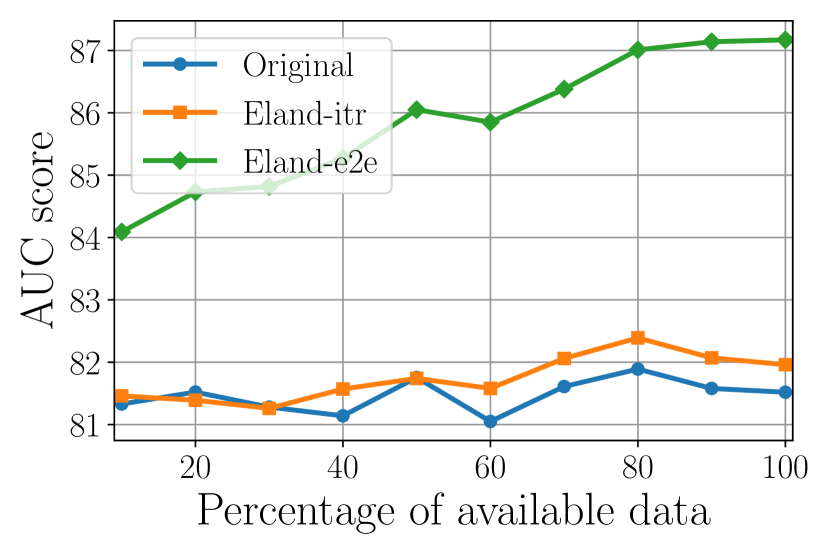
Performing anomaly detection at an early stage is challenging due to the scarcity of available observations. Despite the technical advances of existing graph anomaly detection methods, we still witness substantially reduced performance in such settings where data is insufficient or incomplete. Empirically, we observe that state-of-the-art anomaly detection methods such as Dominant (Ding et al., 2019b) would have a relative decrease of 15% on Area under the ROC curve (AUC) when only the earliest 20% of the data (for each user) is available (see the blue curve in Figure 1). Similar degradations occur on a few other types of graph learning methods such as HetGNN (Zhang et al., 2019) and DeepAE (Zhu et al., 2020) (Figure 3), leading us to ask: can we improve the performance at an early stage, when data is scarce?
Our idea is to learn and predict actions to augment the data at the early stage, and hence boost the performance of anomaly detection by “forecasting the future.” Although one anomalous user might not have sufficient behaviors to be detected, detection methods could still identify him with high confidence if his likely future behaviors are provided. That is, we predict the users’ future behaviors by finding patterns from the entire data and prolonging their action sequence with the items that they may adopt in the future. With the predicted actions of a large number of users, the user-item (bipartite weighted) graph can be augmented to contain much richer information than before, thus enabling the detection methods to more accurately detect anomalies from the graph data.
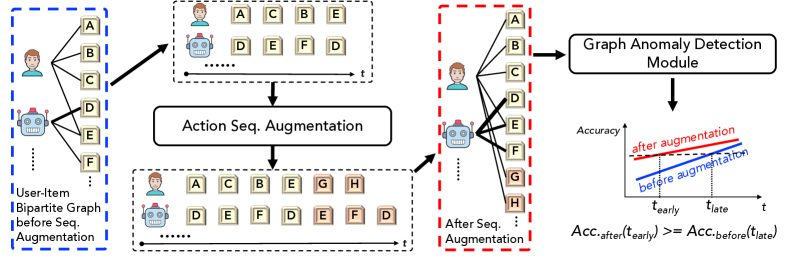
Present work. We propose Eland (Early Anomaly Detection), a novel framework that achieves effective early graph anomaly detection via action sequence augmentation. Eland has two components: (1) a sequence augmentation module that predicts the user actions and augments the graph data and (2) an anomaly detection module that detects anomalous users from graph data. We present two methods to train the proposed framework: (1) Eland-itr where the two components are inter-dependent on each other and hence trained iteratively in a bootstrapping style, and (2) Eland-e2e where we jointly train the two modules as an end-to-end model. Shown in Figure 2 is the illustration of the framework. The framework enables us to take advantage of the patterns of benign and malicious users discovered by the detection module to enhance the augmentation module, and vice versa.
Figure 1 shows that (1) our Eland (green and orange curves) that uses the users’ earliest 20% data can achieve the same performance as the original method (blue curve) that uses the earliest 40%, and (2) Eland that uses 40% data can achieve the performance of the original method with full data (100%). Such observations indicate that Eland could save half the time to collect users’ data for accurate anomaly detection.
The contributions of this work are summarized as follows:
-
•
We propose a novel idea that is to achieve early-stage graph anomaly detection by action sequence augmentation. Considering behavior data as sequences, we employ sequence prediction models (e.g., Seq2Seq) to forecast the behaviors.
-
•
We design a novel framework, Eland, consisting of two components, action sequence augmentation and augmented graph anomaly detection to achieve early anomaly detection.
-
•
We conduct extensive experiments on three real-world datasets. Eland achieves better performance on both unsupervised and supervised anomaly detection methods given less (earlier) data, with up to 15% improvement on AUC score.
2. Related work
In this section we discuss three topics related to our work.
Graph Anomaly Detection has received a great amount of academic interest in the past decade (Ding et al., 2019a; Akoglu et al., 2015; Zhao et al., 2018, 2020, 2021a). Several methods (Kumar et al., 2018; Rayana and Akoglu, 2015; Eswaran et al., 2018; Ting et al., 2020) were proposed following the graph outlier detection strategy. Similar approaches have been developed for bipartite graphs. With the recent advances of graph neural networks (GNN), several GNN-based anomaly detection methods (Ding et al., 2021; Wang et al., 2019; Pang et al., 2019; Dou et al., 2020; Li et al., 2019) were proposed. Dominant (Ding et al., 2019b) was an unsupervised attributed graph auto-encoder that detects anomalous nodes. Zhang et al. (2020) proposed multi-task GCN-based model that unified recommendation and anomaly detection. DeepAE (Zhu et al., 2020) was an unsupervised graph auto-encoder-based method that detects anomalies by preserving multi-order proximity. Zhao et al. (2020, 2021a) proposed an unsupervised loss function that trains GNN to learn user representations tailored for anomaly detection.
Sequence Prediction. Sequential data prediction is a key problem in machine learning. For example, text generation aims to predict the next word on the given context (Cho et al., 2014); action prediction in computer vision aims to infer next action in video data (Kong et al., 2017; Liu et al., 2018). Recurrent neural networks (RNN) have enjoyed considerable success in various sequence prediction tasks for understanding dynamical structure of data and producing accurate prediction. Transformer models eschew recurrence and instead rely on the stacked multi-head self-attention to draw global dependencies between input tokens (Vaswani et al., 2017). Recent work in recommender systems used sequence prediction to address the cold-start problem (Rama et al., 2019) besides many that created new graph neural models (Liu et al., 2020; Dong et al., 2020) which ignore the sequential patterns in users’ actions. In our work, we focus on graph-based anomaly detection – we predict the future actions to augment the user’s action sequence, and exploit the mutual enhancement of sequence augmentation and graph anomaly detection.
Graph Neural Networks. As spectral GNNs generally operate on the full adjacency (Defferrard et al., 2016; Kipf and Welling, 2016; Ma et al., 2020b), spatial-based methods which perform graph convolution with neighborhood aggregation became prominent (Hamilton et al., 2017; Veličković et al., 2017; Gao et al., 2018; Guo et al., 2021; Zhao et al., 2021c), owing to their scalability and flexibility (Ying et al., 2018). More recently, dynamic graph learning methods (Manessi et al., 2020; Ma et al., 2020a) have proposed combining GNNs with RNNs to learn on dynamic graphs. GCRN (Seo et al., 2018) proposed a modified RNN by replacing fully connected layers with GCN layers (Kipf and Welling, 2016). EvolveGCN (Pareja et al., 2020) proposed to use GRU to learn the parameter changes in GCN instead of node representation changes. JODIE (Kumar et al., 2019) proposed a user-item interaction prediction method based on historical interactions. Such works have also been applied to large-scale industrial problems (Tang et al., 2020; Sankar et al., 2021).
3. Problem Definition
Consider a bipartite graph at timestamp , where is the set of users, is the set of items and is the set of edges. Let be the adjacency matrix. Let and be the user feature matrix and item feature matrix, where and are the dimensions of raw features. As the feature dimensions of users and items are usually the same or can be projected to the same space via linear transformation, we use to denote the vertically concatenated feature matrix of and . Let the action sequence for each user be , in which is the length of ’s action sequence and each item stands for the feature vector of the corresponding item node. More actions between the same user-item pair result in with edges with higher weight. We also denote as labels for users where anomalies get and others get . We follow the widely accepted definition of anomalous users in web graphs by previous works (Jiang et al., 2016; Kumar et al., 2018; Zhao et al., 2020, 2021a). For example, the anomalous user accounts in social networks are the botnets or the ones that frequently post advertisements or malicious links.
Following the above notations and definitions, we define the task of early-stage graph-based anomaly detection. Let be a (supervised or unsupervised) graph anomaly detection method that returns a vector of prediction logits . Let be a later time when the observed data is “sufficient” for existing graph anomaly detection methods to perform well. We aim to design a framework that can achieve comparable or better performance at an earlier time when observations were “incomplete.”111Although we consider the terms “sufficient” and “incomplete” relatively for discussion, they can easily be made rigorous via practical constraints. Formally, our goal is to find a data augmentation framework satisfying the following criteria:
Definition 0.
(Early-stage Graph Anomaly Detection) Let be an evaluation metric (e.g., f-measure) such that a larger value is more desirable holding other conditions the same. Let be an anomaly detection method. Design an augmenter function that satisfies . When assuming performance to increase monotonically with data, the above criteria is also equivalent to
| (1) |
where and are the adjacency matrices at earlier time and later time , respectively.
When applying graph anomaly detection methods on real-world data, which usually has high complexity and uncertainty (and adversariality), it is difficult to theoretically guarantee that performance would monotonically increase with data. In the following two sections, we first introduce our proposed framework Eland which approximates , and show that Eland empirically satisfies the above desired property across choices of , , and .
4. The Eland Frameworks
In this section, we first present the two major components of our proposed framework, Eland. Then we introduce two ways of training Eland: a bootstrapping-style iterative training Eland-itr that can be used on any existing graph anomaly detection methods; and Eland-e2e that trains both modules together in an end-to-end fashion.
4.1. Graph Anomaly Detection Module
The first component of our proposed Eland framework is a graph anomaly detection module (). Notably, this part of Eland is general and model-agnostic, in the sense that any anomaly detection or node classification model (e.g., Dominant (Ding et al., 2019b), DeepAE (Zhu et al., 2020), GCN (Kipf and Welling, 2016)) suffices and can be used. Without loss of generality, let the anomaly detection model be defined as:
| (2) |
where is the predicted suspiciousness of the user nodes of being anomalies, and denotes trainable parameters. During training, if is unsupervised method (e.g., Dominant (Ding et al., 2019b)), its own training objective is used; if is supervised method (e.g., GCN (Kipf and Welling, 2016)), we use a standard binary cross-entropy loss.
Neural-based graph representation learning methods (e.g., graph neural networks) are capable of learning low-dimensional node representations as well as making predictions. We take advantage of the learned representations of user nodes. Without loss of generality, here we take the widely used Graph Convolutional Network (GCN) (Kipf and Welling, 2016) as an example of the anomaly detection method. The graph convolution operation of each GCN layer is defined as:
| (3) |
where indicates the layer, is the node embedding matrix generated by -th layer, is the weight matrix of the -th layer, is the adjacency matrix with added self-loops, is the diagonal degree matrix , and denotes a nonlinear activation such as the Rectified Linear Unit (ReLU).
4.2. Action Sequence Augmentation Module
The action sequence augmentation module takes user action sequences as input and outputs the predicted next items that each user is likely to adopt in the future. These predicted actions are then added back to the “user-adopts-item” graph and forms the augmented graph. The main component of this module is a Seq2Seq encoder-decoder network (Sutskever et al., 2014), which is robust to model choice and can be any state-of-the-art Seq2Seq model (e.g., GRU (Cho et al., 2014), Transformer (Vaswani et al., 2017), LSTM (Hochreiter and Schmidhuber, 1997)).
The action sequence augmentation module is designed to capture behavior patterns from the sequential data (i.e., item adoption history) and use them for graph augmentation. In general, it takes the following functional form:
| (5) |
where stands for the adjacency matrix with augmented predicted behaviors, is the original adjacency matrix, is the feature matrix, is the predicted user suspiciousness by or , and stands for the trainable parameter.
Sequence prediction. Here we regard each user’s action sequence as a sequence of features that are constructed as prior knowledge. For example, for content-based item (e.g., reviews), the features can be the embedded representations of the texts. For each user ’s action sequence , if a GNN-based anomaly detection module that learns node representation is used, say for user , then the action sequence is represented as , where stands for vector concatenation.
We opt for simplicity and adopt a GRU model to capture contextualized representations of each action in the sequence and make predictions. Hence, the hidden state of each action by user is:
| (6) |
where refers to the hidden state in the -th step. Moreover, we use a linear readout function to predict of the next action by
| (7) |
where , are trainable parameters and is the predicted feature vector for user ’s next action. The decoder can also predict multiple sequential actions.
Sequence Augmentation. Finally, we augment the graph by explicitly predicting the future items for users and adding the predicted behaviors as edges into the graph. When is predicted by Eq.(7), the next input item is determined by cosine similarity:
| (8) |
where is the item feature matrix serving as the vocabulary. Let be the corresponding item to feature . For each user , the decoder predicts the next future actions . Thereby, the augmented adjacency matrix can be calculated via
| (9) |
where is an empty matrix except .
We next discuss two strategies for training Eland.
4.3. Eland-itr: an Iterative Approach
The graph anomaly detection module benefits from the enriched graph structure generated by the action sequence augmentation, and the augmentation module benefits from the detection module. Both modules are interdependent and mutually enhance each other. Hence, we can use a bootstrapping training strategy to iteratively train both modules and jointly optimize their performances.
Algorithm 1 shows the process of Eland-itr. We start with the anomaly detection module on the original graph. If the anomaly detection module is GNN-based, the features are updated by concatenating the learned node representations with the original node features. Then each iteration proceeds as follows: (1) we train a new action sequence augmentation module with the graph and the results given by the detection module or , (2) we train and make inference with a new initialized graph anomaly detection module on the updated graph structure . After multiple iterations, the final prediction result is reported.
During the inference stage, we utilize the predicted suspiciousness scores for each user given by the anomaly detection module to decide the number of predictions we make for user :
| (10) |
where is a hyperparameter to control the maximum number of predictions. The intuition is that anomalous users tend to perform more actions to achieve their goal (e.g., fake trending topic boosting), so we generate more predicted items for the users that are more likely to be anomalies, via the anomaly detection module.
Training Eland-itr. If is unsupervised, it is trained with its own objectives. If supervised, the graph anomaly detection module is trained with the standard binary cross entropy:
| (11) |
The action sequence augmentation module is trained with the following loss function which maximizes the cosine similarity between the predicted actions and the actual actions.
| (12) |
During the training of Eland-itr, the two modules ( and ) are trained with the corresponding loss independently and iteratively.
4.4. Eland-e2e: an End-to-End Approach
In addition to Eland-itr, we propose an end-to-end model Eland-e2e that does not require the iterative training process. Hence, it avoids the potential error propagation issue in bootstrapping.
The anomaly detection module in Eland-e2e is a neural model that allows training with back-propagation in order to be trained together with the rest of the model. Thus, we use GNN-based models (e.g. Dominant (Ding et al., 2019b)) for the detection module. As Eland-e2e is end-to-end and trained as a whole and the action sequence augmentation module is executed prior to the graph anomaly detection module, the augmentation module should no longer require as input anymore. The module can then be defined as
| (13) |
When augmenting the graph with , instead of discretely predicting the next items as in Eq. (8), we predict the following items via sampling. For each prediction of each user , we use the cosine similarity of the predictions and apply the Gumbel-Softmax with reparameterization trick (Eric Jang, 2016; Maddison et al., 2017) to sample from by:
| (14) |
where is a random variate sampled from the Gumbel distribution and is a temperature hyperparameter controlling the distribution of the results. Smaller results in more difference between classes. We then discretize into one-hot vectors and add it into the adjacency matrix without damaging sparsity.
As no longer takes as input, we use preferential attachment to calculate the number of predictions for Eland-e2e. Zang et al. (Zang et al., 2019) showed that the dynamics of a random variable of exponential distribution is proportional to (i.e. ). Since user behavior patterns are generally considered to be consistent, it is reasonable to assume that the item selection process follows a Poisson process, whose frequency distribution could be further generalized to an exponential distribution (Cooper, 2005). Therefore, the number of predictions for user ’s actions can be calculated using preferential attachment:
| (15) |
where is ’s degree, is the sum of all users’ degree, and is a hyperparameter that controls the total number of actions to augment the graph. actions will be predicted for , taking the current distribution of actions into consideration.
Training Eland-e2e. Depending on the graph anomaly detection module, its loss function can either be custom tailored (unsupervised) or a standard binary cross entropy loss (supervised) as defined in Eq.(11). A cosine similarity loss as defined in Eq.(12) is still used to train the augmentation module. Thus Eland-e2e is trained with a multi-task loss, defined as
| (16) |
Algorithm 2 shows the process of Eland-e2e. In each epoch, the graph structure is augmented by the output from the action sequence augmentation module with the Gumbel-Softmax trick. We use the Straight-Through gradient estimator (Eric Jang, 2016), passing gradients directly through un-discretized probabilities to train. The GNN-based anomaly detection module uses the augmented graph to predict labels . The multi-task loss defined by Eq.(16) is used to supervise the whole framework.
Weibo Amazon Reddit # Users 40,235 3,024 6,000 # Items 5,284 9,355 2,943 # Edges 55,624 2,434,019 79,210 # Actions 75,285 15,822,365 604,919 % Anomaly users 8.2% 20.2% 13.9%
5. Experiments
In this section, we evaluate the performance of proposed Eland-itr and Eland-e2e. Our implementation is made publicly available222https://github.com/DM2-ND/Eland.
5.1. Experimental Setup
5.1.1. Datasets
We evaluate with three real-world datasets across different domains. Weibo is a micro-blogging dataset (Jiang et al., 2016). We build “user-(re)posted-microblog” graph where the user nodes are registered users and item nodes are micro-blog posts. An action between a users and an item indicates that the user posted the item. The original dataset (Jiang et al., 2016; Zhao et al., 2020) contains public user profiles, (re)posting of micro-blogs, and text of all micro-blogs. As the dataset is a micro-blogging graph, we define the anomalous users in this dataset as the social-spam users accounts which continuously post advertisements or malicious links (Zhao et al., 2020). Due to the large scale (40K+ users), the dataset does not have manually annotated golden labels. So we labelled the users by their post text, profile information, and their behavior time following previous works (Jiang et al., 2016; Zhao et al., 2020). Specifically, we use the following criteria to label anomalies: (1) Social spambot accounts: The major conspicuous characteristic of suspicious users is their bot-controlled behavior. As we observed, most suspicious users posted in a fixed set of time intervals. For example, a user is identified as an anomaly if more than 2/3 of the time intervals of his posts are within seconds. (2) Accounts with suspicious posts: We checked the post text and spotted the accounts whose posts are mostly advertisements or content with malicious links. We follow the train/validation/test split in previous works (Zhao et al., 2020) where we randomly pick 5000 users as training set, 5000 users as validation set, and the rest users as testing set.
Amazon Reviews is a review dataset from Amazon (McAuley and Leskovec, 2013). We build “user-used-word” graph where user nodes are amazon users and item nodes are words with polarity bias from Hedonometer’s word list (Dodds et al., 2015). An action between a user and an item indicates that the user used that word in a review. The original dataset (McAuley and Leskovec, 2013) contains reviews on Amazon under the directory of Video Games. Following previous works (Zhang et al., 2020; Kumar et al., 2018), ground truth is is defined using helpfulness votes, which is indicative of malicious (Kumar et al., 2018) behavior. Users with at least 50 votes are labeled benign if the fraction of helpful-to-total votes is 0.75, and fraudulent if 0.25. We randomly split the users in to train/validation/test sets with the ratio of 20%/20%/60%.
Reddit is a forum dataset (Baumgartner et al., 2020). We build “user-commented-subreddit” graph where user nodes are reddit users and item nodes are subreddits. An action between a user and an item indicates that the user commented under that subreddit. Due to the huge size of the original dataset (Baumgartner et al., 2020) which contains entire public Reddit comments since 2005, we used the part of data from September 2019. As the dataset gives an score for each comment (# of up votes minus # of down votes), we label the users according similar rules for labeling of the Amazon dataset (Zhang et al., 2020; Kumar et al., 2018). We selected users who received at least 10 scores with absolute value (indicating at least 100 votes). Users are benign if all scores he/she received are positive; users are anomaly if of the scores he/she receive are . We randomly split the users in to train/validation/test sets with the ratio of 20%/20%/60%.
For all datasets, more actions between the same user and item would result in an edge with higher weight. Statistics for the datasets are shown in Table 1.
Anomaly detection Method Weibo Amazon Reviews Reddit module AUC AP AUC AP AUC AP RNNfd (Branco et al., 2020) 54.520.12 17.440.10 60.220.29 28.610.11 66.080.36 26.450.83 Grand (Feng et al., 2020) 82.582.11 40.122.99 81.712.56 57.662.98 79.090.18 42.370.72 GCN (Kipf and Welling, 2016) Original 81.780.78 41.211.36 80.280.09 57.730.21 78.010.71 41.210.69 +JODIE (Kumar et al., 2019) 67.801.30 17.122.72 – – 73.122.13 31.623.98 +GAug (Zhao et al., 2021b) 82.040.40 48.170.59 81.910.02 60.120.15 78.780.07 40.740.72 +Eland-itr 82.760.71 48.511.06 80.850.67 58.140.39 78.940.83 43.111.22 +Eland-e2e 84.140.50 54.150.83 85.540.46 65.480.14 79.580.38 44.600.43 GraphSAGE (Hamilton et al., 2017) Original 81.870.56 45.262.54 78.670.09 58.000.07 81.060.02 47.710.01 +JODIE (Kumar et al., 2019) 69.440.95 16.012.09 – – 74.660.09 34.700.06 +GAug (Zhao et al., 2021b) 82.100.46 47.811.29 80.790.02 56.380.03 81.370.01 43.830.01 +Eland-itr 82.340.50 48.400.91 81.590.23 59.910.12 81.620.10 48.250.11 +Eland-e2e 83.410.37 50.610.93 79.920.19 58.210.31 79.830.02 44.380.02 HetGNN (Zhang et al., 2019) Original 81.330.43 39.661.48 86.240.13 67.980.25 91.510.13 67.510.17 +JODIE (Kumar et al., 2019) 68.990.44 17.381.87 – – 92.020.36 68.160.30 +GAug (Zhao et al., 2021b) 82.090.21 47.050.51 87.260.12 71.760.33 91.990.02 66.300.25 +Eland-itr 81.460.57 40.201.19 90.580.86 75.080.57 92.440.07 69.310.29 +Eland-e2e 84.090.55 54.071.64 87.570.26 68.460.35 84.240.22 55.340.88
Anomaly detection Method Weibo Reddit module AUC AP AUC AP Dominant (Ding et al., 2019b) (Unsupervised) Original 56.771.96 13.731.22 61.230.35 18.300.21 +JODIE (Kumar et al., 2019) 58.180.77 11.090.13 61.640.09 18.810.06 +GAug (Zhao et al., 2021b) 61.221.86 14.152.38 62.262.70 17.091.39 +Eland-itr 65.441.78 19.421.29 62.960.10 18.900.04 +Eland-e2e 63.910.92 21.900.87 61.730.27 18.910.14 DeepAE (Zhu et al., 2020) (Unsupervised) Original 56.102.01 12.651.31 61.940.39 18.290.13 +JODIE (Kumar et al., 2019) 57.740.87 11.160.73 61.570.32 18.930.06 +GAug (Zhao et al., 2021b) 61.182.03 11.581.27 61.290.82 18.230.53 +Eland-itr 63.340.82 15.880.73 62.870.37 19.020.11 +Eland-e2e 62.803.60 16.993.87 62.470.11 18.880.04
5.1.2. Baselines
We evaluate Eland with the following methods as module:
- •
-
•
GraphSAGE (Hamilton et al., 2017): An inductive graph neural network that can also be used for supervised node classification.
-
•
HetGNN (Zhang et al., 2019): A supervised graph neural network that handles the heterogeneous graphs of multiple types of nodes.
-
•
Dominant (Ding et al., 2019b): An unsupervised graph anomaly detection method designed based on graph auto-encoder.
-
•
DeepAE (Zhu et al., 2020): An unsupervised graph anomaly detection method with multi-order proximity preservation.
Moreover, we compare Eland with the following baseline methods:
-
•
RNNfd (Branco et al., 2020): A RNN-based model for fraud detection on sequential data in industry applications.
-
•
Grand (Feng et al., 2020): A GNN-based model that leverages graph data augmentation to regularize the optimization process.
-
•
JODIE (Kumar et al., 2019): A bipartite graph interaction prediction method by dynamic embedding trajectory learning.
-
•
GAug (Zhao et al., 2021b): A graph data augmentation method designed for semi-supervised node classification with GNNs.
As JODIE (Kumar et al., 2019) and GAug (Zhao et al., 2021b) can be considered as model-agnostic graph data augmentation methods, we also report their performance across different modules.
5.1.3. Implementation Details
All experiments were conducted on Linux servers with Intel Xeon Gold 6130 Processor (16 Cores @2.1Ghz), 96 GB of RAM, and 4 NVIDIA Tesla V100 cards (32 GB of RAM each) or RTX 2080Ti cards (11 GB of RAM each).
For all methods, we used hidden dimension of 128 and Adam optimizer. All methods have weight decay of . For GraphSAGE, we use the mean aggregator. To make fair comparisons, these aforementioned parameters are fixed for all experiments. For GAug (Zhao et al., 2021b), we used the variant of GAugM because GAugO gets CUDA out of memory error on our datasets. We used the official implementation from the authors for Grand (Feng et al., 2020), JODIE (Kumar et al., 2019), and GAug (Zhao et al., 2021b). We report the average and standard deviation of all performances in 20 runs with random parameter initialization.
Eland-itr: is selected w.r.t. the average length of action sequences in each dataset. For Weibo and Reddit datasets, ; for Amazon Reviews dataset, .
Eland-e2e: As Eland-e2e is more robust to , we opt for simplicity and use for all datasets. During the training of Eland-e2e, we linearly anneal the temperature of Gumbel-softmax distribution throughout the all training iterations, from (a very flat distribution) to (a very peaked distribution).
5.2. Experimental Results
Table 2 and 3 report the performance of our proposed Eland and baseline methods over supervised learning and unsupervised learning methods, respectively. These tables are organized per anomaly detection algorithm (row), per dataset (column), and per augmentation method (within-row). We report AUC and Average Precision (AP). Note that results of JODIE (Kumar et al., 2019) on Amazon are missing due to CUDA out of memory when running the code from authors on V100 GPU with 32GB RAM.
5.2.1. Enhancing graph anomaly detection methods
Table 2 shows that Eland achieves improvements over baseline supervised graph anomaly detection methods, with the only exception of Eland-e2e with GraphSAGE and HetGNN on Reddit. Specifically, Eland-itr improves (averaged across datasets) 1.0% (GCN), 1.7% (GraphSAGE), and 2.1% (HetGNN) on AUC score and 7.7%, 3.8%, and 4.8% on AP; Eland-e2e improves 3.8%, 0.7%, and 3.1% on AUC and 17.7%, 1.7%, and 6.3% on AP, respectively.
We also observe that Eland outperforms all four baseline methods. For RNNfd, its results are not as good as any other methods as it only used the action sequence data. For Grand, our proposed Eland-itr and Eland-e2e achieve 3.1% and 4.1% improvements on AUC, respectively. JODIE hurts the performances of the original GNNs possibly because it was designed for predicting the next interaction item but not the following action sequence. Hence Eland outperforms JODIE with large margins. On average, Eland-itr and Eland-e2e improve 12.7% and 14.7% on AUC, respectively. Finally, Eland also outperforms the graph data augmentation method GAug. On average, Eland-itr and Eland-e2e improve 5.4% and 1.1% on AUC, respectively. We observe that Eland-e2e tend to perform better for supervised graph anomaly detection methods.
From Table 3 we observe that Eland outperforms unsupervised graph anomaly detection baselines. Specifically, Eland-itr improves by 9.0% (Dominant), and 7.2% (DeepAE) on AUC and 22.4%, and 14.8% on AP; Eland-e2e improves 6.7%, and 6.4% on AUC and 31.4%, and 18.8% on AP, respectively. Eland also outperforms both alternative methods JODIE and GAug. On average, Eland-itr improves 5.1% on AUC and 25.9% on AP; Eland-e2e improves 3.6% on AUC and 33.2% on AP. We note that Eland-itr achieves better performances than Eland-e2e with unsupervised anomaly detection modules. This is due to the misalignment of the training objectives of unsupervised methods and the evaluation metrics, resulting in the unsupervised objectives that mislead the action sequence augmentation module during end-to-end training.
Metric Method Weibo 10% Weibo 20% AUC GCN 81.780.78 82.440.54 +Eland-e2e (LSTM) 83.760.74 84.300.53 +Eland-e2e (RNN) 83.830.34 84.330.30 +Eland-e2e (GRU) 84.140.50 84.570.36 AP GCN 41.211.36 44.643.25 +Eland-e2e (LSTM) 51.312.42 51.461.12 +Eland-e2e (RNN) 52.740.63 52.840.92 +Eland-e2e (GRU) 54.150.83 55.140.66
We find that on the Amazon dataset, Dominant and DeepAE are not effective, so their results are not included. The reason is that the unsupervised training objectives in the two methods are based on outlier detection with auto-encoders, which is not aligned with the actual label distributions. Therefore, most users that were marked as “highly suspicious” by these two methods in the Amazon data are actually benign users.
5.2.2. Achieving early anomaly detection
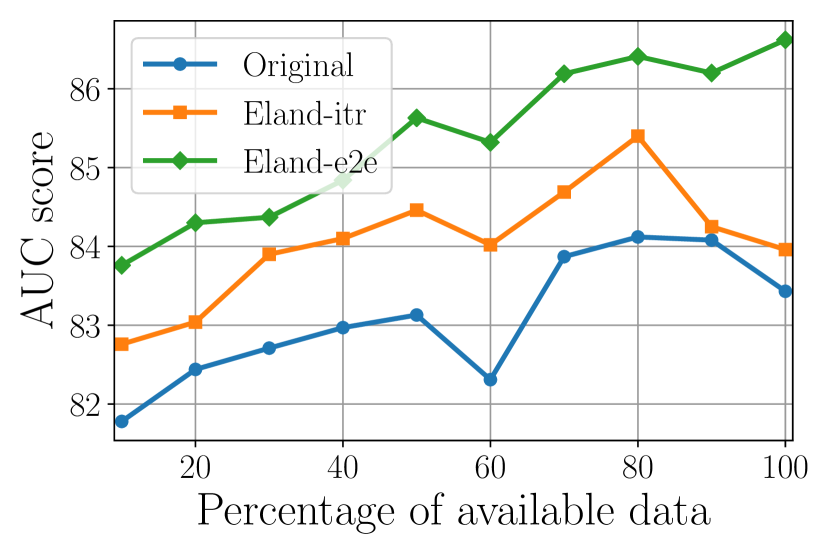
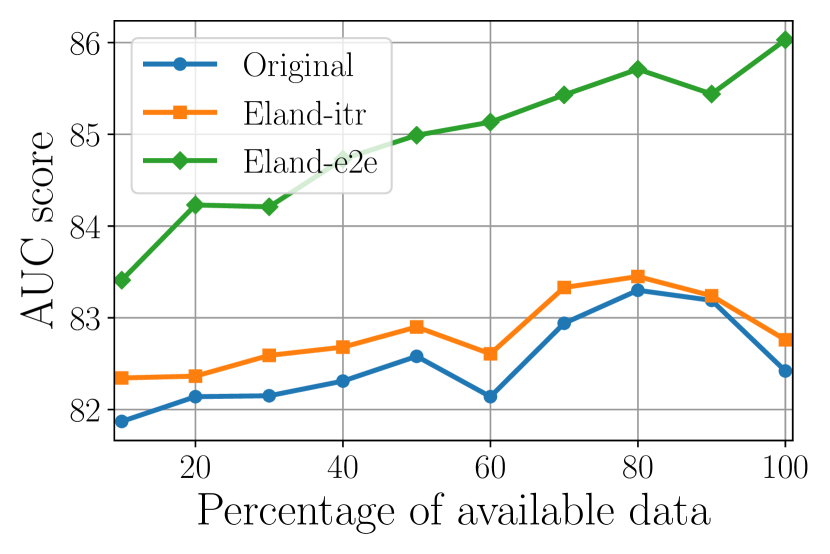
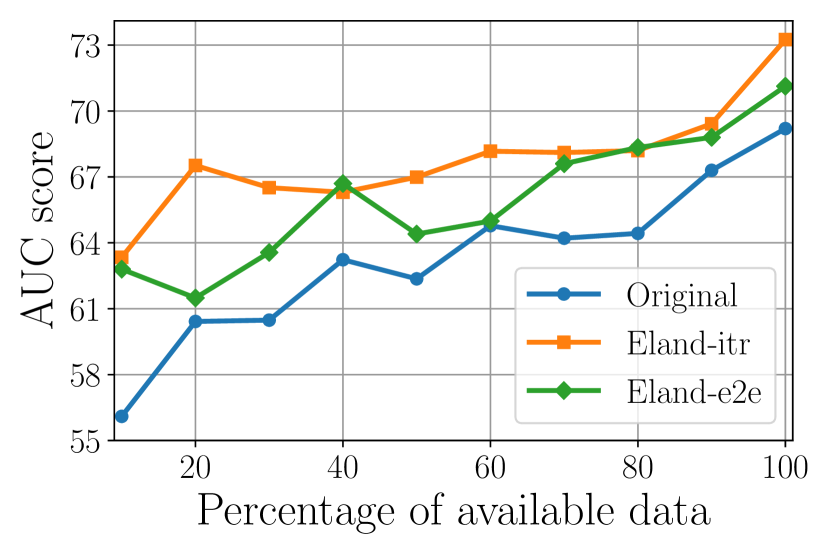
To better show the results of the proposed Eland framework for early anomaly detection, we present Figure 3 (along with Figure 1 for Dominant), in which we show the trends of AUC scores of original graph anomaly detection methods and our proposed framework change as more observed data is available on the Weibo dataset. We observe that in general, both Eland-itr and Eland-e2e are able to accomplish the early-stage anomaly detection task as defined in Section 3. Eland-e2e generally achieves more improvements on supervised graph anomaly detection methods; for unsupervised methods, Eland-itr tends to perform better, which aligns with our observations from Table 2 and 3.
Particularly, for supervised methods, the performance of Eland-e2e with only 10% or 20% available data is better or comparable with the baselines with all data. With only 20% (GCN) / 10% (GraphSAGE) / 10% (HetGNN) / 40% (Dominant) / 60% (DeepAE) of earliest available data, Eland achieves better or comparable performance than the original model with all available data.
Although the original performances are not monotonically increasing (though correlated), it is also worth mentioning that for all of the baseline detection methods, we are able to observe substantial improvements in absolute performance on average, which are evidence for Eland’s powerful ability to model the evolution of the graph structure and user-item interactions.
5.2.3. Ablation study and sensitivity analysis
Ablation study on Seq2Seq choice. To validate the robustness of Eland on the choice of Seq2Seq model in the action sequence augmentation module, we show the results of Eland-e2e with different Seq2Seq models (GRU (Cho et al., 2014), LSTM (Hochreiter and Schmidhuber, 1997), and traditional RNN (Hochreiter and Schmidhuber, 1997)) on Weibo dataset in Table 4. We can observe that GCN+Eland-e2e with all Seq2Seq methods can outperform vanilla GCN (Kipf and Welling, 2016), indicating that Eland is robust to the choice of Seq2Seq method used in the action sequence augmentation module. Future works can try more powerful sequential models such as Transformer (Vaswani et al., 2017) as the module.
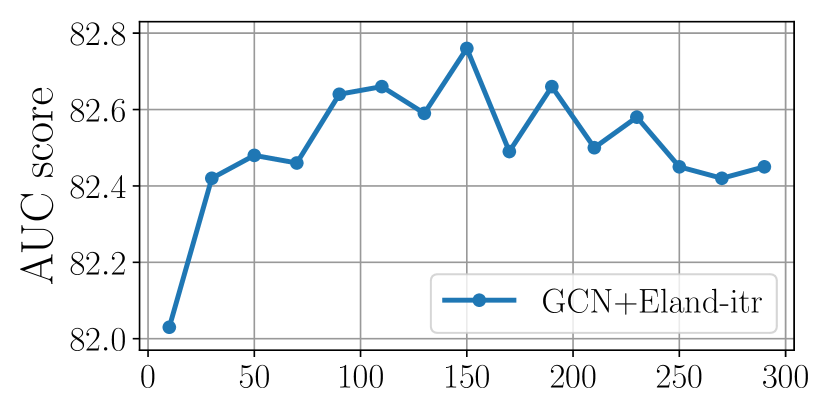
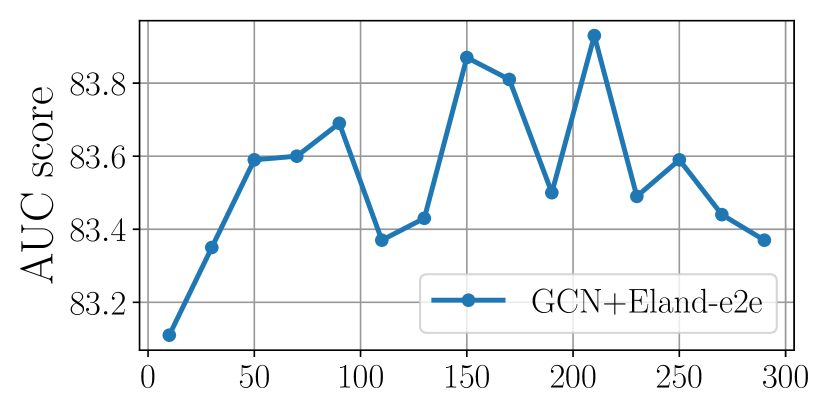
Hyperparameter sensitivity. We test through Eland’s hyperparameters and , which controls the amount of augmented actions for each user in Eland-itr and Eland-e2e, respectively. Figure 4 shows that the proposed Eland-itr and Eland-e2e are robust to and for range of for Weibo data.
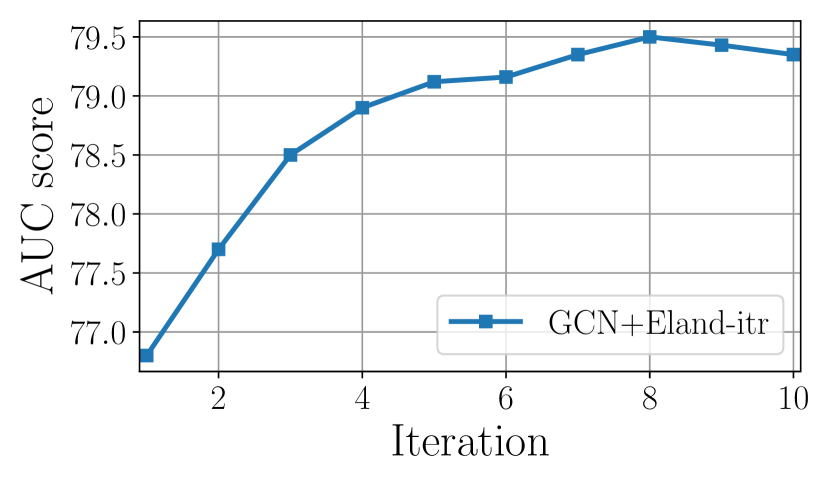
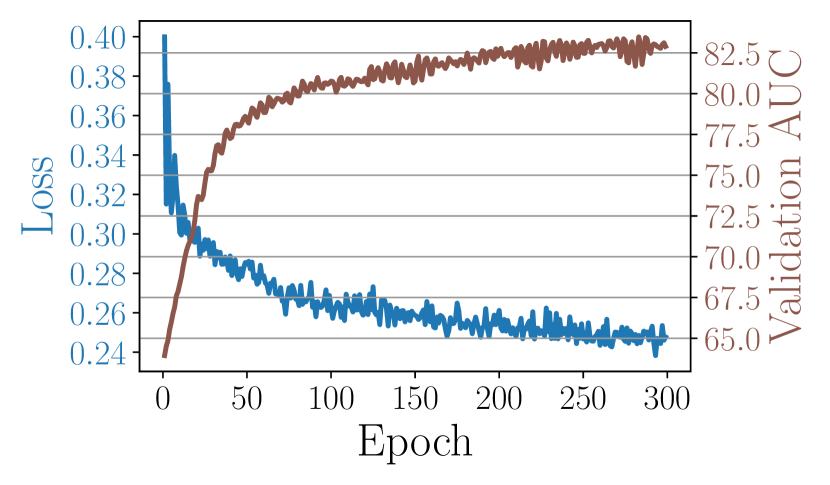
Model convergence. Figure 5 presents the convergence progress of Eland. Figure 5(a) shows that the change of performance over iterations of Eland-itr with GCN. We observe a smooth yet fast increase of the AUC at the first few iterations, which then reaches a steady state. The curve shows the bootstrapping iterative training design of Eland-itr is meaningful and demonstrates the mutual beneficial relationship between the two modules. Figure 5(b) shows the convergence of loss and validation AUC during training.
5.3. Case Study
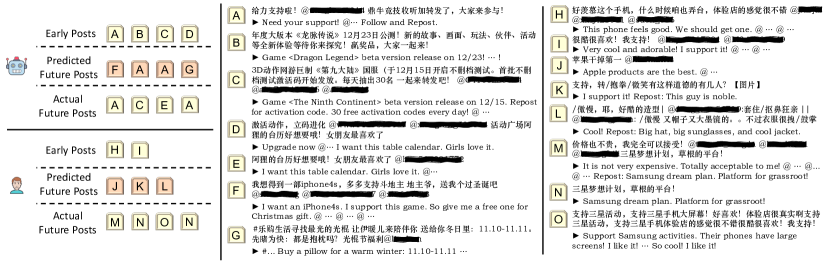
To further demonstrate the effectiveness of our proposed Eland framework, we conduct case studies on the Weibo data. We study two user cases: (1) an anomalous user who was falsely classified as a benign user at early stage when data were not complete, and (2) a benign user who was falsely classified as an anomaly at an early stage. Figure 6 presents their historical posts, predicted posts (given by Eland-e2e), and actual future posts.
For the anomalous user, GraphSAGE originally classified him as a benign user with confidence of 0.73. Eland-e2e successfully classified him as an anomaly with confidence of 0.58. From the posts of this user we observe that the user was posting advertisements in early posts. However, the posts did not repeat or show any strong pattern of an anomaly. Eland-e2e correctly predicted that he will repeat posting the message and hence enforced his suspicious pattern. The ground truth showed that this user actually did continue to repeat the advertisement posts (e.g., repeat posting message ). We verified that this user was an anomaly by checking the complete history of his posts and we found that the history has a large number of advertisements.
For the other user, GraphSAGE falsely predicted this benign user as an anomaly with confidence of 0.73. With Eland-e2e, this user was correctly classified as a benign user with confidence of 0.74. One possible reason is that this user mentioned cell phones in his early posts and there were a large number of advertisement posts about phones in the dataset. Eland-e2e predicted that he would be posting some unrelated posts, one of which was related with iPhone. Although the predicted future posts were not exactly the same as the actual future posts, the predicted posts showed that the behavior pattern of this user is dissimilar to that of an anomalous user. We verified that this user was benign. Most of his posts were about personal ideas. His posts that supported Samsung phones caused the false positive classified by GraphSAGE.
6. Conclusions
In this work, we proposed Eland for early graph-based anomaly detection via action sequence augmentation. Eland aimed at improving existing graph anomaly detection methods with limited observations. Our work managed to model both the node representation and graph topology evolution through behavior forecasting via action sequence augmentation. Experiments on real-world data demonstrated that Eland improves graph anomaly detection methods towards early and accurate anomaly detection.
Acknowledgements.
This research was supported in part by Snap Research Fellowship and National Science Foundation (NSF) Grants no. IIS-1849816 and no. CCF-1901059.References
- (1)
- Akoglu et al. (2015) Leman Akoglu, Hanghang Tong, and Danai Koutra. 2015. Graph based anomaly detection and description: a survey. Data mining and knowledge discovery (2015), 626–688.
- Baumgartner et al. (2020) Jason Baumgartner, Savvas Zannettou, Brian Keegan, Megan Squire, and Jeremy Blackburn. 2020. The pushshift reddit dataset. In ICWSM, Vol. 14. 830–839.
- Branco et al. (2020) Bernardo Branco, Pedro Abreu, Ana Sofia Gomes, Mariana SC Almeida, João Tiago Ascensão, and Pedro Bizarro. 2020. Interleaved Sequence RNNs for Fraud Detection. In Proceedings of the 26th ACM SIGKDD international conference on knowledge discovery & data mining.
- Cho et al. (2014) Kyunghyun Cho, Bart Van Merriënboer, Caglar Gulcehre, Dzmitry Bahdanau, Fethi Bougares, Holger Schwenk, and Yoshua Bengio. 2014. Learning phrase representations using RNN encoder-decoder for statistical machine translation. arXiv preprint arXiv:1406.1078 (2014).
- Cooper (2005) John CB Cooper. 2005. The poisson and exponential distributions. Mathematical Spectrum 37, 3 (2005), 123–125.
- Defferrard et al. (2016) Michaël Defferrard, Xavier Bresson, and Pierre Vandergheynst. 2016. Convolutional neural networks on graphs with fast localized spectral filtering. In Advances in neural information processing systems. 3844–3852.
- Ding et al. (2019b) Kaize Ding, Jundong Li, Rohit Bhanushali, and Huan Liu. 2019b. Deep anomaly detection on attributed networks. In Proceedings of the 2019 SIAM International Conference on Data Mining. SIAM, 594–602.
- Ding et al. (2019a) Kaize Ding, Jundong Li, and Huan Liu. 2019a. Interactive anomaly detection on attributed networks. In Proceedings of the Twelfth ACM International Conference on Web Search and Data Mining. 357–365.
- Ding et al. (2021) Kaize Ding, Qinghai Zhou, Hanghang Tong, and Huan Liu. 2021. Few-shot Network Anomaly Detection with Cross-network Meta-learning. In WWW.
- Dodds et al. (2015) Peter Sheridan Dodds, Eric M Clark, Suma Desu, Morgan R Frank, Andrew J Reagan, Jake Ryland Williams, Lewis Mitchell, Kameron Decker Harris, Isabel M Kloumann, James P Bagrow, et al. 2015. Human language reveals a universal positivity bias. Proceedings of the national academy of sciences 112, 8 (2015), 2389–2394.
- Dong et al. (2020) Manqing Dong, Feng Yuan, Lina Yao, Xiwei Xu, and Liming Zhu. 2020. MAMO: Memory-Augmented Meta-Optimization for Cold-start Recommendation. In Proceedings of the 26th ACM SIGKDD International Conference on Knowledge Discovery & Data Mining. 688–697.
- Dou et al. (2020) Yingtong Dou, Zhiwei Liu, Li Sun, Yutong Deng, Hao Peng, and Philip S Yu. 2020. Enhancing graph neural network-based fraud detectors against camouflaged fraudsters. In Proceedings of the 29th ACM International Conference on Information & Knowledge Management. 315–324.
- Eric Jang (2016) Ben Poole Eric Jang, Shixiang Gu. 2016. Categorical Reparameterization with Gumbel Softmax. In International Conference on Learning Representations (ICLR) 2017.
- Eswaran et al. (2018) Dhivya Eswaran, Christos Faloutsos, Sudipto Guha, and Nina Mishra. 2018. Spotlight: Detecting anomalies in streaming graphs. In Proceedings of the 24th ACM SIGKDD International Conference on Knowledge Discovery & Data Mining. ACM, 1378–1386.
- Feng et al. (2020) Wenzheng Feng, Jie Zhang, Yuxiao Dong, Yu Han, Huanbo Luan, Qian Xu, Qiang Yang, Evgeny Kharlamov, and Jie Tang. 2020. Graph Random Neural Networks for Semi-Supervised Learning on Graphs. Advances in Neural Information Processing Systems 33 (2020).
- Gao et al. (2018) Hongyang Gao, Zhengyang Wang, and Shuiwang Ji. 2018. Large-scale learnable graph convolutional networks. In Proceedings of the 24th ACM SIGKDD International Conference on Knowledge Discovery & Data Mining. 1416–1424.
- Guo et al. (2021) Zhichun Guo, Chuxu Zhang, Wenhao Yu, John Herr, Olaf Wiest, Meng Jiang, and Nitesh V Chawla. 2021. Few-Shot Graph Learning for Molecular Property Prediction. In Proceedings of the Web Conference 2021. 2559–2567.
- Hamilton et al. (2017) Will Hamilton, Zhitao Ying, and Jure Leskovec. 2017. Inductive representation learning on large graphs. In Advances in Neural Information Processing Systems. 1024–1034.
- Hochreiter and Schmidhuber (1997) Sepp Hochreiter and Jürgen Schmidhuber. 1997. Long short-term memory. Neural computation 9, 8 (1997), 1735–1780.
- Jiang et al. (2016) Meng Jiang, Peng Cui, Alex Beutel, Christos Faloutsos, and Shiqiang Yang. 2016. Inferring lockstep behavior from connectivity pattern in large graphs. Knowledge and Information Systems 48, 2 (2016), 399–428.
- Kipf and Welling (2016) Thomas N Kipf and Max Welling. 2016. Semi-supervised classification with graph convolutional networks. arXiv preprint arXiv:1609.02907 (2016).
- Kong et al. (2017) Yu Kong, Zhiqiang Tao, and Yun Fu. 2017. Deep sequential context networks for action prediction. In Proceedings of the IEEE Conference on Computer Vision and Pattern Recognition. 1473–1481.
- Kumar et al. (2018) Srijan Kumar, Bryan Hooi, Disha Makhija, Mohit Kumar, Christos Faloutsos, and VS Subrahmanian. 2018. Rev2: Fraudulent user prediction in rating platforms. In Proceedings of the Eleventh ACM International Conference on Web Search and Data Mining. 333–341.
- Kumar et al. (2019) Srijan Kumar, Xikun Zhang, and Jure Leskovec. 2019. Predicting dynamic embedding trajectory in temporal interaction networks. In Proceedings of the 25th ACM SIGKDD International Conference on Knowledge Discovery & Data Mining. 1269–1278.
- Li et al. (2019) Yuening Li, Xiao Huang, Jundong Li, Mengnan Du, and Na Zou. 2019. Specae: Spectral autoencoder for anomaly detection in attributed networks. In Proceedings of the 28th ACM International Conference on Information and Knowledge Management. 2233–2236.
- Liu et al. (2018) Jun Liu, Amir Shahroudy, Gang Wang, Ling-Yu Duan, and Alex C Kot. 2018. SSNet: scale selection network for online 3D action prediction. In Proceedings of the IEEE Conference on Computer Vision and Pattern Recognition. 8349–8358.
- Liu et al. (2020) Siwei Liu, Iadh Ounis, Craig Macdonald, and Zaiqiao Meng. 2020. A Heterogeneous Graph Neural Model for Cold-Start Recommendation. In Proceedings of the 43rd International ACM SIGIR Conference on Research and Development in Information Retrieval. 2029–2032.
- Ma et al. (2020a) Yao Ma, Ziyi Guo, Zhaocun Ren, Jiliang Tang, and Dawei Yin. 2020a. Streaming graph neural networks. In Proceedings of the 43rd International ACM SIGIR Conference on Research and Development in Information Retrieval. 719–728.
- Ma et al. (2020b) Yao Ma, Xiaorui Liu, Tong Zhao, Yozen Liu, Jiliang Tang, and Neil Shah. 2020b. A unified view on graph neural networks as graph signal denoising. arXiv preprint arXiv:2010.01777 (2020).
- Maddison et al. (2017) Chris J. Maddison, Andriy Mnih, and Yee Whye Teh. 2017. The Concrete Distribution: A Continuous Relaxation of Discrete Random Variables. In International Conference on Learning Representations.
- Manessi et al. (2020) Franco Manessi, Alessandro Rozza, and Mario Manzo. 2020. Dynamic graph convolutional networks. Pattern Recognition 97 (2020), 107000.
- McAuley and Leskovec (2013) Julian John McAuley and Jure Leskovec. 2013. From amateurs to connoisseurs: modeling the evolution of user expertise through online reviews. In Proceedings of the 22nd international conference on World Wide Web. 897–908.
- Pang et al. (2019) Guansong Pang, Chunhua Shen, and Anton van den Hengel. 2019. Deep anomaly detection with deviation networks. In Proceedings of the 25th ACM SIGKDD international conference on knowledge discovery & data mining. 353–362.
- Pareja et al. (2020) Aldo Pareja, Giacomo Domeniconi, Jie Chen, Tengfei Ma, Toyotaro Suzumura, Hiroki Kanezashi, Tim Kaler, Tao B Schardl, and Charles E Leiserson. 2020. EvolveGCN: Evolving Graph Convolutional Networks for Dynamic Graphs.. In AAAI. 5363–5370.
- Rama et al. (2019) Kiran Rama, Pradeep Kumar, and Bharat Bhasker. 2019. Deep Learning to Address Candidate Generation and Cold Start Challenges in Recommender Systems: A Research Survey. arXiv preprint arXiv:1907.08674 (2019).
- Rayana and Akoglu (2015) Shebuti Rayana and Leman Akoglu. 2015. Collective opinion spam detection: Bridging review networks and metadata. In Proceedings of the 21th ACM SIGKDD International Conference on Knowledge Discovery & Data Mining. 985–994.
- Sankar et al. (2021) Aravind Sankar, Yozen Liu, Jun Yu, and Neil Shah. 2021. Graph Neural Networks for Friend Ranking in Large-scale Social Platforms. In WWW.
- Seo et al. (2018) Youngjoo Seo, Michaël Defferrard, Pierre Vandergheynst, and Xavier Bresson. 2018. Structured sequence modeling with graph convolutional recurrent networks. In International Conference on Neural Information Processing. Springer, 362–373.
- Shu et al. (2020) Kai Shu, Guoqing Zheng, Yichuan Li, Subhabrata Mukherjee, Ahmed Hassan Awadallah, Scott Ruston, and Huan Liu. 2020. Leveraging Multi-Source Weak Social Supervision for Early Detection of Fake News. arXiv:2004.01732.
- Sutskever et al. (2014) Ilya Sutskever, Oriol Vinyals, and Quoc V Le. 2014. Sequence to sequence learning with neural networks. In Advances in neural information processing systems.
- Tang et al. (2020) Xianfeng Tang, Yozen Liu, Neil Shah, Xiaolin Shi, Prasenjit Mitra, and Suhang Wang. 2020. Knowing your FATE: Friendship, Action and Temporal Explanations for User Engagement Prediction on Social Apps. In Proceedings of the 26th ACM SIGKDD international conference on knowledge discovery & data mining.
- Ting et al. (2020) Kai Ming Ting, Bi-Cun Xu, Takashi Washio, and Zhi-Hua Zhou. 2020. Isolation Distributional Kernel: A New Tool for Kernel based Anomaly Detection. In Proceedings of the 26th ACM SIGKDD International Conference on Knowledge Discovery & Data Mining. 198–206.
- Vaswani et al. (2017) Ashish Vaswani, Noam Shazeer, Niki Parmar, Jakob Uszkoreit, Llion Jones, Aidan N Gomez, Łukasz Kaiser, and Illia Polosukhin. 2017. Attention is all you need. In Proceedings of the 31st International Conference on Neural Information Processing Systems. 6000–6010.
- Veličković et al. (2017) Petar Veličković, Guillem Cucurull, Arantxa Casanova, Adriana Romero, Pietro Lio, and Yoshua Bengio. 2017. Graph attention networks. arXiv preprint arXiv:1710.10903 (2017).
- Wang et al. (2019) Daixin Wang, Jianbin Lin, Peng Cui, Quanhui Jia, Zhen Wang, Yanming Fang, Quan Yu, Jun Zhou, Shuang Yang, and Yuan Qi. 2019. A semi-supervised graph attentive network for financial fraud detection. In 2019 IEEE International Conference on Data Mining (ICDM). IEEE, 598–607.
- Ying et al. (2018) Rex Ying, Ruining He, Kaifeng Chen, Pong Eksombatchai, William L Hamilton, and Jure Leskovec. 2018. Graph convolutional neural networks for web-scale recommender systems. In Proceedings of the 24th ACM SIGKDD International Conference on Knowledge Discovery & Data Mining. 974–983.
- Zang et al. (2019) Chengxi Zang, Peng Cui, Wenwu Zhu, and Fei Wang. 2019. Dynamical Origins of Distribution Functions. In Proceedings of the 25th ACM SIGKDD International Conference on Knowledge Discovery & Data Mining. 469–478.
- Zhang et al. (2019) Chuxu Zhang, Dongjin Song, Chao Huang, Ananthram Swami, and Nitesh V Chawla. 2019. Heterogeneous graph neural network. In Proceedings of the 25th ACM SIGKDD International Conference on Knowledge Discovery & Data Mining.
- Zhang et al. (2020) Shijie Zhang, Hongzhi Yin, Tong Chen, Quoc Viet Nguyen Hung, Zi Huang, and Lizhen Cui. 2020. GCN-Based User Representation Learning for Unifying Robust Recommendation and Fraudster Detection. SIGIR (Information retrieval) 20 (2020).
- Zhao et al. (2020) Tong Zhao, Chuchen Deng, Kaifeng Yu, Tianwen Jiang, Daheng Wang, and Meng Jiang. 2020. Error-Bounded Graph Anomaly Loss for GNNs. In Proceedings of the 29th ACM International Conference on Information & Knowledge Management. 1873–1882.
- Zhao et al. (2021a) Tong Zhao, Tianwen Jiang, Neil Shah, and Meng Jiang. 2021a. A Synergistic Approach for Graph Anomaly Detection with Pattern Mining and Feature Learning. IEEE Transactions on Neural Networks and Learning Systems (2021).
- Zhao et al. (2021c) Tong Zhao, Gang Liu, Daheng Wang, Wenhao Yu, and Meng Jiang. 2021c. Counterfactual Graph Learning for Link Prediction. arXiv preprint arXiv:2106.02172 (2021).
- Zhao et al. (2021b) Tong Zhao, Yozen Liu, Leonardo Neves, Oliver Woodford, Meng Jiang, and Neil Shah. 2021b. Data Augmentation for Graph Neural Networks. In The Thirty-Fifth AAAI Conference on Artificial Intelligence.
- Zhao et al. (2018) Tong Zhao, Matthew Malir, and Meng Jiang. 2018. Actionable objective optimization for suspicious behavior detection on large bipartite graphs. In 2018 IEEE International Conference on Big Data (Big Data). IEEE, 1248–1257.
- Zhu et al. (2020) Dali Zhu, Yuchen Ma, and Yinlong Liu. 2020. Anomaly Detection with Deep Graph Autoencoders on Attributed Networks. In 2020 IEEE Symposium on Computers and Communications (ISCC). IEEE, 1–6.