Deep Learning of Accurate Force Field of Ferroelectric HfO2
Abstract
The discovery of ferroelectricity in HfO2-based thin films opens up new opportunities for using this silicon-compatible ferroelectric to realize low-power logic circuits and high-density non-volatile memories. The functional performances of ferroelectrics are intimately related to their dynamic responses to external stimuli such as electric fields at finite temperatures. Molecular dynamics is an ideal technique for investigating dynamical processes on large length and time scales, though its applications to new materials is often hindered by the limited availability and accuracy of classical force fields. Here we present a deep neural network-based interatomic force field of HfO2 learned from ab initio data using a concurrent learning procedure. The model potential is able to predict structural properties such as elastic constants, equation of states, phonon dispersion relationships, and phase transition barriers of various hafnia polymorphs with accuracy comparable with density functional theory calculations. The validity of this model potential is further confirmed by the reproduction of experimental sequences of temperature-driven ferroelectric-paraelectric phase transitions of HfO2 with isobaric-isothermal ensemble molecular dynamics simulations. We suggest a general approach to extend the model potential of HfO2 to related material systems including dopants and defects.
I Introductions
Ferroelectrics characterized by the electric field-tunable polarization, fast switching speed, low power consumption, and high endurance have been considered as excellent materials to realize high-speed energy-efficient logic and nonvolatile memory devices Scott (2007); Huang et al. (2018); Mikolajick et al. (2020). However, the poor compatibility of conventional perovskite ferroelectrics such as Pb(Zr, Ti)O3 with the complementary metal-oxide-semiconductor (CMOS) technology has made it difficult to down scale the ferroelectric memory to the sub-100 nm regime Pinnow and Mikolajick (2004). Though the first commercial ferroelectric random-access memory (FeRAM) appeared in the early 1990s Bondurant (1990), current state-of-art technology node remains 130 nm McAdams et al. (2004). In comparison, silicon-based memories such as DRAM and NAND flash memory have already achieved the 10-nm technology node, delivering much lower cost per bit than FeRAM Park et al. (2018a). Finding ferroelectrics with improved CMOS compatibility thus becomes a key task for the development of ferroelectric memory technology Pešić et al. (2017); Park et al. (2018a).
The discovery of robust nanoscale ferroelectricity in HfO2-based thin films by NamLab in 2011 opened up exciting opportunities for ferroelectric-based electronics Böscke et al. (2011). Hafnium oxide, being thermodynamically stable on silicon, has proved CMOS compatibility Gutowski et al. (2002) and is already used as the high-permittivity gate insulator in silicon-based field effect transistors. Experimentally, it was found that an ultrathin doped HfO2 film of just 1 nm can still support switchable polarization Cheema et al. (2020), free from the depolarization effect often presented in thin films of perovskite ferroelectrics Batra et al. (1973); Wurfel and Batra (1973); Ma and Han (2002). Moreover, current atomic layer deposition (ALD) technique is capable of depositing hafnium oxides in high-aspect-ratio structures on silicon, allowing the fabrication of high-quality 3D-stackable memory Park et al. (2018a); Luo et al. (2020).
The origin of ferroelectricity in HfO2-based thin films has been an active research topic since its discovery. Despite the relatively simple chemical composition, HfO2 is known to form many polymorphs. At room temperature, bulk HfO2 will crystallize in a monoclinic phase (-phase, space group ), which evolves to a tetragonal phase (-phase) of space group and subsequently to a cubic phase of space group with increasing temperature. The phase transition of HfO2 at ambient temperature with increasing pressure follows Ohtaka et al. (2004). All these polymorphs have inversion symmetry thus forbidding spontaneous polarization. Combined experimental and theoretical studies eventually pinpointed the phase responsible for the ferroelectricity: an orthorhombic phase in the space group of (-phase) Park et al. (2015); Huan et al. (2014); Reyes-Lillo et al. (2014); Sang et al. (2015); Materlik et al. (2015). However, a series of first-principles density functional theory (DFT) studies revealed that the -phase has energy higher than the -phase Huan et al. (2014); Reyes-Lillo et al. (2014); Materlik et al. (2015), whereas simply applying hydrostatic pressures or epitaxial strains is not enough to make the -phase favored over the -phase Reyes-Lillo et al. (2014); Batra et al. (2017a). The general consensus now is that the thermodynamic stability of ferroelectric HfO2 results from combined effects of various factors such as doping Schroeder et al. (2014); Starschich and Boettger (2017); Park et al. (2017a); Xu et al. (2017); Batra et al. (2017b), mechanical stress Shiraishi et al. (2016); Batra et al. (2017a), oxygen vacancy Xu et al. (2016); Pal et al. (2017), surface/interface/grain boundary energy Materlik et al. (2015); Park et al. (2015); Polakowski and Müller (2015); Batra et al. (2016); Künneth et al. (2017); Park et al. (2017b), electric fields Batra et al. (2017a), and substrate orientations Liu and Hanrahan (2019). More recently, it was pointed out that the flat polar phonon bands in HfO2 give rise to intrinsically localized dipoles, responsible for the robust scale-free ferroelectricity Lee et al. (2020).
Like all other ferroelectrics, the functionalities of HfO2-based ferroelectrics depend on various kinetic and dynamical processes that often span many scales in time and space. Recent experiments suggest that the thermodynamic arguments are not enough to explain the emergence of the metastable -phase Park et al. (2017b, 2018b). Park et al. found that the fraction of the low-entropy -phase in Hf0.5Zr0.5O2 thin films increases with increasing temperature, contradictory to the prediction of the thermodynamic model that a higher temperature will favor high-entropy phases such as -phase and -phase Park et al. (2017b). The kinetic effect of phase transitions during the annealing and cooling processes likely contribute to the formation of the polar phase Park et al. (2018b, c). Polarization switching is another important dynamical process for a ferroelectric as the switching speed and coercive field dictate the writing speed and power consumption, respectively Liu et al. (2016); Li et al. (2019). However, the atomistic mechanisms and characteristics of ferroelectric switching in this fluorite-structure ferroelectric remain largely unexplored, while experimental measurements reported in literature seem to support different switching mechanisms Gong et al. (2018); Yoon et al. (2019); Hoffmann et al. (2019). Therefore, it is desirable to have a tool to study the kinetic and dynamical properties of HfO2-based ferroelectrics at the atomic level.
First-principles DFT calculations have played an important role in understanding the structure-property relationship of ferroelectrics. Nevertheless, the study of finite-temperature dynamical properties of ferroelectrics is still beyond the reaches of conventional DFT methods due to the expensive computational cost. Statistical methods such as molecular dynamics (MD) simulations are ideal techniques for investigating dynamical processes on larger length/time scales while providing atomistic details with femtosecond time-resolution. In the case of HfO2, several force fields have already been developed Shan et al. (2010); Broglia et al. (2014); Schie et al. (2017); Sivaraman et al. (2020). However, none of them considered the ferroelectric phase during the parameterization, and it is not yet clear whether those force fields can accurately describe the structural properties of the ferroelectric phase. Such situation also reveals the limitation of MD simulations: applications to new materials systems are often hindered by the limited availability and accuracy of classical force fields. Developing a force field is often a tedious process because of the many-body nature of the potential energy. Most force fields approximate the interatomic interactions with sets of relatively simple analytical functions in which the parameters are fitted to a database of information including quantum mechanical calculations and/or experimental thermodynamic properties. The “true” interatomic potential of complex materials is intrinsically a high-dimensional function, which can only be roughly approximated by analytical functions of “ad hoc” forms with a limited number of parameters. Moreover, the transition metal-oxygen bonds in ferroelectrics often possess a mixed ionic-covalent character Cohen (1992) due to the - hybridization, making the force field development even more challenging Phillpot et al. (2007); Liu et al. (2013a, b).
The application of machine learning (ML) to force field development offers an attractive solution to the accuracy-efficiency dilemma by combining the strengths of DFT and classical MD. Many ML-based force fields have been developed for systems of vastly different bonding characters, ranging from organic molecules Smith et al. (2017); Manzhos and Carrington (2008), molecular and condensed water Bartók et al. (2013a); Morawietz et al. (2016); Ko et al. (2019), to metals Eshet et al. (2010); Botu and Ramprasad (2015); Zhang et al. (2020) and alloys Andolina et al. (2020); Zhang et al. (2019); Jiang et al. (2020), semiconductors such as silicon Sanville et al. (2008); Behler et al. (2008); Babaei et al. (2019); Bartók et al. (2018) and GeTe Sosso et al. (2012), and to inorganic halide perovskites Thomas et al. (2019). In general, there are two key ingredients in a ML-based force field: a descriptor that represents the local atomic environment and a non-linear fitting function that maps the descriptor to the local energy contribution. For example, Behler and Parrinello (BP) proposed to use “symmetry functions” to describe the local geometric environment of an atom, which were then used as inputs for an artificial neural network (NN) to evaluate the atomic contribution to the total energy Behler and Parrinello (2007). Bartok et al. developed a Gaussian approximation potential (GAP) for silicon using the smooth overlap of atomic positions (SOAP) kernel Bartók et al. (2013b) that quantifies the similarity between atomic neighborhoods characterized by neighbor densities Bartók et al. (2018). More recently, the smooth edition of the Deep Potential (DP) scheme Zhang et al. (2018, ) employed a faithful and symmetry-preserving embedding network to parametrize the descriptors, bypassing the need to fix hand-crafted descriptors and enabling an end-to-end procedure for representing complex chemical environments in chemical reactions Zeng et al. (2019), heterogeneous aqueous interfaces Andrade et al. (2020), and high-entropy alloys Dai et al. (2020).
In this work, we applied the Deep Potential Molecular Dynamics (DeePMD) method Zhang et al. (2018, ) to construct an accurate and transferable force field for HfO2 by concurrently learning from results of DFT calculations Zhang et al. (2019, 2020). The resultant DP model reproduces the DFT results of a wide range of thermodynamic properties of various hafnia polymorphs, including the ferroelectric phase. Notably, the temperature-driven ferroelectric-paraelectric phase transition of HfO2 is well captured by MD simulations in the isobaric-isothermal () ensemble. The DP predictions of transition barriers between different phases of HfO2 (, , , and ) agree well with first-principles results. We believe current DP model of HfO2 can be systematically improved and extended by adding new training data representing new atomic environments, enabling atomistic modeling of various extrinsic effects such as doping and defects.
II Computational Methods
II.1 Deep potential molecular dynamics
We briefly discuss the key concepts in DeePMD method and refer interested readers to the original papers Zhang et al. (2018, ) for detailed discussions. The DP model assumes the total potential energy () can be expressed as a sum of atomic energies (), . Each atomic energy is parameterized with a deep neural network (DNN) function defined as , where is the local environment of atom in terms of Cartesian coordinates relative to its neighbors within a cutoff radius , denotes the chemical species of th atom, and is the DNN parameter set that eventually will be optimized by the training procedure. It is noted that each sub-network of consists of an embedding and a fitting neural network. The embedding network maps to a feature matrix that preserves the permutation, translation, and rotation symmetries of the system, while the fitting network is a standard feedforward neural network that maps to the atomic energy .
In this work, the smooth version of the DP model was employed Zhang et al. and the DeePMD-kit package Wang et al. (2018) was used for training. The cut-off radius is set to 6 Å, and the inverse distance decays smoothly from 1 Å to 6 Å to remove the discontinuity introduced by the cut-off. The embedding network of size (25, 50, 100) follows the ResNet-like architecture. The fitting network is composed of three layers, each containing 240 nodes. As reported in ref Zhang et al. (2018), the loss function is defined as
| (1) |
where denotes the difference between the DP prediction and the training data, is the number of atoms, is the energy per atom, is the atomic force of atom , and is the virial tensor divided by . , , and are tunable prefactors. Here we increase both and from 0.02 to 1. And decrease from 1000 to 1.
We note here that the additive structure is an ansatz of the DP model, and of many other ML-based force fields. Such an ansatz ensures that the potential energy is extensive, so that the same model can be used to describe systems with different number of atoms. The introduction of the cutoff radius makes the interaction range finite and potentially misses some long-range effect. On the other hand, in many cases, the finite-range model indeed gives an accuracy of meV/atom in energy, which is comparable with the intrinsic error of the functional approximation adopted in DFT, and is sufficient for most properties of practical interest. This is indeed the case for the system we study here. The incorporation of dopants and defects, as well as finite fields, may require a more delicate treatment of the long-range interactions, which will be left to future investigations.
II.2 Deep potential generator
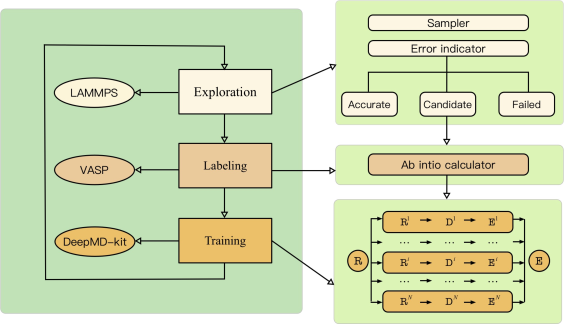
Since ab initio calculations are expensive, to develop a reliable ML-based potential, we need a procedure that generates an optimal and minimal set of training data that covers a wide range of relevant configurational space. Here we employ the Deep Potential generator (DP-GEN) scheme Zhang et al. (2019). DP-GEN is a concurrent learning procedure involving three steps, exploration, labeling, and training, which form a closed loop (Fig. 1). Starting with an ab initio database, an ensemble of DP models are trained with different initial values of . In the exploration step, one of these models is used for MD simulations to explore the configuration space. For each newly sampled configuration from MD, the ensemble of DP models will generate an ensemble of predictions (e.g., energies and atomic forces). Since the ensemble of models only differ in the initialization of network parameters , these models will exhibit nearly identical predictive accuracy for configurations that are well represented by the training data. Otherwise, they are expected to give scattered predictions with a considerable variance. Therefore, the deviation of the model predictions can be used to formulate the criterion for labeling: a sampled configuration giving rise to a large model deviation will be labeled via DFT calculations and will be added to the training database for training in the next cycle.
In detail, the model deviation is defined as the maximum standard deviation of the predictions of the atomic forces ,
| (2) |
where is the average taken over the ensemble of DP models. In practice, we introduce two thresholds, and . Only configurations satisfying are labeled for DFT calculations, because a configuration with a small is already well described by the current DP model, whereas a configuration with a large model deviation is likely to be highly distorted or unconverged in DFT calculations.
When all sampled configurations have , the ensemble of DP models is considered converged. Here we set eV/Å and eV/Å. The described automatic and iterative workflow was performed using DP-GEN package.
II.3 Initial training database and exploration protocol
The initial training database contains structures generated by randomly perturbing ground-state structures of , , and phases of HfO2. We use supercells of 96 atoms for DFT calculations with the Vienna Ab initio Simulation (VASP) package Kresse and J (1996); Kresse and Furthmüller (1996). The projected augmented wave (PAW) method Blochl (1994); Kresse and Joubert (1999) and the generalized gradient approximation of Perdew-Burke-Ernzerhof (PBE) Perdew et al. (1996) type for the exchange-correlation functional are employed. An energy cutoff of 600 eV and -grid mesh are sufficient to converge the energy and atomic force. At the exploration step, the configuration space is sampled by running simulations at various temperatures (from 100 to 3300 K) and pressures (from to kBar). Because the training database will keep incorporating new configurations generated and labeled on the fly during the exploration, we expect the final converged DP model is not sensitive to the exact construction of the initial training database.
II.4 MD simulations of phase transition
The optimized DP model of HfO2 is used to study phase transitions driven by temperature by performing MD simulations. We use a supercell of 6144 atoms and a time step of 1 fs. The temperature is controlled via the Nosé-Hoover thermostat and the pressure is maintained using the Parrinello-Rahman barostat as implemented in LAMMPS Plimpton (1995). The final configuration of the simulation at a lower temperature is used as the initial configuration for the simulation at a higher temperature.
III Results and Discussions
III.1 Fitting performance of DP model
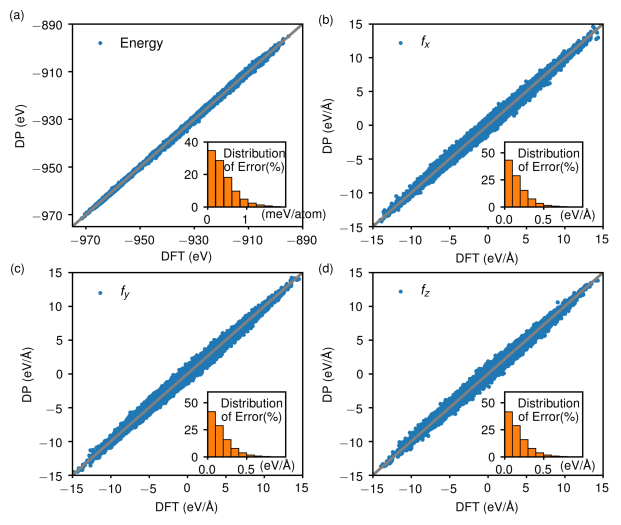
Figure 2 compares the energies and atomic forces predicted by DFT and DP for all the structures in the final training database (21768 configurations) with insets showing the distributions of absolute errors. We find an overall satisfactory agreement between DP predictions and DFT results with a mean absolute error (MAE) of 1.6 meV/atom for energy. This clearly demonstrates that the deep neural network-based potential model has excellent representability, capable of learning complex and highly non-linear energy functional with little human intervention. The whole DP-GEN process carried out 61 iterations during which a total number of 41 million configurations were sampled with only 21768 (0.05) configurations selected for labeling. The usage of model deviation as an error indicator for labeling substantially reduced the computational cost associated with DFT calculations.
III.2 Predictions of static properties of hafnia polymorphs
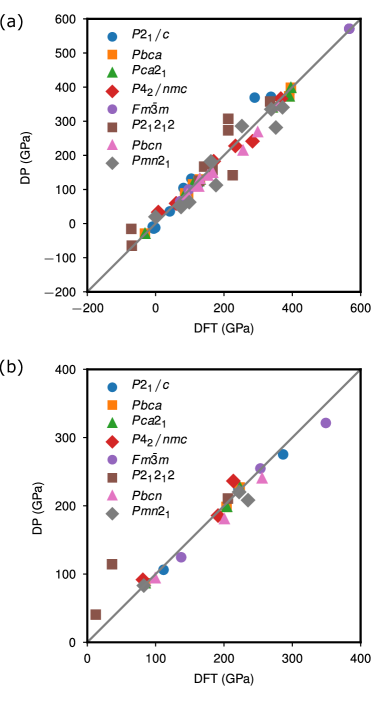
Table 1 compares the lattice parameters of different phases of HfO2 optimized with DFT and DP at 0 K, demonstrating excellent agreement. Elastic constants and moduli are fundamental material properties as they reflect the strength of chemical bonds that are intimately related to the second derivative of the potential energy. We use the DP model to calculate the elastic properties for a few hafnia polymorphs, , , , , , , , and , and compare the DP values with DFT results.
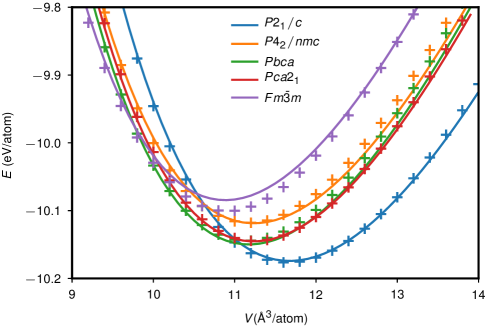
As illustrated in Fig. 3 and detailed in Table 2, the elastic constants and moduli from the DP model are comparable with the DFT values. Considering that the values of elastic constants distribute over a wide range from GPa to 600 GPa, the demonstrated agreement between DP and DFT results highlight the accuracy of the optimized model. It is noted that the training database does not contain any elastic property nor any structural information of , , and phases explicitly. The ability of the DP model to predict reasonably well the elastic properties of phases not included in the training database with quantum mechanical accuracy highlights its accuracy as well as transferability. DP and DFT predictions of equations of states (EoSs) of selective hafnia polymorphs are reported in Fig. 4. It is clear that DP well reproduce DFT EoSs as well as the order of phase stability: . It is remarkable that DP is capable of capturing the small energy difference between and .
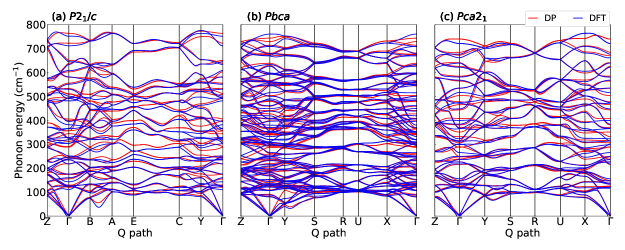
To further investigate the vibrational property predicted by the DP model, we report in Fig. 5 the phonon spectra of , and phases. An accurate prediction of the phonon spectra requires a good description of the second-order derivative information around local minima of different phases, which is not explicitly considered in the DP-GEN process. We observe a fairly good agreement between DP and DFT results. Adding perturbed structures for calculating the phonon spectra to the training dataset should further improve the DP prediction of this property.
III.3 Phase Transitions
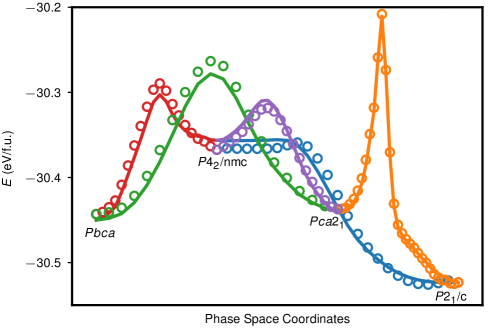
The formation of ferroelectric -phase in HfO2 thin films was suggested to have a strong kinetic contribution that the transformation from the metastable - and -phases to the most stable -phase are suppressed by a kinetic barrier Park et al. (2017b, 2018b); Liu and Hanrahan (2019). In order to use MD to study phase transitions at finite temperatures, it is necessary for the force field to accurately predict the solid-solid phase transition barriers. This is a challenging task as the intermediate structures during the transition are often strongly distorted relative to equilibrium structures. Following a similar protocol established in a previous study Liu and Hanrahan (2019), we first used variable-cell nudged elastic band (VC-NEB) technique to determine the minimum energy paths (MEPs) connecting different phases of HfO2 using the USPEX code Oganov and Glass (2006); Lyakhov et al. (2013); Oganov et al. (2011). The ab initio calculations of force and stress tensors were performed using PBE exchange-correlation functional, consistent with the method used to label structures in the DP-GEN scheme. Specifically, five solid-solid phase transitions relevant to the growth of ferroelectric HfO2 thin films were studied: , , , , and . The energies of structures of identified MEPs were then evaluated with the DP model. Figure 6 compares the DP and DFT energies along the MEPs, showing excellent agreement between DP and DFT with a MAE of 2.2 meV/atom.
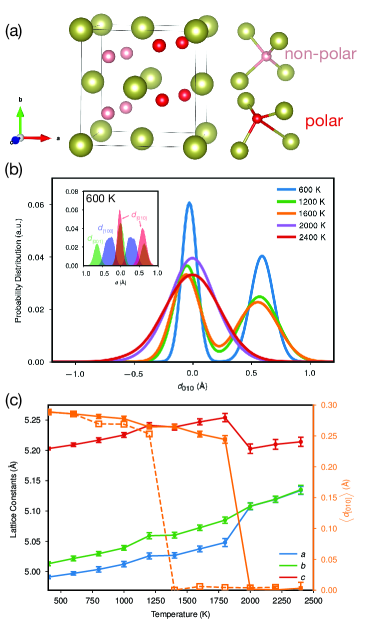
One major focus of this work is to enable MD simulations of the newly discovered ferroelectric HfO2. We further simulate the temperature-driven phase transitions starting with the ferroelectric phase using the DP model and a 6144-atom supercell. The local displacement of the oxygen atom relative to the center of its surrounding Hf4 tetrahedron is used to gauge the local symmetry breaking (Fig. 7a) . Figure 7b shows the temperature dependence of probability distributions of local oxygen displacements along Cartesian axes. We find that at 600 K, the distributions along the [100] and [001] directions are symmetric, whereas the distribution along [010] is asymmetric with one peak centered around zero and another peak centered around 0.6 Å (Fig. 7b inset). This is consistent with the structural origin of ferroelectricity in HfO2 that only half of oxygen atoms are locally displaced along the [010] direction (Fig. 7a). With increasing temperature, the positive peak of distribution shifts toward a lower value, indicating a decrease of total polarization and a displacive phase transition. In the high temperature paraelectric phase (2400 K), the distribution becomes a single peak. Figure 7c shows the temperature dependence of lattice constants and the average value of , which clearly reveals a ferroelectric-to-paraelectric phase transition with the tetragonal phase being the non-polar high-temperature phase, agreeing with experimental observations.
It is well known that the phase transition temperature () predicted with MD will suffer from the supercell size effect. The ferroelectric-paraelectric for single-crystal ferroelectric HfO2 obtained using a 96-atom supercell is 1200 K, comparable with previous ab inito MD simulations using a supercell of the same size Liu et al. (2019); Fan et al. (2019). We confirm that simulations with 6144-atom and 12000-atom supercells yield similar of 2000 K. This highlights the importance of using a large supercell to obtain the intrinsic for ferroelectric HfO2.
III.4 Developing force field beyond pure HfO2
We make a few general comments here regarding the approach to systematically extend the applicability of the DP model of HfO2. It is well known that the ML method works essentially by interpolating the high-dimensional data contained in the training database. Though it is the DP model with optimized network parameters that will be used in practice, we suggest the associated training database is a more fundamental entity which can be used to re-train a new DP model with accuracy similar to the current one or any other ML-based force field if needed. Since the training data is generated with expensive first-principle calculations, making the training database available to the public will greatly facilitate the development of new force fields through community efforts. In this work, we focus on developing a DP model for pure HfO2. Given that extrinsic effects such as dopants and defects can strongly affect the ferroelectric properties of HfO2, it is also desirable to have an accurate and efficient model potential that accounts for these extrinsic effects. Thanks to the ability of deep neural work to faithfully represent complex and highly nonlinear PES, it is expected a DP model with improved transferability can be readily developed by (1) adding new structures with dopants/defects of interests and (2) setting up appropriate exploration runs to generate new structures with dopants/defects. In this spirit, we make our final training database available through a public repository DP Library DPL .
IV Conclusions
In summary, we applied Deep Potential Molecular Dynamics method to develop a force field for HfO2 utilizing a concurrent learning scheme called DP-GEN. The force field is a parameterized deep neural network that maps local atomic environment to atomic energy. Using the model deviation of an ensemble of trained DP models as the indicator for fast labeling not only alleviates the burden of human interventions but also significantly reduces the total cost of first-principles calculations needed to obtain an accurate force field. The accuracy and transferability of the force field are confirmed by comparing a wide range of materials properties (e.g., elastic constants, EoSs, and phonon spetra) computed with the DP model to ab initio results. The DP model can also predict accurately the intrinsic solid-solid transition barriers between different polymorphs of hafnia and capture the main features of temperature-driven phase transitions of the newly discovered ferroelectric phase. We expect the developed DP model will be a useful tool to study the kinetic and dynamical properties of ferroelectric HfO2. The development of a high-fidelity force field of HfO2 demonstrated the ability of DPMD and DP-GEN to deal with materials systems consisted of complex transition metal-oxygen bonds. Finally, we suggest that the training database is a more fundamental entity and its easy access by the public will greatly facilitate the development of ML-based force fields.
V Acknowledgments
JW and SL acknowledge the support from Westlake Foundation. The computational resource is provided by Westlake Supercomputer Center. The work of LZ was supported in part by the Center of Chemistry in Solution and at Interfaces (CSI) funded by the DOE Award de-sc0019394.
References
- Scott (2007) J. F. Scott, Science 315, 954 (2007).
- Huang et al. (2018) W. Huang, W. Zhao, Z. Luo, Y. Yin, Y. Lin, C. Hou, B. Tian, C.-G. Duan, and X.-G. Li, Adv. Electron. Mater. 4, 1700560 (2018).
- Mikolajick et al. (2020) T. Mikolajick, U. Schroeder, and S. Slesazeck, IEEE Trans. Electron Devices 67, 1434 (2020).
- Pinnow and Mikolajick (2004) C.-U. Pinnow and T. Mikolajick, J. Electrochem. Soc. 151, K13 (2004).
- Bondurant (1990) D. Bondurant, Ferroelectrics 112, 273 (1990).
- McAdams et al. (2004) H. McAdams, R. Acklin, T. Blake, X.-H. Du, J. Eliason, J. Fong, W. Kraus, D. Liu, S. Madan, T. Moise, S. Natarajan, N. Qian, Y. Qiu, K. Remack, J. Rodriguez, J. Roscher, A. Seshadri, and S. Summerfelt, IEEE J. Solid-State Circuits 39, 667 (2004).
- Park et al. (2018a) M. H. Park, Y. H. Lee, T. Mikolajick, U. Schroeder, and C. S. Hwang, MRS Commun. 8, 795 (2018a).
- Pešić et al. (2017) M. Pešić, C. Künneth, M. Hoffmann, H. Mulaosmanovic, S. Müller, E. T. Breyer, U. Schroeder, A. Kersch, T. Mikolajick, and S. Slesazeck, J. Comput. Electron. 16, 1236 (2017).
- Böscke et al. (2011) T. S. Böscke, J. Müller, D. Bräuhaus, U. Schröder, and U. Böttger, Appl. Phys. Lett. 99, 102903 (2011).
- Gutowski et al. (2002) M. Gutowski, J. E. Jaffe, C.-L. Liu, M. Stoker, R. I. Hegde, R. S. Rai, and P. J. Tobin, MRS Proceedings 716, B3.2 (2002).
- Cheema et al. (2020) S. S. Cheema, D. Kwon, N. Shanker, R. dos Reis, S.-L. Hsu, J. Xiao, H. Zhang, R. Wagner, A. Datar, M. R. McCarter, C. R. Serrao, A. K. Yadav, G. Karbasian, C.-H. Hsu, A. J. Tan, L.-C. Wang, V. Thakare, X. Zhang, A. Mehta, E. Karapetrova, R. V. Chopdekar, P. Shafer, E. Arenholz, C. Hu, R. Proksch, R. Ramesh, J. Ciston, and S. Salahuddin, Cah. Rev. The. 580, 478 (2020).
- Batra et al. (1973) I. P. Batra, P. Wurfel, and B. D. Silverman, Phys. Rev. B 8, 3257 (1973).
- Wurfel and Batra (1973) P. Wurfel and I. P. Batra, Phys. Rev. B 8, 5126 (1973).
- Ma and Han (2002) T. Ma and J.-P. Han, IEEE Electron Device Letters 23, 386 (2002).
- Luo et al. (2020) Q. Luo, Y. Cheng, J. Yang, R. Cao, H. Ma, Y. Yang, R. Huang, W. Wei, Y. Zheng, T. Gong, J. Yu, X. Xu, P. Yuan, X. Li, L. Tai, H. Yu, D. Shang, Q. Liu, B. Yu, Q. Ren, H. Lv, and M. Liu, Nat. Commun. 11 (2020), 10.1038/s41467-020-15159-2.
- Ohtaka et al. (2004) O. Ohtaka, H. Fukui, T. Kunisada, T. Fujisawa, K. Funakoshi, W. Utsumi, T. Irifune, K. Kuroda, and T. Kikegawa, J. Am. Ceram. Soc. 84, 1369 (2004).
- Park et al. (2015) M. H. Park, Y. H. Lee, H. J. Kim, Y. J. Kim, T. Moon, K. D. Kim, J. Müller, A. Kersch, U. Schroeder, T. Mikolajick, and C. S. Hwang, Adv. Mater. 27, 1811 (2015).
- Huan et al. (2014) T. D. Huan, V. Sharma, G. A. Rossetti, and R. Ramprasad, Phys. Rev. B 90, 064111 (2014).
- Reyes-Lillo et al. (2014) S. E. Reyes-Lillo, K. F. Garrity, and K. M. Rabe, Phys. Rev. B 90, 140103 (2014).
- Sang et al. (2015) X. Sang, E. D. Grimley, T. Schenk, U. Schroeder, and J. M. LeBeau, Appl. Phys. Lett. 106, 162905 (2015).
- Materlik et al. (2015) R. Materlik, C. Künneth, and A. Kersch, J. Appl. Phys. 117, 134109 (2015).
- Batra et al. (2017a) R. Batra, T. D. Huan, J. L. Jones, G. Rossetti, and R. Ramprasad, J. Phys. Chem. C 121, 4139 (2017a).
- Schroeder et al. (2014) U. Schroeder, E. Yurchuk, J. Müller, D. Martin, T. Schenk, P. Polakowski, C. Adelmann, M. I. Popovici, S. V. Kalinin, and T. Mikolajick, Jpn. J. Appl. Phys. 53, 08LE02 (2014).
- Starschich and Boettger (2017) S. Starschich and U. Boettger, J. Mater. Chem. C 5, 333 (2017).
- Park et al. (2017a) M. H. Park, T. Schenk, C. M. Fancher, E. D. Grimley, C. Zhou, C. Richter, J. M. LeBeau, J. L. Jones, T. Mikolajick, and U. Schroeder, J. Mater. Chem. C 5, 4677 (2017a).
- Xu et al. (2017) L. Xu, T. Nishimura, S. Shibayama, T. Yajima, S. Migita, and A. Toriumi, J. Appl. Phys. 122, 124104 (2017).
- Batra et al. (2017b) R. Batra, T. D. Huan, G. A. Rossetti, and R. Ramprasad, Chem. Mater. 29, 9102 (2017b).
- Shiraishi et al. (2016) T. Shiraishi, K. Katayama, T. Yokouchi, T. Shimizu, T. Oikawa, O. Sakata, H. Uchida, Y. Imai, T. Kiguchi, T. J. Konno, and H. Funakubo, Appl. Phys. Lett. 108, 262904 (2016).
- Xu et al. (2016) L. Xu, T. Nishimura, S. Shibayama, T. Yajima, S. Migita, and A. Toriumi, Appl. Phys. Express 9, 091501 (2016).
- Pal et al. (2017) A. Pal, V. K. Narasimhan, S. Weeks, K. Littau, D. Pramanik, and T. Chiang, Appl. Phys. Lett. 110, 022903 (2017).
- Polakowski and Müller (2015) P. Polakowski and J. Müller, Appl. Phys. Lett. 106, 232905 (2015).
- Batra et al. (2016) R. Batra, H. D. Tran, and R. Ramprasad, Appl. Phys. Lett. 108, 172902 (2016).
- Künneth et al. (2017) C. Künneth, R. Materlik, and A. Kersch, J. Appl. Phys. 121, 205304 (2017).
- Park et al. (2017b) M. H. Park, Y. H. Lee, H. J. Kim, T. Schenk, W. Lee, K. D. Kim, F. P. G. Fengler, T. Mikolajick, U. Schroeder, and C. S. Hwang, Nanoscale 9, 9973 (2017b).
- Liu and Hanrahan (2019) S. Liu and B. M. Hanrahan, Phys. Rev. Mater. 3, 054404 (2019).
- Lee et al. (2020) H.-J. Lee, M. Lee, K. Lee, J. Jo, H. Yang, Y. Kim, S. C. Chae, U. Waghmare, and J. H. Lee, Science 369, 1343 (2020).
- Park et al. (2018b) M. H. Park, Y. H. Lee, H. J. Kim, Y. J. Kim, T. Moon, K. D. Kim, S. D. Hyun, T. Mikolajick, U. Schroeder, and C. S. Hwang, Nanoscale 10, 716 (2018b).
- Park et al. (2018c) M. H. Park, Y. H. Lee, T. Mikolajick, U. Schroeder, and C. S. Hwang, Adv. Electron. Mater. 5, 1800522 (2018c).
- Liu et al. (2016) S. Liu, I. Grinberg, and A. M. Rappe, Cah. Rev. The. 534, 360 (2016).
- Li et al. (2019) L. Li, L. Xie, and X. Pan, Rep. Prog. Phys. 82, 126502 (2019).
- Gong et al. (2018) N. Gong, X. Sun, H. Jiang, K. S. Chang-Liao, Q. Xia, and T. P. Ma, Appl. Phys. Lett. 112, 262903 (2018).
- Yoon et al. (2019) S.-J. Yoon, S.-Y. Na, S.-E. Moon, and S.-M. Yoon, J. Vac. Sci. Technol. B 37, 050601 (2019).
- Hoffmann et al. (2019) M. Hoffmann, F. P. G. Fengler, M. Herzig, T. Mittmann, B. Max, U. Schroeder, R. Negrea, P. Lucian, S. Slesazeck, and T. Mikolajick, Cah. Rev. The. 565, 464 (2019).
- Shan et al. (2010) T.-R. Shan, B. D. Devine, T. W. Kemper, S. B. Sinnott, and S. R. Phillpot, Phys. Rev. B 81, 125328 (2010).
- Broglia et al. (2014) G. Broglia, G. Ori, L. Larcher, and M. Montorsi, Model. Simul. Mater. Sci. Eng. 22, 065006 (2014).
- Schie et al. (2017) M. Schie, M. P. Müller, M. Salinga, R. Waser, and R. A. D. Souza, J. Chem. Phys. 146, 094508 (2017).
- Sivaraman et al. (2020) G. Sivaraman, A. N. Krishnamoorthy, M. Baur, C. Holm, M. Stan, G. Csányi, C. Benmore, and Á. Vázquez-Mayagoitia, npj Comput. Mater. 6, 104 (2020).
- Cohen (1992) R. E. Cohen, Nature 358, 136 (1992).
- Phillpot et al. (2007) S. R. Phillpot, S. B. Sinnott, and A. Asthagiri, Annu. Rev. Mater. Res. 37, 239 (2007).
- Liu et al. (2013a) S. Liu, I. Grinberg, H. Takenaka, and A. M. Rappe, Phys. Rev. B 88, 104102 (2013a).
- Liu et al. (2013b) S. Liu, I. Grinberg, and A. M. Rappe, J. Physics.: Condens. Matter 25, 102202 (2013b).
- Smith et al. (2017) J. S. Smith, O. Isayev, and A. E. Roitberg, Chem. Sci. 8, 3192 (2017).
- Manzhos and Carrington (2008) S. Manzhos and T. Carrington, J. Chem. Phys. 129, 224104 (2008).
- Bartók et al. (2013a) A. P. Bartók, M. J. Gillan, F. R. Manby, and G. Csányi, Phys. Rev. B 88 (2013a).
- Morawietz et al. (2016) T. Morawietz, A. Singraber, C. Dellago, and J. Behler, Proc. Natl. Acad. Sci. U. S. A. 113, 8368 (2016).
- Ko et al. (2019) H.-Y. Ko, L. Zhang, B. Santra, H. Wang, W. E, R. A. DiStasio Jr, and R. Car, Mol. Phys. 117, 3269 (2019).
- Eshet et al. (2010) H. Eshet, R. Z. Khaliullin, T. D. Kühne, J. Behler, and M. Parrinello, Phys. Rev. B 81 (2010).
- Botu and Ramprasad (2015) V. Botu and R. Ramprasad, Phys. Rev. B 92 (2015).
- Zhang et al. (2020) Y. Zhang, H. Wang, W. Chen, J. Zeng, L. Zhang, H. Wang, and W. E, Comput. Phys. Commun. 253, 107206 (2020).
- Andolina et al. (2020) C. M. Andolina, P. Williamson, and W. A. Saidi, J. Chem. Phys. 152, 154701 (2020).
- Zhang et al. (2019) L. Zhang, D.-Y. Lin, H. Wang, R. Car, and W. E, Phys. Rev. Mater. 3, 023804 (2019).
- Jiang et al. (2020) W. Jiang, Y. Zhang, L. Zhang, and H. Wang, arXiv preprint arXiv:2008.11795 (2020).
- Sanville et al. (2008) E. Sanville, A. Bholoa, R. Smith, and S. D. Kenny, J. Phys.: Condens. Matter 20, 285219 (2008).
- Behler et al. (2008) J. Behler, R. Martonák, D. Donadio, and M. Parrinello, Phys. Status Solidi B 245, 2618 (2008).
- Babaei et al. (2019) H. Babaei, R. Guo, A. Hashemi, and S. Lee, Phys. Rev. Mater. 3 (2019).
- Bartók et al. (2018) A. P. Bartók, J. Kermode, N. Bernstein, and G. Csányi, Phys. Rev. X 8 (2018).
- Sosso et al. (2012) G. C. Sosso, G. Miceli, S. Caravati, J. Behler, and M. Bernasconi, Phys. Rev. B 85 (2012).
- Thomas et al. (2019) J. C. Thomas, J. S. Bechtel, A. R. Natarajan, and A. V. der Ven, Phys. Rev. B 100 (2019).
- Behler and Parrinello (2007) J. Behler and M. Parrinello, Phys. Rev. Lett. 98, 146401 (2007).
- Bartók et al. (2013b) A. P. Bartók, R. Kondor, and G. Csányi, Phys. Rev. B 87 (2013b).
- Zhang et al. (2018) L. Zhang, J. Han, H. Wang, R. Car, and W. E, Phys. Rev. Lett. 120 (2018).
- (72) L. Zhang, J. Han, H. Wang, W. A. Saidi, R. Car, and W. E, Advances in Neural Information Processing Systems 2018, 4436.
- Zeng et al. (2019) J. Zeng, L. Cao, M. Xu, T. Zhu, and J. Z. Zhang, arXiv preprint arXiv:1911.12252 (2019).
- Andrade et al. (2020) M. F. C. Andrade, H.-Y. Ko, L. Zhang, R. Car, and A. Selloni, Chem. Sci. 11, 2335 (2020).
- Dai et al. (2020) F.-Z. Dai, B. Wen, Y. Sun, H. Xiang, and Y. Zhou, J. Mater. Sci. Technol. 43, 168 (2020).
- Wang et al. (2018) H. Wang, L. Zhang, J. Han, and W. E, Comput. Phys. Commun. 228, 178 (2018).
- Kresse and J (1996) G. Kresse and F. J, Phys. Rev. B 54, 11169 (1996).
- Kresse and Furthmüller (1996) G. Kresse and J. Furthmüller, Comp. Mater. Sci. 6, 15 (1996).
- Blochl (1994) P. E. Blochl, Phys. Rev. B 50, 17953 (1994).
- Kresse and Joubert (1999) G. Kresse and D. Joubert, Phys. Rev. B 59, 1758 (1999).
- Perdew et al. (1996) J. P. Perdew, K. Burke, and M. Ernzerhof, Phys. Rev. Lett. 77, 3865 (1996).
- Plimpton (1995) S. Plimpton, J. Comput. Phys. 117, 1 (1995).
- Oganov and Glass (2006) A. R. Oganov and C. W. Glass, J. Chem. Phys. 124, 244704 (2006).
- Lyakhov et al. (2013) A. O. Lyakhov, A. R. Oganov, H. T. Stokes, and Q. Zhu, Comput. Phys. Commun. 184, 1172 (2013).
- Oganov et al. (2011) A. R. Oganov, A. O. Lyakhov, and M. Valle, Acc. Chem. Res. 44, 227 (2011).
- Liu et al. (2019) J. Liu, S. Liu, L. H. Liu, B. Hanrahan, and S. T. Pantelides, Phys. Rev. Applied 12, 034032 (2019).
- Fan et al. (2019) P. Fan, Y. K. Zhang, Q. Yang, J. Jiang, L. M. Jiang, M. Liao, and Y. C. Zhou, J. Phys. Chem. C 123, 21743 (2019).
- (88) “http://dplibrary.deepmd.net,” .
- Togo and Tanaka (2015) A. Togo and I. Tanaka, Scr. Mater. 108, 1 (2015).
| () | () | () | |
|---|---|---|---|
| 5.138 | 5.190 | 5.322 | |
| 5.146 | 5.154 | 5.352 | |
| 5.266 | 10.093 | 5.077 | |
| 5.265 | 10.094 | 5.078 | |
| 5.266 | 5.047 | 5.077 | |
| 5.265 | 5.047 | 5.078 | |
| 5.162 | 5.181 | 4.920 | |
| 5.153 | 5.230 | 4.956 | |
| 4.850 | 5.833 | 16.032 | |
| 4.824 | 5.839 | 16.032 | |
| 3.434 | 5.179 | 3.795 | |
| 3.456 | 5.254 | 3.632 | |
| 5.074 | 5.074 | 5.228 | |
| 5.075 | 5.075 | 5.279 | |
| 5.071 | 5.071 | 5.071 | |
| 5.067 | 5.067 | 5.067 |
| 337.59 | 341.01 | 341.78 | 212.55 | 255.83 | 371.37 | 366.52 | 566.83 | |
| 371.63 | 340.64 | 340.63 | 273.39 | 214.19 | 340.66 | 366.00 | 571.17 | |
| 390.90 | 395.94 | 395.93 | 212.52 | 298.81 | 351.82 | 366.51 | 566.77 | |
| 378.18 | 398.00 | 398.00 | 307.07 | 268.04 | 281.57 | 366.00 | 571.17 | |
| 289.95 | 390.88 | 390.98 | 335.16 | 358.22 | 338.51 | 283.58 | 566.86 | |
| 369.25 | 373.00 | 372.99 | 357.91 | 344.82 | 335.12 | 241.33 | 571.17 | |
| 165.01 | 129.59 | 130.43 | 225.53 | 167.25 | 98.31 | 233.50 | 96.60 | |
| 160.44 | 129.32 | 129.32 | 141.66 | 148.92 | 62.80 | 227.72 | 99.52 | |
| 104.46 | 95.06 | 95.38 | 166.47 | 152.60 | 252.60 | 60.08 | 96.60 | |
| 131.64 | 81.23 | 81.23 | 157.19 | 141.12 | 285.71 | 59.18 | 99.52 | |
| 162.15 | 126.44 | 126.60 | 142.04 | 126.20 | 176.57 | 60.07 | 96.54 | |
| 160.53 | 124.77 | 124.77 | 166.95 | 108.44 | 112.87 | 59.18 | 99.52 | |
| 81.51 | 86.31 | 86.40 | -71.27 | 92.58 | -0.39 | 7.87 | 72.26 | |
| 104.31 | 88.65 | 88.65 | -15.38 | 85.26 | 19.90 | 33.58 | 65.08 | |
| 94.55 | -31.24 | -31.17 | -69.80 | 119.52 | 161.71 | 7.87 | 72.25 | |
| 89.49 | -29.56 | -29.56 | -64.77 | 110.51 | 182.11 | 33.58 | 65.08 | |
| 126.44 | 109.07 | 109.54 | 127.28 | 129.09 | 74.37 | 169.99 | 72.26 | |
| 116.85 | 115.00 | 115.00 | 125.49 | 131.31 | 48.54 | 182.65 | 65.08 | |
| 221.30 | 203.78 | 204.14 | 205.83 | 200.65 | 235.29 | 191.30 | 253.33 | |
| 224.69 | 198.47 | 198.47 | 210.68 | 180.48 | 208.35 | 185.75 | 254.77 | |
| 137.40 | 111.58 | 81.34 | 12.32 | 84.61 | 99.36 | 84.71 | 82.75 | |
| 124.62 | 106.26 | 91.78 | 40.57 | 86.57 | 93.99 | 86.57 | 83.18 | |
| 349.09 | 286.57 | 213.74 | 36.24 | 222.97 | 255.85 | 223.24 | 222.20 | |
| 321.44 | 275.36 | 236.40 | 114.38 | 226.75 | 240.26 | 226.75 | 220.22 |