Green valley galaxies in the cosmic web: internal versus environmental quenching
Abstract
We analyze the SDSS data to classify the galaxies based on their colour using a fuzzy set-theoretic method and quantify their environments using the local dimension. We find that the fraction of the green galaxies does not depend on the environment and of the galaxies at each environment are in the green valley depending on the stellar mass range chosen. Approximately of the green galaxies at each environment host an AGN. Combining data from the Galaxy Zoo, we find that of the green galaxies are spirals and are ellipticals at each environment. Only of green galaxies exhibit signs of interactions and mergers, have dominant bulge, and host a bar. We show that the stellar mass distributions for the red and green galaxies are quite similar at each environment. Our analysis suggests that the majority of the green galaxies must curtail their star formation using physical mechanism(s) other than interactions, mergers, and those driven by bulge, bar and AGN activity. We speculate that these are the massive galaxies that have grown only via smooth accretion and suppressed the star formation primarily through mass driven quenching. Using a Kolmogorov-Smirnov test, we do not find any statistically significant difference between the properties of green galaxies in different environments. We conclude that the environmental factors play a minor role and the internal processes play the dominant role in quenching star formation in the green valley galaxies.
1 Introduction
One of the most coveted goals of cosmology is understanding the formation and evolution of galaxies in the Universe. Galaxy surveys (e.g. 2DFGRS [1]; SDSS [2]) over the last few decades have measured the properties of millions of galaxies to unprecedented accuracy. The observed galaxy properties such as colour [3, 4, 5, 6], star formation rate and stellar age [7], bulge to disc ratio [7], gas to stellar mass ratio [8] show a bimodal character. The galaxy colour is relatively easy to calculate. It characterizes the stellar population of a galaxy. The distribution of the optical colour show two distinct peaks corresponding to two galaxy populations which are often referred to as the ‘red sequence’ and the ‘blue cloud’. The two population show significant overlap and the relatively shallow and flat region between the two peaks is termed as ‘green valley’ [9]. The galaxies in the blue cloud are predominantly the star-forming population with disk-like morphology, younger stellar population and lower stellar mass whereas the galaxies in the red sequence are primarily the quiescent galaxies with a dominant bulge component, older stellar population and higher stellar mass [3, 7, 10, 6]. The morphology of a galaxy correlates well with its stellar population. However, morphological transformations alone, can not explain the bimodal distribution of galaxy colour. Studies with Galaxy Zoo [11] reveal that a significant number of ellipticals are contained in the blue cloud [12] and a large number of spirals are found in the red sequence [13].
Understanding the origin of the bimodal nature of the colour distribution and its evolution holds the important keys to galaxy formation and evolution. Different semi-analytic models have been used to reproduce the observed bimodal distribution of galaxy colour [14, 15, 17, 18, 16, 19, 20, 21] and gain insight into the physical processes leading to bimodality. Observations suggest that the bimodality in galaxy colour exists out to a redshift of [22, 23, 24, 25]. Besides, the number of massive red galaxies at fixed stellar mass has been found to increase steadily since [22, 26]. The steady increase in the number of red galaxies and their stellar mass indicates that this could happen if the galaxies from the blue cloud migrate to the red sequence via quenching of star formation. The increase in the red stellar mass can be also achieved by the merger of already quenched less massive galaxies. Further, it has been reported that the cosmic star formation shows a sharp decline between to [27]. These observations point towards a significant evolution in the galaxy properties in the recent past, which may have played a pivotal role in the observed bimodality of their distributions.
The current paradigm of galaxy formation owes its root to a few seminal papers from the seventies [28, 29, 30, 31]. The baryons are believed to be shock heated to the halo virial temperature after they fall into the dark matter potential well. The baryons in the inner region of the halo then radiatively cool and settle down on a dynamical time scale to form rotationally supported disk galaxies. These galaxies inside the dark matter halos then evolve either in isolation or through the interactions with their environment. Both the nature (secular) versus nurture (environment) scenario of galaxy evolution, are capable of producing observed bimodality in the galaxy colour distribution.
The secular evolution of a galaxy is not limited to mere aging of its stellar population and there are many internal physical processes (e.g. mass quenching, morphological quenching, bar quenching) which can play a significant role in the reduction of star formation in a disk galaxy. Kauffmann et al. [7] find that the galaxies with a mass less than show active star formation, lower surface mass density and disk-like morphology whereas those with masses larger than this critical value are generally quiescent galaxies with bulge dominated morphology and higher surface mass density. This critical stellar mass corresponds to a critical halo mass of which can be associated with the observed bimodality. The theoretical analysis [32] and studies with hydrodynamical simulations [33, 34, 35, 36, 37] suggest that this critical mass is associated with a transition from ‘cold mode’ to ‘hot mode’ of accretion. Simulations show that the cooling time is shorter than the dynamical time in halos with mass less than and they can accrete cold gas through quasi-spherical filamentary inflows maintaining their star formation. But in the massive halos, cooling time is way longer where a stable shock expands to the virial radius producing a hot medium at the virial temperature, which prevents any cold streams from the inter-galactic medium to penetrate through the hot gas without getting heated. So the virial shock heating of the halo gas in massive halos with mass greater than can suppress the supply of cold gas required for star formation. This quenching of star formation in high mass halos is known as the ‘mass quenching’. We refer to this halo quenching as mass driven quenching throughout this work. Simulations suggest that the mass quenching alone can not maintain long-term shutdown of star formation as the shock heated hot gas eventually cool down via radiation and then collapse at the centres of these halos to form stars [38]. An additional heating source such as radio mode AGN feedback can prevent such cooling and maintain the high temperature of the halo gas [39, 40, 41]. The gravitational heating due to clumpy accretion at the centre of the halos [38, 42, 43] can also prevent cooling and star formation. So a coupling of the virial shock heating with these additional energy feedback processes can shutdown the star formation in dark matter halos above the critical mass.
The ‘bar quenching’ and ‘morphological quenching’ are some of the other internal processes which can shut down the star formation in a galaxy. The presence of stellar bars in disk galaxies can suppress star formation [44, 45, 46, 47]. The bar-induced torque can transfer gas from the outskirts to the centre of the galaxy leading to the buildup of a bulge [48, 49, 50, 51]. The central bulge produces a deeper potential well which can stabilize the disk against collapse [52]. The presence of the bulge is also known to trigger AGN activity [53] and nuclear star formation turning the inner kilopersec region devoid of any cold gas [54, 55, 45].
Besides these internal processes, the environment of a galaxy can also play a significant role in the quenching of star formation. Major mergers of galaxies can transform spirals to ellipticals [56, 57]. They can also facilitate the ejection of interstellar medium through starburst and AGN or shock-driven winds [58, 59, 60] thereby quenching star formation in those galaxies. Some of the other important routes for environmental quenching are the ram pressure stripping of cold gas [61], galaxy harassment in clusters [62, 63], strangulation in galaxy-group interactions [61, 64] and starvation due to truncation of gas supply [65, 66, 67].
The blue galaxies evolve to red galaxies via quenching of star formation. The galaxies with intermediate properties between blue and red galaxies lie in the green valley undergoing such a transition. It is important to understand the primary physical mechanisms responsible for such transition. The red galaxies are preferably found in the denser region [68, 69] which suggests the role of environment in quenching. Some studies suggest that AGN feedback plays an important role in quenching star formation in the transitional green valley population [70, 71, 72, 73]. The analysis of Galaxy Zoo by Schawinski et al.[74] suggests that quenching in green valley galaxies require the gas reservoir destruction caused by starburst and AGN feedback in major mergers. Alternatively, starving galaxies of the cold gas supply and exhaustion of the remaining gas can also initiate such quenching. Lin et al. [75] find lower star formation efficiency in the green valley galaxies from the study of their cold molecular gas content, which indicates that complete removal of cold gas supply is not necessary for quenching in these galaxies. A comprehensive review of the green valley galaxies can be found in Salim [76]. Coenda et al. [77] study the properties of green valley galaxies in fields, groups and clusters using SDSS and find that there is a clear environmental dependence of external quenching mechanisms in the green valley galaxies. Jian et al. [78] study the redshift evolution of green valley galaxies in different environments to find a mild evolution in the environmental dependence which suggests that slow quenching mechanisms are operating in denser environments since .
The timescales associated with the different quenching mechanisms vary widely spanning from few hundred Myr to 1 Gyr or more. The morphological quenching, bar quenching and strangulation belong to slow modes of quenching which can extend to 1-2 Gyr [52, 65, 64] whereas the mergers and ram pressure stripping can halt the star formation on a time scale of less than 1 Gyr [61, 79]. An analysis of the EAGLE cosmological simulation by Trayford et al. [19] suggests that the galaxies require Gyr to cross the green valley regardless of the quenching mechanism.
The well known morphology-density relation [80, 81, 82] and SFR-density relation [83, 84, 85] suggest that environment plays an important role in deciding the galaxy properties and their evolution. The galaxies are organized in an interconnected network of filaments, sheets and clusters encircled by voids, which is often referred to as the “cosmic web” [86]. Studies with cosmological N-body simulations show that the properties such as mass, shape and angular momentum of dark matter halos are influenced by their geometric environments in the cosmic web [87]. The clustering of the dark matter halos in the cosmic web is also known to depend on their assembly history [88, 89, 90, 91]. Several observational studies [92, 93, 94] claim evidence of assembly bias. Since the cosmic web can influence both the properties and clustering of dark matter halos, it can also play a significant role in the formation and evolution of galaxies. Many earlier studies [95, 96, 97, 98, 99, 100] with observational data find a significant correlation between galaxy properties and large-scale environment. Pandey & Sarkar [101] analyze data from Galaxy Zoo and find that a synergic interaction between the morphology of the galaxies and their large-scale environments persists at least up to . Using SDSS, Sarkar & Pandey [102] show that the mutual information between morphology and large-scale environment are statistically significant at confidence level. A recent analysis by Bhattacharjee et al. [103] show that conditioning on stellar mass does not provide a complete explanation of the mutual information between morphology and the large-scale environment. Pandey & Sarkar [104] analyze the data from SDSS to find that at a fixed density, the fraction of red and blue galaxies are sensitive to the geometric environments of the cosmic web.
The SDSS [2] is the largest redshift survey to date. It provides the photometric and spectroscopic information of millions of galaxies which allows us to carry out statistical analysis of the data and address many important issues related to galaxy formation and evolution. The galaxies in the green valley hold important clues about galaxy evolution. It is important to understand the role of internal and external influences on the suppression of star formation in the green valley galaxies. In the present work, we plan to study the fraction of green galaxies and their possible routes of quenching in different geometric environments of the cosmic web. As mass plays an important role in quenching, the environmental dependence of the fractions should be investigated at fixed stellar mass. Analysis in different mass bins may help us to identify the influence of the environments on quenching. It is also well known that the presence of a dominant bulge, a bar or AGN activity can quench star formation in a galaxy [105, 109, 106, 107, 108, 44, 47]. We would like to investigate the relative importance of these quenching agents in different environments of the cosmic web. It is also important to compare the distributions of the stellar mass, star formation rate and star formation history of the green valley galaxies in different geometric environments to understand the role of environments in deciding the properties of green galaxies. We also address if the length scales associated with the host environments affect the galaxies in the green valley.
Recently Pandey [121] propose a fuzzy-set theoretic method for classification of galaxies based on their colour. We use this method to select the green valley galaxies for the present analysis. We quantify the geometric environments of the galaxies using their local dimension [124]. Our primary goal in this work is to understand the relative importance of internal processes and external environments for the transitional green valley population.
The paper is organised as follows, we describe the data in Section 2, the method of analysis in Section 3, discuss the results in Section 4 and present our conclusions in Section 5.
2 SDSS Data
The Sloan Digital Sky Survey (SDSS) is a multi-band photometric and spectroscopic redshift survey that uses a dedicated 2.5 m telescope at Apache Point Observatory in New Mexico to measure the spectra and images of millions of galaxies over roughly one third of the sky. Gunn et al. [110] describe the technical details of the SDSS photometric camera. The construction, design and performance of the SDSS telescope is described in Gunn et al. [111]. The algorithm for selecting the SDSS main sample for spectroscopy is provided in Strauss et al. [2]. A technical summary of the SDSS is outlined in York et al. [112].
We use the publicly available data from SDSS DR16 [113] for the present analysis. We retrieve the required data from Casjobs 111https://skyserver.sdss.org/casjobs/ using Structured Query Language. We have downloaded the spectroscopic and photometric information of galaxies from SpecPhotoAll table
using the following cuts: , , , where is the redshift, is the -band Petrosian magnitude, and are right ascension and declination respectively. We also download the stellar mass and star formation rate of these galaxies from table [114], K correction from table and break strength D4000 [115] from table [116]. We use table derived from MPA-JHU spectroscopic catalogue [116, 117] to identify the AGNs classified on the basis of BPT emission line diagram. The SDSS is a fibre based survey and the aperture effects are important in the measurement of these spectroscopic properties. These biases have been properly taken into account in these measurements using aperture correction schemes described in Brinchmann et al. [116]. The galaxies with AGN activity are flagged as in the table . For morphological classification we use table derived from Galaxy Zoo [11]. We identify the elliptical and spiral galaxies from this table as those which have their and flag set to 1 (with debiased vote fraction ) respectively. Further we have downloaded the information of internal reddening E(B-V) for each galaxies from table which is based on publicly available Gas AND Absorption Line Fitting (GANDALF) [118] and penalised PIXEL Fitting (pPXF) [119]. We combine these tables and apply the above mentioned cuts which provides us with 321741 galaxies. We construct a volume limited sample from this data by restricting the K-corrected and extinction corrected -band absolute magnitude to which corresponds to a redshift cut of . The resulting volume limited sample consists of 93187 galaxies. Throughout this analysis, we use CDM cosmological model with and [120].
3 METHOD OF ANALYSIS
3.1 Classifying the red, blue and green galaxies using fuzzy set theory
We classify the galaxies as red, blue and green using a fuzzy set theory based method recently proposed in [121]. The method is described in detail in [121]. Here we outline the basic idea underlying this method.
A fuzzy set is defined by a set of ordered pairs [122],
| (3.1) |
where is the Universal set and is the membership function of the fuzzy set . The membership function maps the elements of the Universal set to real numbers in . It provides the possibility of being member of the fuzzy set . In other words, it measures the degree of membership of a particular element in the fuzzy set.
In reality, the galaxies can not be strictly classified as red, blue or green based on their colours. Such a classification is solely motivated by the bimodal distribution of the galaxy colour. In any such classification, it is important to differentiate between the redder galaxies with a reduced star-formation activity and that are dusty. This requires the observed colours to be corrected for dust attenuation. We correct the observed colour using the internal reddening E(B-V) for each galaxies.
We define the fuzzy set corresponding to redness of all galaxies in the volume limited sample as,
| (3.2) |
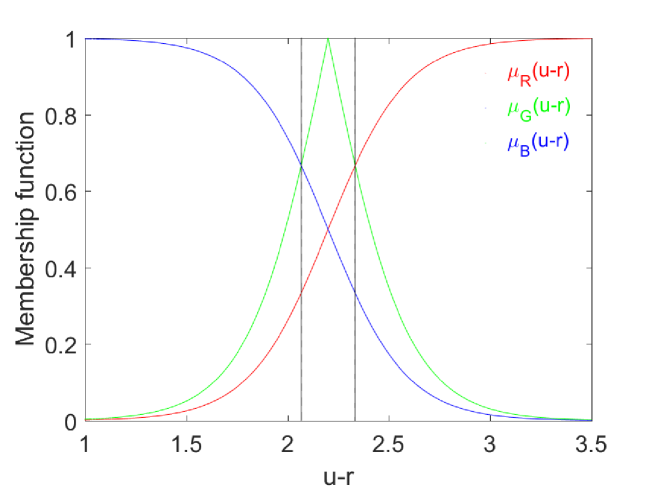
where is the Universal set of dust corrected colour. The membership to the fuzzy set is described with a sigmoidal function [121],
| (3.3) |
Here and are constants. We choose and as specified in [121]. The choice of the sigmoidal membership function is based on the bimodal nature of the colour distribution. The two peaks of the bimodal distribution corresponds to the ‘blue cloud’ and ‘red sequence’. The parameters and respectively denote the crossover point of the fuzzy set and the slope at the crossover point. The fuzzy set has the maximum uncertainty at the crossover point and the choice of is motivated by the fact that the two distributions corresponding to the blue cloud and red sequence merge together at . The value of is chosen so as to ensure that the galaxy with largest and smallest colour respectively have their membership function and in the fuzzy set . Once the fuzzy set for ‘redness’ is defined, the fuzzy set for ‘blueness’ can be simply obtained by taking a fuzzy complement of set . The membership function of the fuzzy set is defined as,
| (3.4) |
The fuzzy set for ‘greenness’ can be defined by taking a fuzzy intersection of and . The membership function of the fuzzy set is defined as,
| (3.5) |
Here denotes the minimum operator. The fuzzy set has the maximum height of at the crossover point. The multiplication with a factor 2 ensure that the galaxies with colour are maximally green with a membership function of 1 (Figure 1).
We classify those galaxies as green for which dominates and . The red and blue galaxies are also defined in a similar manner. In the present analysis, we find that the galaxies with are green, are blue and are red (Figure 1). These cuts provide us with 45700 red, 34662 blue and 12825 green galaxies.
To study the detailed morphology of green galaxies, we further cross match their using the table derived from Galaxy Zoo 2 [123]. We obtain the information regarding the presence of bulge, bar, disturbed, irregular or merger features in the green galaxies in our sample. We only consider the classifications with a debiased vote fraction greater than in each case. The cross matching yields the required information for 8931 out of 12825 green galaxies.
3.2 Quantifying the environment of galaxies with the local dimension
The galaxies reside in different types of geometric environments in the cosmic web. We quantify the geometric environment of a galaxy using the local dimension [124]. The local dimension of a galaxy is simply based on the number counts of galaxies within a sphere of radius centered around it. The number count is expected to scale as,
| (3.6) |
where is the local dimension and A is a constant. We vary the radius of the measuring sphere over a range of length scales . All the galaxies for which the radius of the measuring sphere can be varied in this range and there are at least 10 galaxies within the two concentric spheres of radius and , are included in the analysis. For each valid centers, we fit the measured number counts within and to Equation 3.6. The best fit values of A and are determined using a least-square fitting. We also estimate the associated value using the fitted and observed values of . We further restrict our analysis to only those centers for which chi-square per degree of freedom [125]. We consider throughout the present analysis. We have chosen and to probe the geometric environments of galaxies on two different length scales. The geometric environment around a galaxy within length scale range is characterized by its local dimension . The galaxies residing at the center of a straight filament are expected to have a local dimension of . A local dimension of would represent the galaxies lying within a sheet-like structure whereas the galaxies with are expected to be distributed homogeneously in a three dimensional volume. The cosmic web is an interconnected complex network of different morphological components which vary widely in their shapes and sizes. Very often, the measuring sphere may include multiple types of morphological components (e.g. a filament and a sheet) leading to intermediate values of local dimension . We classify the galaxies belonging to different types of geometric environments by assigning a specific range of local dimension to each class (Table 1). In this classification, the -type galaxies are either located near the center of straight filaments or they are part of short tendrils of galaxies which links filaments and penetrates into voids [126]. The -type galaxies inhabit sheet-like environments and the -type galaxies mostly belong to fields. In a recent work, Pandey & Sarkar [104] explored the fraction of red and blue galaxies in different environments and reported a higher fraction of red galaxies in filaments than sheets at all luminosities. In the same work, they show that the galaxies with -type environment mostly resides in straight filaments whereas those with and -type environments are primarily associated with the sheetlike and field environments. The distributions of , and -type galaxies in the SDSS were shown in Figure 3 of that paper. The galaxies in the class represent the geometric environment which are intermediate between filaments and sheets. Similarly the galaxies of -type populate the intervening regions between sheets and fields.The local dimension of a galaxy would also depend on the length scales considered in the analysis. Keeping this in mind, we have carried out our analysis on two different length scale ranges.
We identify the green valley population using the fuzzy set theory method described in Section 2. We study the abundance and different properties of the green galaxies in different geometric environments of the cosmic web. We estimate the errorbars from 10 jackknife samples prepared from the data. The jackknife samples are prepared by randomly discarding galaxies from the original volume limited sample.
It may be noted that the local dimension can not be calculated for all the galaxies in our volume limited sample. Also the number of galaxies for which the local dimension can be calculated would decrease with the increasing length scales. We find that the local dimension for 36031 red, 27482 blue and 10136 green galaxies can be computed at whereas at , the local dimension can be computed for 14441 red, 11591 blue and 4207 green galaxies.
3.3 Testing the differences in stellar mass, SFR and stellar age of green galaxies in different environments with the Kolmogorov-Smirnov test
If environment plays a significant role in the transition of green valley galaxies then the distributions of their properties should not be same in different environments. For any given property of green galaxy, we compare the cumulative distributions in two different environments with the two-sample Kolmogorov-Smirnov (KS) test. The KS test does not make any assumptions about the distributions. The null hypothesis associated with the test assumes that the chosen property of the green galaxies from different environments are actually sampled from identical distributions. We define the supremum difference between the two cumulative distribution functions as,
| (3.7) |
where and are the cumulative distribution functions of the chosen property () of the green galaxies at the bin in type-1 and type-2 environments respectively. Here the properties that we have chosen are the stellar mass, star formation rate and stellar age. The type-1 and type-2 can be any environments out of , , , and . We have and denotes the supremum of all the () differences such that .
The critical value of the supremum difference associated with a given significance level () is given by,
| (3.8) |
Here and are the number of green galaxies in type-1 and type-2 environments respectively. When , we can reject the null hypothesis at a significance level . The null hypothesis can be tested at different significance level to find if the distribution of a given property of green galaxies are significantly different in the two separate environments considered.
| Local dimension | Geometric environment |
|---|---|
4 Results
4.1 Fractions of red, blue and green galaxies in different environments
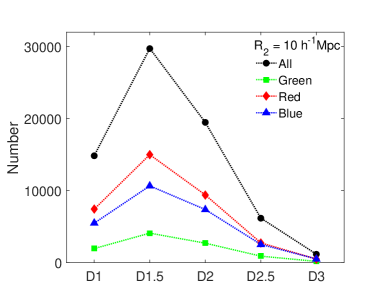
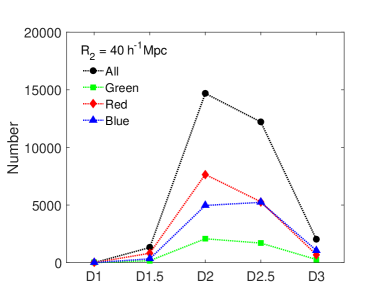
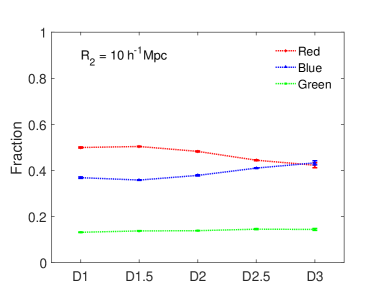
We show the number of red, blue and green galaxies available in different environments of the cosmic web in the top two panels of Figure 2. The top left and right panel of this figure respectively correspond to and . The top left panel shows that the number of galaxies for each class peaks at local dimension of . This implies that the most abundant structures on length scales of have a morphology which is intermediate between filaments () and sheets (). These structures could represent the curved filaments or the intersecting regions between filaments and sheets. The number of galaxies in different classes peak at the local dimension of in the top right panel which indicates that the cosmic web is dominated by the sheet-like patterns when analyzed on a length scale of . There is a clear shift of the location of the peak with increasing length scales which suggests that there is a gradual transition of the local dimension of the morphological patterns in the cosmic web with increasing length scales. The fraction of red, blue and green galaxies in different environments for and are respectively shown in the two bottom panels of Figure 2. The results suggest that the fraction of red galaxies decreases with the increasing local dimension of their host environment. We see a reverse trend for the blue galaxies. These trends were reported earlier in a paper by [104]. Here, we would like to make it clear that these results in Figure 2 are shown here only for the sake of completeness. In the present work, we are primarily interested in the green valley galaxies. We would like to understand the relative importance of internal physical processes and external environments in driving the transition in green valley galaxies.
We also show the fraction of green galaxies in different geometric environments of the cosmic web in the two bottom panels of Figure 2. We find that galaxies in each geometric environment are green. The fraction of green galaxies are nearly independent of the local dimension of their host environments.
Mass of a galaxy plays an important role in quenching star formation. The star formation is quenched in galaxies above a critical mass. The massive galaxies are more common in high density environments. It is known that the geometric environments with smaller local dimension have higher local densities [104]. In general, filaments are denser than sheets and the sheets are denser than the fields. So a higher fraction of red galaxies in filaments than sheets and fields may simply arise due to a higher abundance of more massive galaxies in filaments compared to the other geometric environments. A similar argument applies for the blue galaxies which have a relatively lower mass and are more abundant in low density environments with higher local dimension. Thus a higher fraction of galaxies are expected to be mass quenched in environments with smaller local dimension. The green galaxies are intermediate between red and blue galaxies and it is interesting to see that the fraction of green galaxies is nearly independent of environment in Figure 2.
4.2 Mass dependence of the fractions of red, blue and green galaxies in different environments
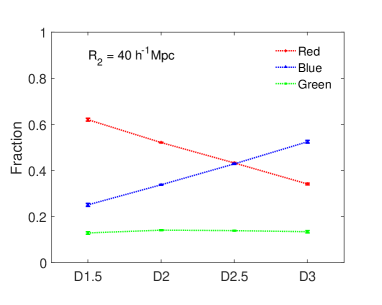
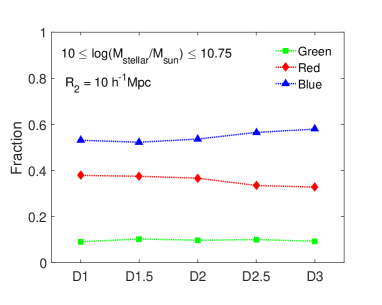
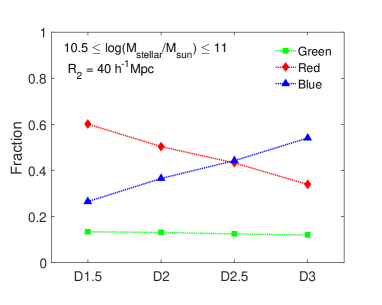
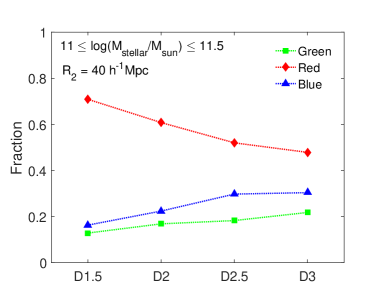
In order to understand the role of mass quenching in different environments, we divide the red, blue and green galaxies into two different mass bins and study their fractions in each environment. The top left and bottom left panels of Figure 3 show the results in two different mass bins for . The top left panel of Figure 3 shows that at lower masses, a higher fraction of blue galaxies are present at each environment. This is opposite to what is observed in Figure 2. Here the fraction of blue galaxies also increases with increasing local dimension as noted earlier in Figure 2. The fraction of red galaxies are smaller than blue galaxies at each environment and the red fraction decreases with the increasing local dimension as before. Only galaxies at each environment are green and the fraction of green galaxies is independent of environment in the lower mass bin. Now we shift our attention to the bottom left panel where the fractions are shown for the galaxies in the higher mass bin. We note that at higher mass bin, each environment is dominated by the red galaxies. The fractions of red galaxies are now significantly higher ( times) compared to blue galaxies at each environment. The fraction of green galaxies ( in this case) also increases in the higher mass bin which again remains nearly independent of environment. We observe a change in the green fraction in this case due to the fact that all the galaxies in the higher mass bin have masses above the critical mass () required for mass quenching whereas a significant number of galaxies in the lower mass bin have masses below this critical value. The result suggest that mass quenching may play an important role in suppressing star formation in the green valley galaxies.
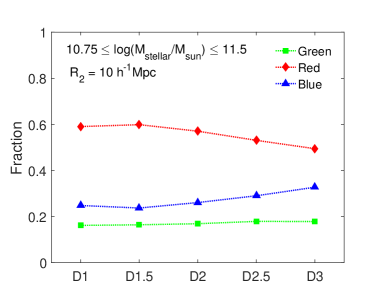
The corresponding results for are shown in the top right and bottom right panels of Figure 3. We see that the red galaxies dominate each environment in both the mass bins. Noticeably at higher masses, the fraction of blue galaxies show a decrease in each environment. The decrease is most pronounced for the field galaxies (-type). This implies that there are more galaxies yet to be mass quenched in the low density regions as compared to the high density environments. Increase in red fraction and decrease in blue fraction in all environments suggest that the galaxies with higher masses are equally likely to be quenched irrespective of their environment. Once again, we observe that the fraction of green galaxies remains within in all the environments. Only a mild increase in the fraction of green galaxies are observed in the higher mass bin. It may be noted that the stellar mass of each galaxies in both the mass bins are greater than the critical mass.
Our analysis shows that the fraction of already quenched red galaxies depends on environment at fixed stellar mass, and also depends on stellar mass at fixed environment (Figure 3). The sensitivity of the red fractions to the stellar mass and the environment suggests that besides the mass quenching, the external influences of the environment may also play a significant role in quenching the star formation in these galaxies [127]. The green valley galaxies are in the process of being quenched and in principle both the environment and mass are capable of quenching them. But the top left and bottom left panels of Figure 3 show that at a fixed stellar mass, the fraction of green galaxies is nearly independent of environment whereas at a fixed environment the fraction increases from to in any given environment. This indicates that quenching in the green valley galaxies are largely driven by their mass and other internal physical properties rather than their external environment.
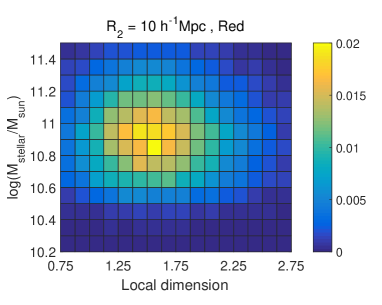
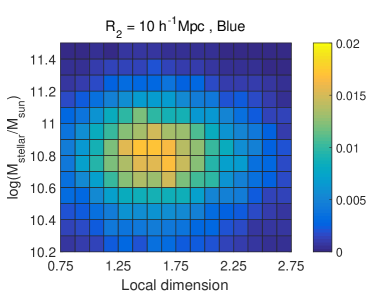
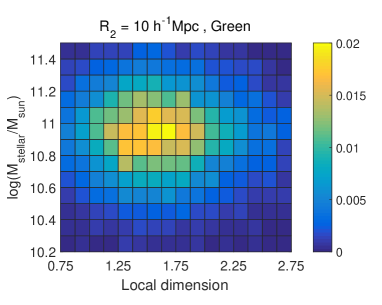
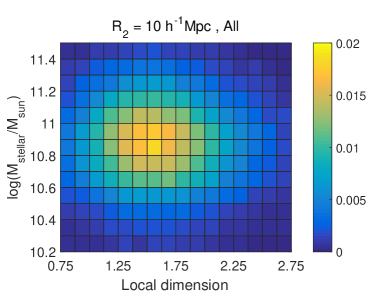
We also show the fraction of different types of galaxies present in different regions of the local dimension-stellar mass plane in Figure 4. The top left, top right and bottom left panels of this figure show the results for the red, blue and green galaxies respectively. The results show that the red, blue and green galaxies reside in all types of environments. However they preferentially occupy the environments with local dimension when the environments are examined on a length scales of . Such a trend is already seen in Figure 2. The top two panels of Figure 4 show that the red galaxies show a shift towards the higher stellar masses compared to the blue galaxies in the local dimension-stellar mass plane. This suggests a role of stellar mass in quenching the red galaxies in all types of environments. Interestingly, the green galaxies occupy a similar region as inhabited by the red galaxies in the local dimension-stellar mass plane. The strong environmental dependence of the red fraction and the environmental independence of the green fraction in Figure 3 suggest that the red and green galaxies may have acquired their higher masses through different routes.
4.3 AGN activity in green galaxies in different environments
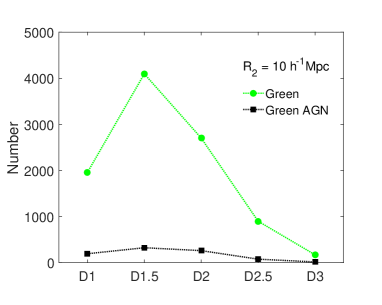
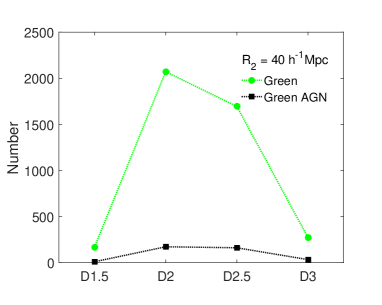
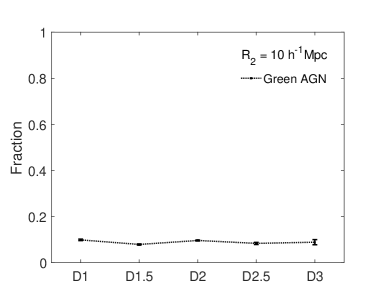
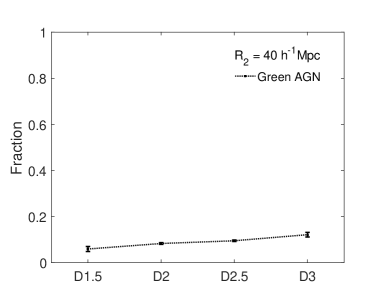
AGN feedback is believed to play an important role in quenching star formation in galaxies. It prevents cooling of hot halo gas and supports long term shutdown of star formation in massive galaxies. We explore the fraction of AGN in green galaxies in different environments of the cosmic web. The top left and right panels of Figure 5 show the number of green galaxies and green AGN in different environments for and respectively. The fractions of green AGNs in different environments for these two length scales are shown in the two bottom panels of Figure 5. We find that green galaxies host AGN in each environment. The fraction of AGN in green galaxies are independent of environments and the associated length scales. This indicates that the AGN activity in green galaxies could be a result of secular evolution. At each environment, only a small fraction of green galaxies host AGN. The destruction of the gas reservoirs in galaxies by AGN-driven winds provide an effective channel for quenching. However, the transition in majority of green galaxies can not be explained by the AGN driven quenching of star formation.
4.4 Morphology of green galaxies in different environments
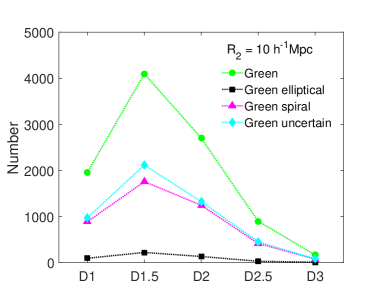
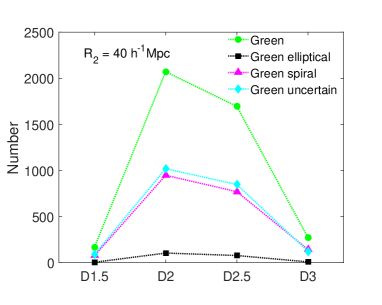
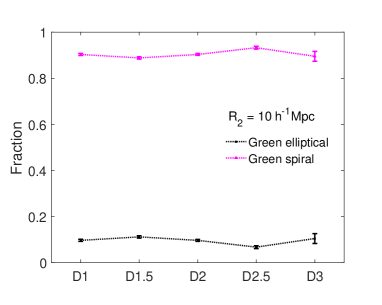
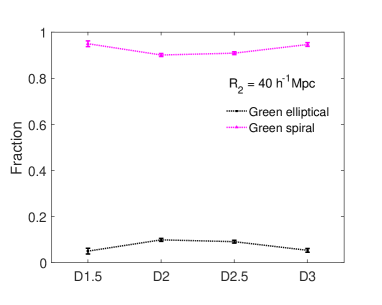
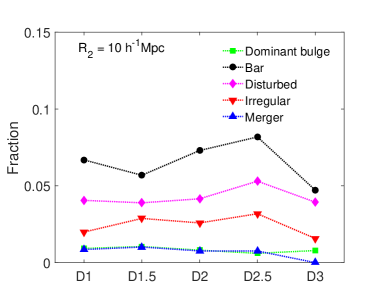
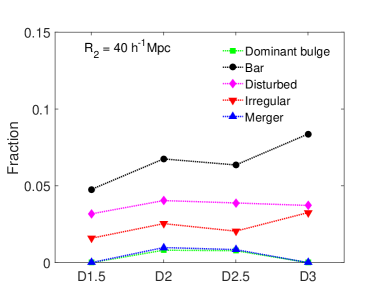
The morphology and the star formation activity of a galaxy are known to be closely correlated with each other. In order to understand the role of morphological quenching in the green valley galaxies, we study their morphology as classified visually by a large number of volunteers in the Galaxy Zoo [11] and the Galaxy Zoo 2 project [123]. We find that out of 12825 green galaxies there are 640 ellipticals , 5655 spirals and 6530 galaxies with uncertain morphology. We first show the number of spirals, ellipticals and galaxies with uncertain morphology in different environments for and in the top two panels of Figure 6. We plot the respective fractions of spirals and ellipticals in different environments in the two bottom panels of this figure. The results show that classified green galaxies are spirals and only galaxies are ellipticals in each environments. These ellipticals in the green valley could be the passive galaxies which may have underwent a wet merger causing a rejuvenation of star formation [128, 129]. The majority of the classified green galaxies are spirals. We obtain the detailed morphology of a subset of the green galaxies (8931 out of 12825) from Galaxy Zoo 2. We find that out of these 12825 green galaxies, there are 82 galaxies with dominant bulge, 587 galaxies with bar, 390 galaxies with disturbed features, 231 galaxies with irregular features and 76 galaxies with merger features. In each case, we only consider the classifications with a debiased vote fraction greater than 0.8. We show the fractions of green galaxies having dominant bulge, bar and those with disturbed, merger and irregular features in different environment in the two panels of Figure 7. In both the panels, these fractions are nearly independent of environment.
4.5 Distributions of stellar mass in different environments
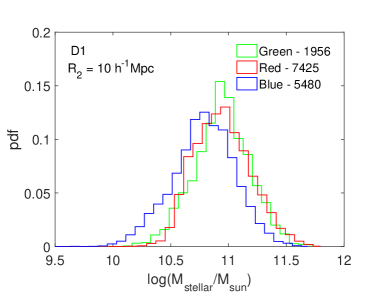
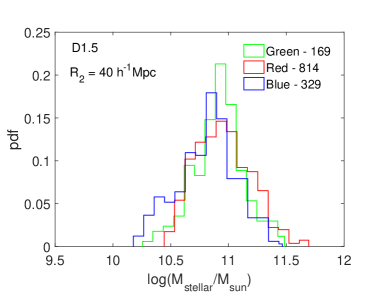
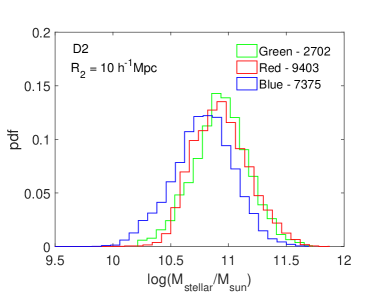
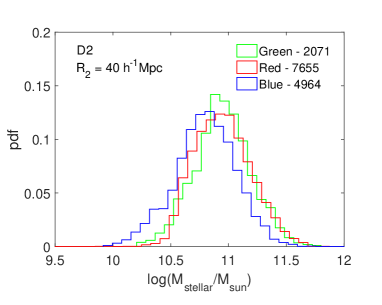
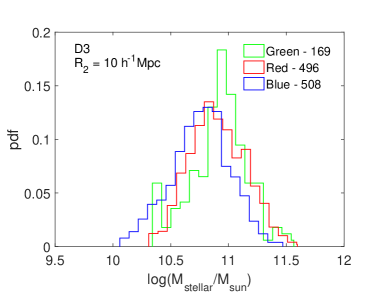
In the top left, middle left and bottom left panels of Figure 8, we show the distributions of the stellar mass for the red, blue and green galaxies in -type, -type and -type environments with . The results for in -type, -type and -type environments are respectively shown in the top right, middle right and bottom right panels of Figure 8. We see that at each environment, the distributions of stellar mass of the red and green galaxies are quite similar and are noticeably different than that for the blue galaxies. The stellar mass distribution of the blue galaxies extends to lower masses compared to the red and green galaxies in each type of environment.
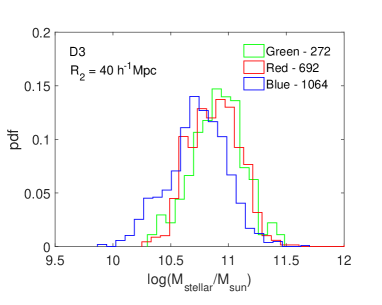
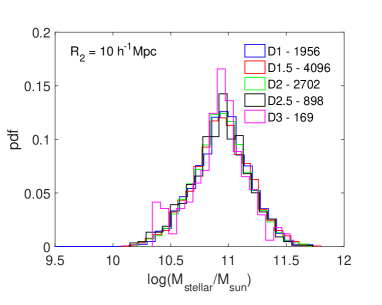
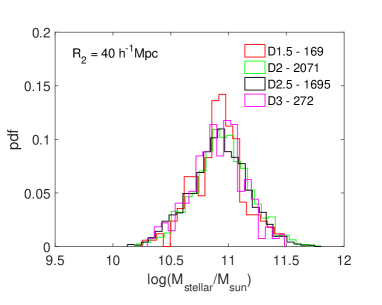
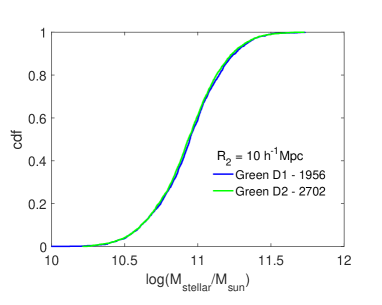
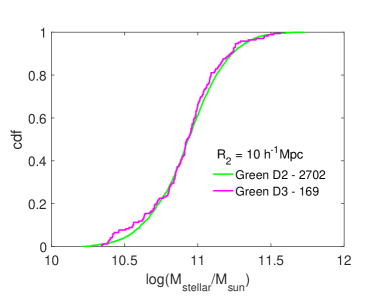
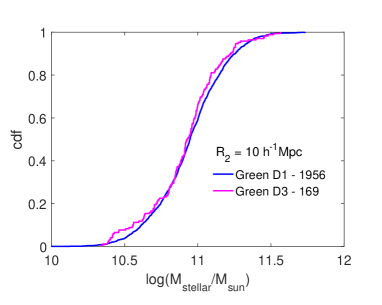
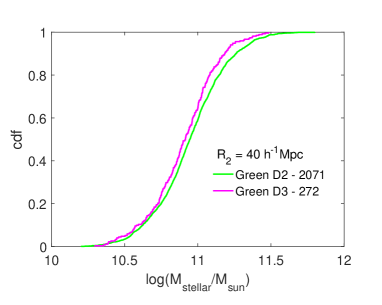
We also compare the stellar mass distributions of green galaxies in different environments in the top two panels of Figure 9. The left and right panels in this figure correspond to and respectively. We test the statistical significance of the differences between the distributions using a two-sample Kolmogorov-Smirnov test. The middle and bottom panels of Figure 9 compare the CDF of stellar mass distribution in different environments. The values from the test listed in Table 2, suggests that at , the null hypothesis can not be rejected at high confidence level. So there are no statistically significant difference between the stellar mass distributions of green galaxies in different environments.However we note that the stellar mass distribution of green galaxies in and type environments differ at confidence level at .
4.6 Distributions of star formation rate in different environments
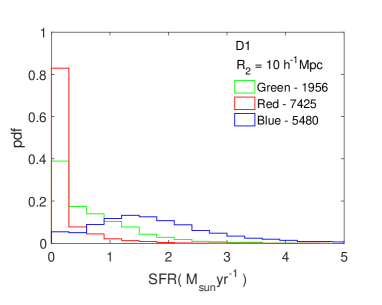
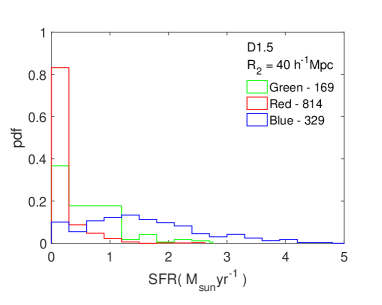
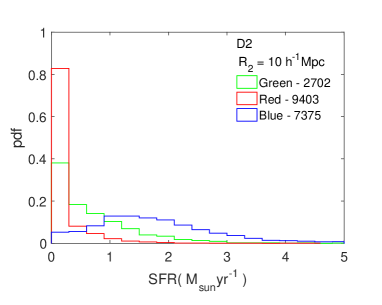
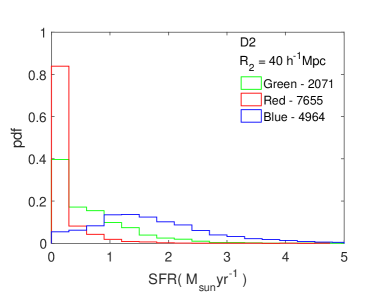
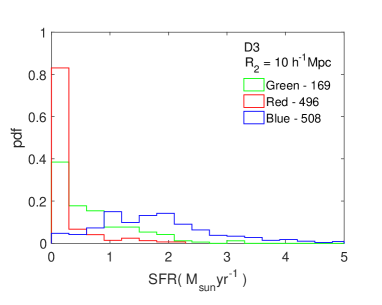
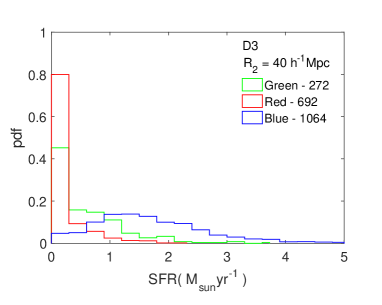
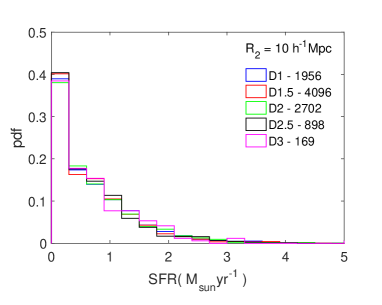
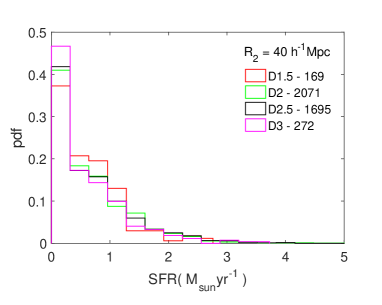
We show the distributions of star formation rate (SFR) in red, blue and green galaxies in different types of environment in Figure 10. The left and right panels of Figure 10 show the results for and respectively. The SFR distribution of red galaxies at each environment peaks at the lowest SFR bin. The peak of the SFR distribution of green galaxies occur at the lowest SFR bin too. However, we see that of the red galaxies and green galaxies reside in the lowest SFR bin. So there is a large difference between the amplitudes of the peaks associated with the two distributions. The distribution of green galaxies dominate the distribution of red galaxies in all the other SFR bins. The SFR distribution of green galaxies extends to higher SFR values as compared to the distribution of red galaxies. The distribution of blue galaxies peaks at higher SFR and extends further compared to that for the red and green galaxies at each environment.
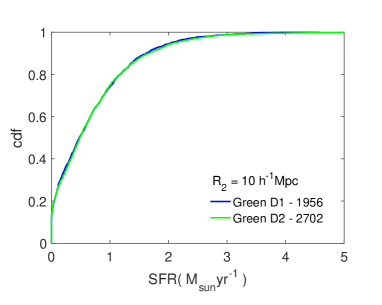
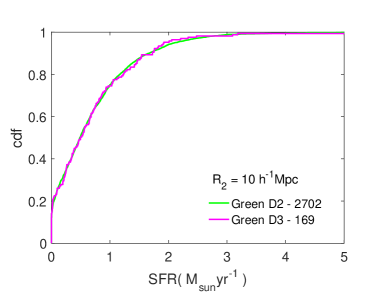
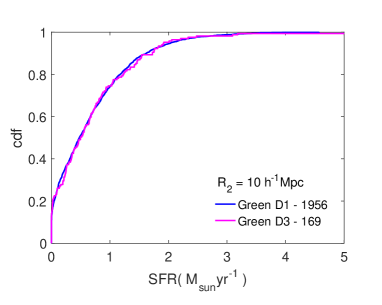
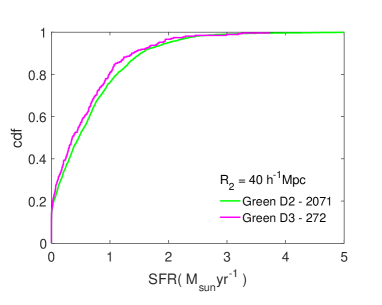
We compare the SFR distributions of the green galaxies in different types of environments for and in the top two panels of Figure 11. We test the statistical significance of the differences between the distribution using a Kolmogorov-Smirnov test. The CDFs in different environments are compared in the middle and bottom panels of Figure 11 and the corresponding values are listed in Table 2. The results show that the null hypothesis can not be rejected even at confidence level which implies that the SFR in green galaxies are independent of their environment.
4.7 Distributions of stellar age in different environments
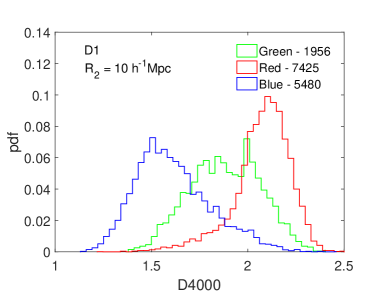
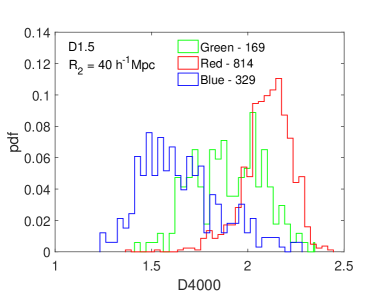
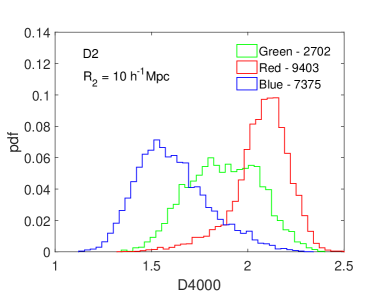
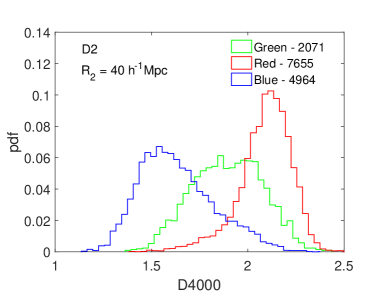
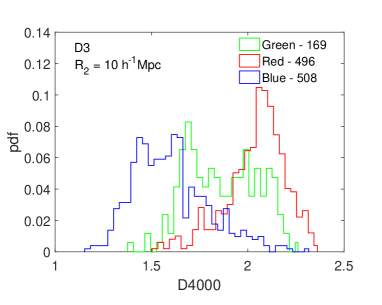
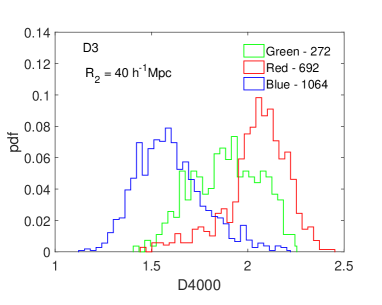
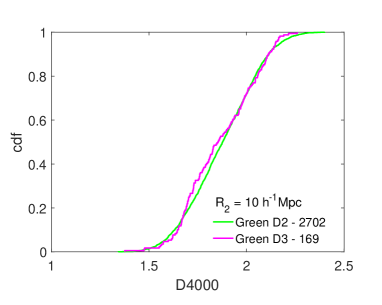
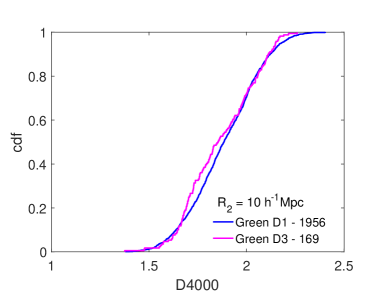
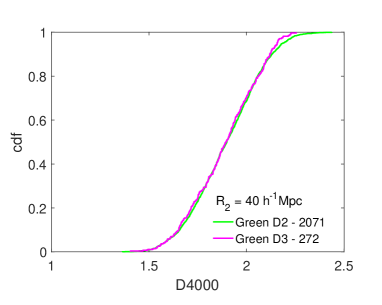
We show the distributions of stellar age as characterized by for the red, blue and green galaxies in different environments in Figure 12. The top, middle and bottom left panels of Figure 12 show the results for . The results for are shown in the top, middle and bottom right panels of Figure 12. At each panel, the distributions of the red and blue galaxies show two distinct peaks at and respectively. The wide separation between the two peaks suggests that the red galaxies are dominated by older stellar population whereas the blue galaxies are primarily represented by younger stellar population. The distribution of the green galaxies show a broader peak at the intermediate region between the two peaks corresponding to the red and blue galaxies. This suggests that the age of the stellar population hosted in green galaxies are relatively younger than red galaxies and older than blue galaxies. The distribution for the green galaxies also show a significant overlap with the distributions of red and blue galaxies.
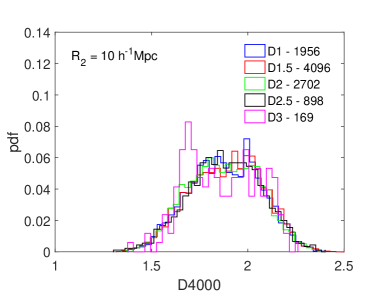
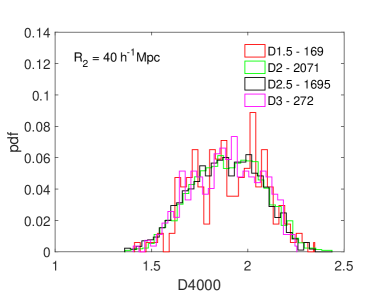
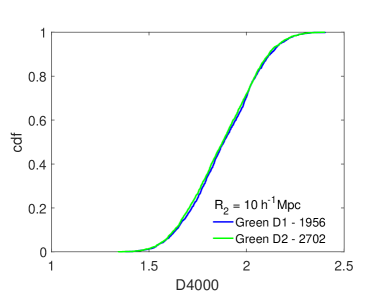
A comparison of the stellar age distributions for the green galaxies in different environments are shown in the top two panels of Figure 13. The statistical significance of the differences between the distributions are measured using a Kolmogorov-Smirnov test. We compare the CDFs in the middle and bottom panels of Figure 13 and list the corresponding values in Table 2. The test shows that the null hypothesis can not be rejected at high confidence level which indicates that the stellar age of green galaxies are independent of their environment.
| D1-D2 | D2-D3 | D1-D3 | D2-D3 | ||
| 0.0284 | 0.0568 | 0.0733 | 0.0892 | ||
| SFR | 0.0220 | 0.0328 | 0.0532 | 0.0665 | |
| 0.0271 | 0.0760 | 0.0969 | 0.0369 | ||
| 99% | 0.0483 | 0.1291 | 0.1305 | 0.1050 | |
| 90% | 0.0363 | 0.0970 | 0.0981 | 0.0789 | |
| 80% | 0.0319 | 0.0851 | 0.0860 | 0.0692 | |
| 70% | 0.0289 | 0.0722 | 0.0781 | 0.0628 | |
| 60% | 0.0266 | 0.0711 | 0.0719 | 0.0579 | |
| 50% | 0.0247 | 0.0665 | 0.0668 | 0.0537 | |
5 Conclusions
In the present work, we analyze a volume limited sample from the SDSS to understand the internal and external influences on the quenching of star formation in the green valley galaxies. We employ a fuzzy set-theoretic method to classify the galaxies according to their colour and characterize their environment using the local dimension. We study the fraction of green galaxies in different environments as a function of their stellar mass. We also study the morphology of green galaxies in different environments. The AGN driven winds can quench star formation in galaxies. They can also play an important role in mass driven quenching. So, we study the fraction of AGNs in green galaxies in different environments. The presence of a dominant bulge or bar can also suppress star formation in galaxies. We measure the fraction of green galaxies with dominant bulge and bar in various environments. Galaxy interaction such as strangulation and harassment are also known to quench star formation in galaxies. We study the fraction of green galaxies with disturbed, irregular or merger features in different environments. We finally compare the distributions of stellar mass, SFR and stellar age of red, blue and green galaxies in different environments of the cosmic web. We test if the distributions of stellar mass, SFR and stellar age of green galaxies in various environments have any statistically significant differences. Our main results can be summarized as follows:
(i) The fraction of green galaxies is independent of geometric environments of the cosmic web. Around of the galaxies in each environment turn out to be green. The fraction of the green galaxies increases with the stellar mass but remains below at each environment. The green fraction is also independent of the length scales associated with the environments.
(ii) At each environment, of green galaxies show AGN activity. The fraction of AGN in green galaxies is also independent of the environment and the associated length scales.
(iii) At each environment, of the visually classified green galaxies are spirals and only are ellipticals. The morphology of the green galaxies is also independent of the environment and the associated length scales.
(iv) Most of the visually classified green galaxies have a bulge but only of them at each environment, have a dominant bulge. Nearly of classified green galaxies at each environment host a bar. The bulge fraction and bar fraction in green galaxies show a mild environmental dependence with no clear trends.
(v) Only , and visually classified green galaxies at each environment respectively show disturbed, irregular and merger features. The green fractions with these odd features show a mild environmental dependence but no obvious trends are observed.
(vi) The stellar mass distributions of red and green galaxies are quite similar in each environment. The distributions of SFR and stellar age of red, blue and green galaxies are noticeably different in each environment.
(vii) The distributions of stellar mass, SFR and stellar age of green galaxies in various environments of the cosmic web do not differ in a statistically significant way.
Based on the above findings, we conclude that the green valley galaxies follow a mixture of evolutionary pathways. We do not find any strong evidence in favour of environmental influences in quenching of star formation in green galaxies. Only green galaxies in each environment show signatures of interactions and merger. of the green galaxies in each environment are ellipticals which may be the outcome of gas-rich mergers. We also note that the distributions of stellar mass, SFR and stellar age of green galaxies are independent of their environments.
Majority of the green galaxies () at each environment are disc dominated spirals. Contrary to this, most of the red galaxies are known to be ellipticals with very little or no star formation. The massive red ellipticals are believed to have acquired their mass through a major merger or multiple minor mergers. The morphological transformations in these galaxies were induced by mergers and their higher masses may have played an important role in quenching star formation in these galaxies. The similarity between the stellar mass distributions of red and green galaxies and the fact that most green galaxies are disc dominated spirals indicates that the vast majority of green galaxies may have initiated their quenching due to their larger masses. The disc dominated massive green galaxies may be an outcome of secular evolution. Some galaxies at each environment may grow only via smooth accretion and hence evolve very slowly. The star formation in these galaxies is curtailed when their masses exceed the critical mass required for the transition from cold to hot mode of accretion. Once the hot mode is activated, the supply of cold gas from the IGM to these galaxies are hindered. These galaxies slowly exhaust their remaining cold gas over time and consequently show a decrease in star formation. Presence of AGN activity can accelerate quenching of star formation in these galaxies. But the fact that only green galaxies at each environment host AGNs indicates that they play a minor role in suppressing the star formation in these galaxies. Schawinski et al.[130] find that galaxies of moderate-luminosity supermassive black holes in the local universe have intermediate optical colors that imply the host galaxies are transitioning from star formation to quiescence. Our results do not contradict with these findings. These moderate-luminosity supermassive black holes with intermediate optical colors may represent a certain fraction of the green valley population for which the AGN activity plays the central role in quenching. Further, Schawinski et al.[131] show that the time lag between the triggering of AGN activity and the photoionization of the gas reservoir of the galaxy is years. This is known to be much shorter than the growth time of black holes ( years). It suggests that the black holes may grow via many such on and off phases of AGN. If such flickering of AGN activity are prevalent in the green valley galaxies then it would be difficult to correctly evaluate the role of AGNs in quenching the population. Our findings do not rule out such a possibility.
Dynamical instabilities within a galaxy leading to the formation of bar and bulge can also suppress star formation within a galaxy. The presence of dominant bulge and bar in green galaxies at each environment suggests that such internal influences may also play a role of quenching agents in these galaxies. However, of the green galaxies must curtail their star formation using physical mechanism(s) other than interactions, mergers and those driven by bulge, bar and AGN activity. We speculate that these green galaxies are massive galaxies which have grown via secular evolution [50] and terminated their star formation via mass driven quenching. However, a long term shutdown of star formation in these galaxies requires the presence of additional heating sources like AGN feedback, without which accretion and cooling of gas can not be suppressed indefinitely. We observe that only a small fraction of green galaxies show AGN activity and hence the quenching in green galaxies is still a significant problem which requires other internal physical processes to truncate the gas supply and maintain the hot halo. We would also like to mention here that the present day green valley galaxies do not represent the progenitors of the galaxies that are currently in the red sequence. The progenitors of the red galaxies were star-forming in the past and those galaxies were different than the present day star-forming galaxies. So it is not clear whether the galaxies in the red sequence have gone through a significant morphological transformation or they were born more dispersion dominated [132, 103].
The incompleteness of our volume limited sample at low stellar masses (Figure 4) is a caveat in the present analysis. We construct the sample in order to have the local dimension estimates of an optimal number of green valley galaxies required for the analysis. It may be argued that our volume limited sample consists of more massive galaxies which may partly explain the absence of the environmental trends in the green valley population. However, we note that the fraction of the red galaxies and their properties are sensitive to their environments despite having a similar mass range. This indicates that the quenching in the green valley galaxies may not be driven by their environments unlike their counterparts in the red sequence.
Our results are consistent with some recent studies with the green valley galaxies. Mendez et al. [133] analyzed the AEGIS data over the redshift range and find that majority of the galaxies in the green valley are massive disk galaxies with high concentrations. The green galaxies are not dominated by ongoing-mergers or post-mergers. They also pointed out that AGN-driven winds are insufficient to explain the suppression of star formation in the green galaxies. Recently Belfiore et al. [134] study the green valley galaxies using the SDSS IV MaNGA and find that slow quenching mechanisms which can affect the entire galaxy are needed to explain the transition in this quasistatic population. Coertese [135]analyze the GALEX and WISE data to find that at high masses, UV colours are superior to optical colours in distinguishing actively star-forming galaxies from passive galaxies. Another recent paper by Angthopo et al. [136] define green galaxies using break strengh and a subsequent analysis [137] with this definition suggests that colour based selection of green valley galaxies produces a complex population mixture caused by dust atteneuation and the related correction. We plan to address these issues in future works.
We finally conclude that environmental influences play a minor role and internal processes play the dominant role in quenching star formation in the green valley galaxies.
ACKNOWLEDGEMENT
We thank the anonymous reviewer for the valuable comments and suggestions that helped us to improve the manuscript. The authors thank the SDSS and Galaxy Zoo team for making the data publicly available. We also greatly acknowledge the efforts of the Galaxy Zoo and Galaxy Zoo 2 volunteers for the detailed visual morphological classifications of the SDSS galaxies.
BP would like to acknowledge financial support from the SERB, DST, Government of India through the project CRG/2019/001110. BP would also like to acknowledge IUCAA, Pune for providing support through associateship programme.
Funding for the SDSS and SDSS-II has been provided by the Alfred P. Sloan Foundation, the Participating Institutions, the National Science Foundation, the U.S. Department of Energy, the National Aeronautics and Space Administration, the Japanese Monbukagakusho, the Max Planck Society, and the Higher Education Funding Council for England. The SDSS website is http://www.sdss.org/.
The SDSS is managed by the Astrophysical Research Consortium for the Participating Institutions. The Participating Institutions are the American Museum of Natural History, Astrophysical Institute Potsdam, University of Basel, University of Cambridge, Case Western Reserve University, University of Chicago, Drexel University, Fermilab, the Institute for Advanced Study, the Japan Participation Group, Johns Hopkins University, the Joint Institute for Nuclear Astrophysics, the Kavli Institute for Particle Astrophysics and Cosmology, the Korean Scientist Group, the Chinese Academy of Sciences (LAMOST), Los Alamos National Laboratory, the Max-Planck-Institute for Astronomy (MPIA), the Max-Planck-Institute for Astrophysics (MPA), New Mexico State University, Ohio State University, University of Pittsburgh, University of Portsmouth, Princeton University, the United States Naval Observatory, and the University of Washington.
References
- [1] M. Colless, et al.(for 2dFGRS team),MNRAS, 328, 1039 (2001)
- [2] M. A. Strauss, D. H. Weinberg, R. H. Lupton, V. K. Narayanan, J. Annis, M. Bernardi, M. Blanton, et al., AJ, 124, 1810 (2002)
- [3] I. Strateva, Ž. Ivezić, G. R. Knapp, V. K. Narayanan, M. A. Strauss, J. E. Gunn, R. H. Lupton, et al., AJ, 122, 1861 (2001)
- [4] D. W. Hogg, M. R. Blanton, D. J. Eisenstein, J. E. Gunn, D. J. Schlegel, I. Zehavi, N. A. Bahcall, et al., ApJL, 585, L5 (2003)
- [5] M. L. Balogh, I. K. Baldry, R. Nichol, C. Miller, R. Bower, & K. Glazebrook, ApJL, 615, L101 (2004)
- [6] I. K. Baldry, K. Glazebrook, J. Brinkmann, Ž. Ivezić, R. H. Lupton, R. C. Nichol,& A. S. Szalay, ApJ, 600, 681 (2004)
- [7] G. Kauffmann, T. M. Heckman, S. D. M. White, S. Charlot, C. Tremonti, E. W. Peng, M. Seibert, et al., MNRAS, 341, 54 (2003)
- [8] S. J. Kannappan, ApJL, 611, L89 (2004)
- [9] T. K. Wyder, D. C. Martin, D. Schiminovich, M. Seibert, T. Budavári , M. A. Treyer, T. A. Barlow, et al., ApJS, 173, 293 (2007)
- [10] M. R. Blanton, J. Brinkmann, I. Csabai, M. Doi, D. Eisenstein, M. Fukugita, J. E. Gunn, et al., AJ, 125, 2348 (2003)
- [11] C. J. Lintott, K. Schawinski, A. Slosar, et al., MNRAS, 389, 1179 (2008)
- [12] K. Schawinski, C. Lintott, D. Thomas, M. Sarzi, D. Andreescu, S. P. Bamford, S. Kaviraj, et al., MNRAS, 396, 818 (2009)
- [13] K. L. Masters, M. Mosleh, A. K. Romer, R. C. Nichol, S. P. Bamford, K. Schawinski, C. J. Lintott, et al., MNRAS, 405, 783 (2010)
- [14] N. Menci, A. Fontana, E. Giallongo, & S. Salimbeni, ApJ, 632, 49 (2005)
- [15] S. P. Driver, et al., MNRAS, 368, 414 (2006)
- [16] E. Cameron, S. P. Driver, A. W. Graham, J. Liske, ApJ, 699, 105 (2009)
- [17] A. Cattaneo, A. Dekel, J. Devriendt, B. Guiderdoni, & J. Blaizot, MNRAS, 370, 1651 (2006)
- [18] A. Cattaneo, et al., MNRAS, 377, 63 (2007)
- [19] J. W. Trayford, et al., MNRAS, 460, 3925 (2016)
- [20] D. Nelson, et al., MNRAS, 475, 624 (2018)
- [21] C. A. Correa, J. Schaye, & J. W. Trayford, MNRAS, 484, 4401 (2019)
- [22] E. F. Bell, C. Wolf, K. Meisenheimer, H.-W. Rix, A. Borch, S. Dye, M. Kleinheinrich, et al., ApJ, 608, 752 (2004)
- [23] B. J. Weiner, A. C. Phillips, S. M. Faber, C. N. A. Willmer, N. P. Vogt, L. Simard, K. Gebhardt, et al., ApJ, 620, 595 (2005)
- [24] M. Kriek, A. van der Wel , P. G. van Dokkum, M. Franx, G. D. Illingworth, ApJ, 682, 896 (2008)
- [25] G. B. Brammer, K. E. Whitaker, P. G. van Dokkum, D. Marchesini, I. Labbé , M. Franx, M. Kriek, et al., ApJL, 706, L173 (2009)
- [26] S. M. Faber, C. N. A. Willmer, C. Wolf, D. C. Koo, B. J. Weiner, J. A. Newman, M. Im, et al., ApJ, 665, 265 (2007)
- [27] P. Madau, H. C. Ferguson, M. E. Dickinson, M. Giavalisco, C. C. Steidel, & A. Fruchter, MNRAS, 283, 1388 (1996)
- [28] M. J. Rees, & J. P. Ostriker, MNRAS, 179, 541 (1977)
- [29] J. Silk, ApJ, 211, 638 (1977)
- [30] S. D. M. White, & M. J. Rees, MNRAS, 183, 341 (1978)
- [31] S. M. Fall, & G. Efstathiou, MNRAS, 193, 189 (1980)
- [32] J. Binney, MNRAS, 347, 1093 (2004)
- [33] Y. Birnboim, & A. Dekel, MNRAS, 345, 349 (2003)
- [34] A. Dekel, & Y. Birnboim, MNRAS, 368, 2 (2006)
- [35] D. Kereš , N. Katz, D. H. Weinberg, & R. Davé , MNRAS, 363, 2 (2005)
- [36] J. M. Gabor, R. Davé , K. Finlator, & B. D. Oppenheimer, MNRAS, 407, 749 (2010)
- [37] J. M. Gabor, & R. Davé, MNRAS, 447, 374 (2015)
- [38] Y. Birnboim, A. Dekel, & E. Neistein, MNRAS, 380, 339 (2007)
- [39] D. J. Croton, V. Springel, S. D. M. White, G. De Lucia , C. S. Frenk, L. Gao, A. Jenkins, et al., MNRAS, 365, 11 (2006)
- [40] R. G. Bower, A. J. Benson, R. Malbon, J. C. Helly, C. S. Frenk, C. M. Baugh, S. Cole, et al., MNRAS, 370, 645 (2006)
- [41] R. S. Somerville, P. F. Hopkins, T. J. Cox, B. E. Robertson, & L. Hernquist, MNRAS, 391, 481 (2008)
- [42] A. Dekel, & Y. Birnboim, MNRAS, 383, 119 (2008)
- [43] A. Dekel, R. Sari, & D. Ceverino, ApJ, 703, 785 (2009)
- [44] M. Haywood, M. D. Lehnert, P. Di Matteo , O. Snaith, M. Schultheis, D. Katz, & A. Gómez, A&A, 589, A66 (2016)
- [45] D. Spinoso, S. Bonoli, M. Dotti, L. Mayer, P. Madau, & J. Bellovary, MNRAS, 465, 3729 (2017)
- [46] P. A. James, & S. M. Percival, MNRAS, 474, 3101 (2018)
- [47] K. George, S. Subramanian, & K. T. Paul, A&A, 628, A24 (2019)
- [48] F. Combes, & R. H. Sanders, A&A, 96, 164 (1981)
- [49] V. P. Debattista, C. M. Carollo, L. Mayer, & B. Moore, ApJL, 604, L93 (2014)
- [50] J. Kormendy, & R. C. Kennicutt, ARA&A, 42, 603 (2004)
- [51] E. Athanassoula, R. E. G. Machado, & S. A. Rodionov, MNRAS, 429, 1949 (2013)
- [52] M. Martig, F. Bournaud, R. Teyssier, & A. Dekel, ApJ, 707, 250 (2009)
- [53] V. A. Bruce, J. S. Dunlop, A. Mortlock, D. D. Kocevski, E. J. McGrath, & D. J. Rosario, MNRAS, 458, 2391 (2016)
- [54] F. Combes, & M. Gerin, A&A, 150, 327 (1985)
- [55] J. J. Fang, S. M. Faber, D. C. Koo, & A. Dekel, ApJ, 776, 63 (2013)
- [56] A. Toomre, & J. Toomre, ApJ, 178, 623 (1972)
- [57] J. E. Barnes, MNRAS, 333, 481 (2002)
- [58] T. J. Cox, J. Primack, P. Jonsson, & R. S. Somerville, ApJL, 607, L87 (2004)
- [59] N. Murray, E. Quataert, & T. A. Thompson, ApJ, 618, 569 (2005)
- [60] V. Springel, T. Di Matteo, & L. Hernquist, MNRAS, 361, 776 (2005)
- [61] J. E. Gunn, & J. R. Gott, ApJ, 176, 1 (1972)
- [62] B. Moore, N. Katz, G. Lake, A. Dressler, & A. Oemler, Nature, 379, 613 (1996)
- [63] B. Moore, G. Lake, & N. Katz, ApJ, 495, 139 (1998)
- [64] M. L. Balogh, J. F. Navarro, & S. L. Morris, ApJ, 540, 113 (2000)
- [65] R. B. Larson, B. M. Tinsley, & C. N. Caldwell, ApJ, 237, 692 (1980)
- [66] R. S. Somerville, & J. R. Primack, MNRAS, 310, 1087 (1999)
- [67] D. Kawata, & J. S. Mulchaey, ApJL, 672, L103 (2008)
- [68] F. Hoyle, et al., ApJ, 580, 663 (2002)
- [69] C. Park, et al., ApJ, 633, 11 (2005)
- [70] K. Nandra, A. Georgakakis, C. N. A. Willmer, M. C. Cooper, D. J. Croton, M. Davis, S. M. Faber, et al., ApJL, 660, L11 (2007)
- [71] G. Hasinger, A&A, 490, 905 (2008)
- [72] J. D. Silverman, V. Mainieri, B. D. Lehmer, D. M. Alexander, F. E. Bauer, J. Bergeron, W. N. Brandt, et al., ApJ, 675, 1025 (2008)
- [73] A. Cimatti, M. Brusa, M. Talia, M. Mignoli, G. Rodighiero, J. Kurk, P. Cassata, et al., ApJL, 779, L13 (2013)
- [74] K. Schawinski, C. M. Urry, B. D. Simmons, L. Fortson, S. Kaviraj, W. C. Keel, C. J. Lintott, et al., MNRAS, 440, 889 (2014)
- [75] Lin Y.-T., Hsieh B.-C., Lin S.-C., Oguri M., Chen K.-F., Tanaka M., Chiu I.-N., et al., ApJ, 851, 139 (2017)
- [76] S. Salim , SerAJ, 189, 1. doi:10.2298/SAJ1489001S (2014)
- [77] V. Coenda, H. J. Martínez, & H. Muriel, MNRAS, 473, 5617 (2018)
- [78] H.-Y. Jian, L. Lin, Y. Koyama, I. Tanaka, K. Umetsu, B.-C. Hsieh, Y. Higuchi, et al., ApJ, 894, 125 (2020)
- [79] J. C. Mihos, & L. Hernquist, ApJL, 431, L9 (1994)
- [80] E.P. Hubble, The Realm of the Nebulae (Oxford University Press: Oxford), 79 (1936)
- [81] A. Dressler, ApJ, 236, 351 (1980)
- [82] M. Postman, & M. J. Geller, ApJ, 281, 95 (1984)
- [83] I. Lewis, M. Balogh, R. De Propris, W. Couch, R. Bower, A. Offer, J. Bland-Hawthorn, et al., MNRAS, 334, 673 (2002)
- [84] P. L. Gómez , R. C. Nichol, C. J. Miller, M. L. Balogh, T. Goto, A. I. Zabludoff, A. K. Romer, et al., ApJ, 584, 210 (2003)
- [85] G. Kauffmann, S. D. M. White, T. M. Heckman, et al., MNRAS, 353, 713 (2004)
- [86] J. R. Bond, L. Kofman, & D. Pogosyan, Nature, 380, 603 (1996)
- [87] O. Hahn, C. Porciani, C. M. Carollo, & A. Dekel, MNRAS, 375, 489 (2007)
- [88] D. J. Croton, L. Gao, & S. D. M. White, MNRAS, 374, 1303 (2007)
- [89] L. Gao, & S. D. M. White, MNRAS, 377, L5 (2007)
- [90] M. Musso, C. Cadiou, C. Pichon, S. Codis, K. Kraljic, & Y. Dubois, MNRAS, 476, 4877 (2018)
- [91] M. Vakili, & C. Hahn, ApJ, 872, 115 (2019)
- [92] H. Miyatake, S. More, M. Takada, D. N. Spergel, R. Mandelbaum, E. S. Rykoff, & E. Rozo, PhRvL, 116, 041301 (2016)
- [93] A. D. Montero-Dorta, E. Pérez, F. Prada, S. Rodríguez-Torres , G. Favole, A. Klypin, R. Cid Fernandes, et al., ApJL, 848, L2 (2017)
- [94] M. Kerscher, A&A, 615, A109 (2018)
- [95] B. Pandey, & S. Bharadwaj, MNRAS, 372, 827 (2006)
- [96] B. Pandey, & S. Bharadwaj, MNRAS, 387, 767 (2008)
- [97] J. M. Scudder, S. L. Ellison, & Mendel, J. T., MNRAS, 423, 2690 (2012)
- [98] B. Ellison, D. Sobral, B. Mobasher, et al., ApJ, 796, 51 (2014)
- [99] M. E. Filho, J. Sánchez Almeida, C.Muñoz-Tuñón, et al., ApJ, 802, 82 (2015)
- [100] H. E. Luparello, M. Lares, D. Paz, et al., MNRAS, 448, 1483 (2015)
- [101] B. Pandey, & S.Sarkar ,MNRAS, 467, L6 (2017)
- [102] S. Sarkar, & B.Pandey , MNRAS, 497, 4077 (2020)
- [103] S. Bhattacharjee, B. Pandey, & S. Sarkar, JCAP, 2020, 039 (2020)
- [104] B. Pandey, & S. Sarkar, MNRAS, 498, 6069 (2020)
- [105] D. B. Fisher, & N. Drory, AJ, 136, 773 (2008)
- [106] P. Lang, S. Wuyts, R. S. Somerville, N. M. Förster Schreiber , R. Genzel, E. F. Bell, G. Brammer et al., ApJ, 788, 11 (2014)
- [107] N. M. Förster Schreiber, R. Genzel, S. F. Newman, J. D. Kurk, D. Lutz, L. J. Tacconi, S. Wuyts, et al., ApJ, 787, 38 (2014)
- [108] S. K. Leslie, L. J. Kewley, D. B. Sanders, & N. Lee, MNRAS, 455, L82 (2016)
- [109] A. C. Fabian, ARA&A, 50, 455 (2012)
- [110] J. E. Gunn, M. Carr, C. Rockosi, M. Sekiguchi, K. Berry, B. Elms, E. de Haas, et al., AJ, 116, 3040 (1998)
- [111] J. E. Gunn, W. A. Siegmund, E. J. Mannery, R. E. Owen, C. L. Hull, R. F. Leger, L. N. Carey, et al., AJ, 131, 2332 (2006)
- [112] D. G. York, et al., AJ, 120, 1579 (2000)
- [113] R. Ahumada, C. Allende Prieto, A. Almeida, F. Anders, S. F. Anderson, B. H. Andrews, B. Anguiano, et al., ApJS, 249, 3 (2020)
- [114] C. Conroy, J. E. Gunn, & M. White, ApJ, 699, 486 (2009)
- [115] A. G. Bruzual, ApJ, 273, 105 (1983)
- [116] J. Brinchmann, S. Charlot, S. D. M. White, C. Tremonti, G. Kauffmann, T. Heckman, & J. Brinkmann, MNRAS, 351, 1151 (2004)
- [117] G. Kauffmann, T. M. Heckman, S. D. M. White, S. Charlot, C. Tremonti, J. Brinchmann, G. Bruzual, et al., MNRAS, 341, 33 (2003)
- [118] M. Sarzi, J. Falcón-Barroso, R. L.Davies, R. Bacon, M. Bureau, M. Cappellari, P. T. de Zeeuw et al., MNRAS, 366, 1151 (2006)
- [119] M. Cappellari, E. Emsellem, PASP, 116, 138 (2004)
- [120] Planck Collaboration, N. Aghanim, Y. Akrami, M. Ashdown, J. Aumont, C. Baccigalupi, M. Ballardini, et al., A&A, 641, A6 (2018)
- [121] B. Pandey,MNRAS, 499, L31 (2020)
- [122] L. A. Zadeh,Fuzzy sets. Information and Control, 8, 338 (1965)
- [123] K. W. Willett, C. J. Lintott, S. P. Bamford, K. L. Masters, B. D. Simmons, K. R. V. Casteels, E. M. Edmondson, et al., MNRAS, 435, 2835 (2013)
- [124] P. Sarkar, & S. Bharadwaj, MNRAS, 394, L66 (2009)
- [125] S. Sarkar, & B. Pandey, MNRAS, 485, 4743 (2019)
- [126] M. Alpaslan, et al., MNRAS, 438, 177 (2014)
- [127] Y.-.jie Peng, S. J. Lilly, K. Kovač, M. Bolzonella, L. Pozzetti, A. Renzini, G. Zamorani, et al., ApJ, 721, 193 (2010)
- [128] S. Kaviraj, S. Peirani, S. Khochfar, J. Silk, & S. Kay, MNRAS, 394, 1713 (2009)
- [129] D. Thomas, C. Maraston, K. Schawinski, M. Sarzi, & J. Silk, MNRAS, 404, 1775 (2010)
- [130] K. Schawinski, S. Virani, B. Simmons, C. M. Urry, E. Treister, S. Kaviraj, B. Kushkuley, ApJL, 692, L19 (2009)
- [131] K. Schawinski, M. Koss, S. Berney, L. F. Sartori, MNRAS, 451, 2517 (2015)
- [132] S. Tacchella, B. Diemer, L. Hernquist, S. Genel, F. Marinacci, D. Nelson, A. Pillepich, et al., MNRAS, 487, 5416 (2019)
- [133] A. J. Mendez, A. L. Coil, J. Lotz, S. Salim, J. Moustakas, & L. Simard, ApJ, 736, 110 (2011)
- [134] F. Belfiore, R. Maiolino, K. Bundy, K. Masters, M. Bershady, G. A. Oyarzún, L. Lin , et al., MNRAS, 477, 3014 (2018)
- [135] L. Cortese, A&A, 543, A132 (2012)
- [136] J. Angthopo, I. Ferreras, J. Silk, MNRAS, 488, L99 (2019)
- [137] J. Angthopo, I. Ferreras, J. Silk, MNRAS, 495, 2720 (2020)