Significant Dust-Obscured Star Formation in Luminous Lyman-break Galaxies at -8
Abstract
We make use of ALMA continuum observations of 15 luminous Lyman-break galaxies at -8 to probe their dust-obscured star-formation. These observations are sensitive enough to probe to obscured SFRs of 20 /yr (). Six of the targeted galaxies show significant (3) dust continuum detections, more than doubling the number of known dust-detected galaxies at . Their IR luminosities range from to , equivalent to obscured SFRs of 20 to 105 /yr. We use our results to quantify the correlation of the infrared excess IRX on the UV-continuum slope and stellar mass. Our results are most consistent with an SMC attenuation curve for intrinsic -slopes of and most consistent with an attenuation curve in-between SMC and Calzetti for slopes of , assuming a dust temperature of 50 K. Our fiducial IRX-stellar mass results at -8 are consistent with marginal evolution from . We then show how both results depend on . For our six dust-detected sources, we estimate their dust masses and find that they are consistent with dust production from SNe if the dust destruction is low (90%). Finally we determine the contribution of dust-obscured star formation to the star formation rate density for luminous (21.5 mag: 1.7) -8 galaxies, finding that the total SFR density at and from bright galaxies is 0.18 dex and 0.20 dex higher, respectively, i.e. of the star formation in 1.7 galaxies at -8 is obscured by dust.
1 Introduction
One major uncertainty in our understanding of galaxy formation during the Reionization Epoch regards the role of early dust build-up. Deep surveys in the rest- with both ground and space-based facilities have enabled the identification of large samples of galaxies at and measurement of their UV-based star formation rates up to redshift 11 (e.g., Bouwens et al., 2011, 2014, 2015, 2016a, 2017; Ellis et al., 2012; Laporte et al., 2012; McLure et al., 2013; Schenker et al., 2013; Finkelstein et al., 2015; Kawamata et al., 2018; Oesch et al., 2014, 2015, 2018; McLeod et al., 2016). The rest- view only accounts for unobscured star formation and could be significantly impacted by the presence of dust in galaxies. Fortunately, accurate measurements of the dust-obscured star formation rates in galaxies to have been available for the past ten years, thanks to deep and wide-field far-infrared (FIR) observations from Herschel and Spitzer (Reddy et al., 2006; Daddi et al., 2007; Magnelli et al., 2009, 2013, 2020; Karim et al., 2011; Cucciati et al., 2012; Schreiber et al., 2015; Álvarez-Márquez et al., 2016).
Less is known however about star formation in galaxies that might be obscured by dust (e.g., Bouwens et al., 2016b; Dunlop et al., 2016; Casey et al., 2018; Wang et al., 2019; Williams et al., 2019). Because of the limited sensitivity and increasing source confusion suffered by Herschel and Spitzer, the obscured star formation in galaxies could initially only be studied in the most luminous systems (e.g. Riechers et al., 2013; Oteo et al., 2016; Marrone et al., 2018). Consequently, studies of the star formation rate density at often account for the impact of obscured star formation based on the light alone. Especially useful in this regard has been the empirical relation between the UV continuum slope and the infrared excess (IRX=). In the local universe, the IRX has been found to show a good correlation with for star forming galaxies (Meurer et al., 1999; Takeuchi et al., 2010; Overzier et al., 2010; Casey et al., 2014). Moreover, this same correlation seems to hold up to at least (Reddy et al., 2006, 2010, 2011; Daddi et al., 2009; Overzier et al., 2010; Sklias et al., 2014; Pannella et al., 2015; Bouwens et al., 2016b; Álvarez-Márquez et al., 2016; Whitaker et al., 2017; Fudamoto et al., 2017, 2019a, 2020; McLure et al., 2018).
The availability of new observations from the increasingly sensitive and high-resolution sub-millimeter facilities like the Atacama Large Millimeter/submillimeter Array (ALMA) and the NOrthern Extended Millimeter Array (NOEMA) have had an especially important impact on studies of obscured star formation and dust in galaxies (e.g. Hodge & da Cunha, 2020). Most importantly, these instruments have enabled the detection of obscured star formation in normal main sequence star forming galaxies at 3 by utilizing deep field observations (Aravena et al., 2016, 2020; Bouwens et al., 2016b, 2020; Dunlop et al., 2016; McLure et al., 2013) and targeted studies (e.g. Capak et al., 2015; Willott et al., 2015; Knudsen et al., 2017; Laporte et al., 2017; Bowler et al., 2018; Hashimoto et al., 2019; Tamura et al., 2019; Fudamoto et al., 2020), but the majority of observed high redshift sources remain undetected in the dust continuum (e.g Maiolino et al., 2015; Bouwens et al., 2016b; Carniani et al., 2017, 2018; Smit et al., 2018; Bowler et al., 2018; Matthee et al., 2017, 2019; Hashimoto et al., 2018). This indicates that star formation in normal galaxies may be less obscured than in the local universe, especially in normal and small galaxies, and previous corrections to the UV derived star formation rates to determine the cosmic star formation history may be overestimated (e.g. Bouwens et al., 2016b; Capak et al., 2015; Willott et al., 2015; Barisic et al., 2017; Faisst et al., 2017, 2020; Fudamoto et al., 2017, 2019a, 2019b). Fudamoto et al. (2020), in particular, find that the infrared excess of -6 galaxies from ALPINE (Le Fèvre et al., 2020) can be much better explained with a steeper attenuation curve like SMC than with greyer attenuation curves like Calzetti.
Despite the significant amount of progress in detecting obscured star formation in galaxies to redshifts , much less is known about the dust properties and obscured star formation rates of galaxies at , with only 4 dust-continuum detections thus far identified in normal star-forming galaxies at -8 (Watson et al., 2015; Knudsen et al., 2017; Laporte et al., 2017; Bowler et al., 2018; Hashimoto et al., 2019; Tamura et al., 2019). Additionally, there have also been a modest number of prominent dust continuum detections in more extreme ULIRG-type (Ultra-Luminous InfraRed Galaxy) sources (Marrone et al., 2018) and QSOs at (Venemans et al., 2012, 2015a, 2015b, 2017, 2018; Bañados et al., 2015; Mazzucchelli et al., 2017).
Further insight can be obtained into the dust properties of luminous galaxies by increasing the number of such galaxies targeted with sensitive dust-continuum observations. In this spirit, we successfully proposed for ALMA continuum observations on a significant sample of luminous galaxies to study the dust-continuum emission from these galaxies. In addition, we also obtained sensitive ALMA-continuum observations on seven other bright galaxies as part of two other programs aimed at probing the [CII]line. Eight of these galaxies were identified as part of the Stefanon et al. (2017, 2019) study of bright star-forming galaxies at in the COSMOS/UltraVISTA field, while the galaxies were primarily part of a similar selection of bright galaxies at (Schouws et al. 2021, in prep). Focus on the brightest and most massive galaxies in the early Universe is especially promising for the study of obscured star formation and dust, given the prevalence of dust in such galaxies at lower redshift (e.g., Hodge & da Cunha, 2020), and the observability of such sources with ALMA and NOEMA.
In this paper, we make use of these new ALMA continuum observations to characterize the dust properties of some of the most massive galaxies in the -8 Universe. Our new observations significantly add to the ALMA continuum observations currently available for galaxies at , allowing us to quantify in much more detail both the dust emission and obscured star formation in these massive sources. In addition, the new observations allow us to constrain the dust law for high-redshift sources more accurately and increase the sample of sources where we have estimates of dust masses, which is essential for studying the build-up of dust early after the Big Bang.
The plan for this paper is as follows. In §2, we describe both the selection of our sources and the ALMA observations. In §3, we present our new ALMA-continuum results and then combine these results with the available UV observations to derive the IR luminosities and infrared excesses for individual sources. In §4, we use our new measurements to constrain the form of IRX-M∗ and IRX- relations, look at spatial offsets between and dust-continuum light, and consider dust build-up in galaxies to . In §5, we briefly discuss our results, and finally, in §6, we summarize our conclusions. Throughout this paper we assume a standard cosmology with km s-1 Mpc-1, and . Magnitudes are presented in the AB system (Oke & Gunn, 1983). For star formation rates and stellar masses we adopt a Chabrier IMF (Chabrier, 2003).
|
|
|
|
|
|
|
|
|||||||||||||||||
|---|---|---|---|---|---|---|---|---|---|---|---|---|---|---|---|---|---|---|---|---|---|---|---|---|
| Sample | ||||||||||||||||||||||||
| UVISTA-Z-001 | 10:00:43.36 | 02:37:51.3 | 1.47”1.21” | 78.36 | 17.9 | 234.0 | 2018.1.00085.S | |||||||||||||||||
| UVISTA-Z-007 | 09:58:46.21 | 02:28:45.8 | 1.40”1.19” | 65.52 | 17.4 | 245.7 | 2018.1.00085.S | |||||||||||||||||
| UVISTA-Z-009 | 10:01:52.30 | 02:25:42.3 | 1.38”1.20” | 65.52 | 19.0 | 245.7 | 2018.1.00085.S | |||||||||||||||||
| UVISTA-Z-010 | 10:00:28.12 | 01:47:54.5 | 1.44”1.18” | 78.36 | 14.7 | 234.0 | 2018.1.00085.S | |||||||||||||||||
| UVISTA-Z-013 | 09:59:19.35 | 02:46:41.3 | 1.45”1.18” | 78.36 | 15.0 | 234.0 | 2018.1.00085.S | |||||||||||||||||
| UVISTA-Z-019 | 10:00:29.89 | 01:46:46.4 | 1.39”1.18” | 65.52 | 18.0 | 245.7 | 2018.1.00085.S | |||||||||||||||||
| COS-3018 | 10:00:30.19 | 02:15:59.8 | 1.63”1.49”c | 766.08 | 7.0 | 233.5 | 2017.1.00604.S | |||||||||||||||||
| Sample | ||||||||||||||||||||||||
| UVISTA-Y-001 | 09:57:47.90 | 02:20:43.7 | 1.17”0.96” | 37.50 | 13.4 | 203.1 | 2018.1.00236.S | |||||||||||||||||
| UVISTA-Y-002 | 10:02:12.56 | 02:30:45.7 | 1.17”0.96” | 37.50 | 13.3 | 203.1 | 2018.1.00236.S | |||||||||||||||||
| UVISTA-Y-003 | 10:00:32.32 | 01:44:31.3 | 0.60”0.52” | 33.26 | 19.1 | 230.4 | 2017.1.01217.S | |||||||||||||||||
| UVISTA-Y-004 | 10:00:58.49 | 01:49:56.0 | 1.03”0.94” | 91.73 | 9.3 | 231.3 |
|
|||||||||||||||||
| UVISTA-Y-005 | 10:00:31.89 | 01:57:50.2 | 1.17”0.96” | 37.50 | 12.9 | 203.1 | 2018.1.00236.S | |||||||||||||||||
| UVISTA-Y-006 | 10:00:12.51 | 02:03:00.5 | 1.17”0.96” | 37.50 | 13.2 | 203.1 | 2018.1.00236.S | |||||||||||||||||
| UVISTA-Y-007ddfootnotemark: | 09:59:02.57 | 02:38:06.1 | 0.60”0.53” | 34.78 | 17.9 | 230.4 | 2017.1.01217.S | |||||||||||||||||
| UVISTA-Y-009eefootnotemark: | 09:59:09.62 | 02:45:09.7 | 0.60”0.53” | 34.78 | 17.9 | 230.4 | 2017.1.01217.S | |||||||||||||||||
Note. — aBeamsize as measured in the naturally weighted continuum images. bCorresponds to the total integration time in case of multiple tunings. In total, 25.7 hours of integration time on source is included in this analysis. cFor this dataset we use a 1.5 arcsecond tapered continuum image, the full 0.25 arcsecond resolution data will be presented in Smit et al. (2021, in prep). dSource name in ALMA observations is Y8. eSource name in ALMA observations is Y10.
2 Targets and ALMA Observations
The purpose of this Section is to provide a brief summary of the deep ALMA continuum observations and bright -8 targets we analyze in this study as part of five separate ALMA programs. A summary of the observations we describe in this Section is provided in Table 1.
2.1 ALMA Continuum Observations of Bright Galaxies
As part of an effort to better characterize the physical properties of very luminous galaxies at , we used an ALMA cycle-6 program (2018.1.00085.S: PI Schouws) to scan six luminous galaxies for the [CII]line (Schouws et al. 2021, in prep). The six sources in the program were identified using the very deep optical, near-IR, and Spitzer/IRAC observations obtained over the 2 deg2 COSMOS/UltraVISTA field from significant survey programs within COSMOS (Scoville et al., 2007; Capak et al., 2007), CFHT-LS (Erben et al., 2009; Hildebrandt et al., 2009), UltraVISTA (McCracken et al., 2012), SPLASH (Capak et al., 2013), and SMUVS (Caputi et al., 2017; Ashby et al., 2018).
Each of the sources was selected to show a strong break across the and filters ( 2 mag), show blue UV-continuum slopes, and show moderately blue or red Spitzer/IRAC [3.6]-[4.5] colors, i.e., or 0.3 (Schouws et al. 2021, in prep). Significantly red or blue Spitzer/IRAC colors not only provide evidence for substantial [OIII]+H line emission in the sources, e.g., 500Å (Smit et al., 2015) but also indicate which IRAC band the line emission contributes. By combining this information with that available from the Lyman break, accurate redshift constraints can be derived 0.15 (see also Smit et al., 2015; Roberts-Borsani et al., 2016) on the six targeted galaxies, making it possible for us to efficiently scan for the 157.74m [CII] line (hereafter [CII]158μm). A study of the [CII]lines will be presented in Schouws et al. (2021, in prep). Here we focus on the dust-continuuum detections.
All six targets were observed in Band 6 as part of ALMA program #2018.1.00085.S using the most compact configuration for maximal sensitivity (1.5 arcseconds resolution). The spectral setup was chosen to enable a scan for [CII]over essentially the full frequency range expected on the basis of our precise redshift constraints. We were able to execute this scan using just two separate tunings with three spectral windows each (S. Schouws et al. 2021, in prep). The full bandwidth for each scan was therefore 10.75 GHz in total. Approximately 40 minutes were required in each tuning to reach a sensitivity of 0.25 mJy per 66 km/s, which was chosen to ensure detection of [CII]158μm based on previous studies (e.g., Smit et al., 2018). The precipitable water vapor during the executed observations ranged from 1.6 to 3.5 mm.
Additionally, we also utilize the sensitive, higher spatial resolution band-6 observations we obtained of source COS-3018555981 (hereafter abbreviated to COS-3018). The purpose of those observations was to characterize in detail the kinematics of a galaxy with relatively luminous [CII]line and to determine if the kinematics were more consistent with simple rotation or a merging system. COS-3018 was one of two sources featured in Smit et al. (2018) and found to show prominent differential motion across the detected [CII]profile. Thanks to the depth of the band-6 observations on this source, we can also use them to characterize the IRX in this source.
In interpreting the ALMA results obtained for our galaxy targets, it is worthwhile asking whether our selection criteria for our targets might bias our results. After all, our selection of targets required that their [OIII]+H nebular emission lines be sufficiently strong to narrow the redshift likelihood distribution for sources. As we will discuss in Schouws et al. (2021, in prep), the median source in our selection only had a [OIII]+H EW of 500Å. Since this is consistent with the Å rest-frame EW derived by Endsley et al. (2021) for [OIII]+H for the population, we can conclude that our results appear to be representative.
2.2 ALMA Continuum Observations of Bright Galaxies
We additionally targeted the eight most luminous Lyman Break Galaxies at in UltraVISTA to obtain sensitive continuum constraints on their far-IR emission and obscured star formation. The targeted sources were identified as part of a search for bright Lyman-break galaxies at (Stefanon et al., 2017, 2019), where sources were required to have colors redder than 0.75 mag, to show a blue -continuum slope redward of the Balmer break, and a low-probability of being a low-redshift galaxy based on SED fits.
The eight sources were targeted as part of two ALMA programs #2017.1.01217.S (PI Stefanon) and #2018.1.00236.S (PI Stefanon) and observed for 35 minutes each. To optimize the probability for detection for [CII], we used band-6 to obtain continuum observations of those sources whose best-fit photometric redshifts were and band-5 to obtain continuum observations for those whose best-fit redshifts were . As a result of the relatively large photometric redshift uncertainties on the Stefanon et al. (2019) sources and the cost of pursuing spectral scans, we elected to use a single spectral setup to maximize the continuum sensitivity. We also obtained 58 minutes of follow-up observations (#2018.A.00022.S: PI Schouws) on one source from ALMA program #2017.1.01217, UVISTA-Y-004, in an effort to confirm a tentative 2.5 dust-continuum detection in that source.
| Sourcename | Redshift$\dagger$$\dagger$footnotemark: |
|
|
|
|
||||||||||
|---|---|---|---|---|---|---|---|---|---|---|---|---|---|---|---|
| UVISTA-Z-001 | 7.0611a | 23.9 | 1.88 | 2.9 | 9.58 | 104 | 5.0 | ||||||||
| UVISTA-Z-007 | 6.7498a | 24.5 | 2.02 | 1.5 | 9.57 | 52.2 | 2.2 | ||||||||
| UVISTA-Z-009 | 6.90 | 24.6 | 1.88 | 1.6 | 9.40 | 57.0 | 2.4 | ||||||||
| UVISTA-Z-010 | 7.07 | 24.6 | 2.39 | 1.1 | 8.88 | 44.1 | 2.1 | ||||||||
| UVISTA-Z-013 | 7.02 | 24.9 | 2.24 | 1.4 | 10.72 | 45.0 | 2.2 | ||||||||
| UVISTA-Z-019 | 6.7544a | 25.1 | 1.51 | 1.0 | 9.51 | 66 | 2.7 | ||||||||
| COS-3018 | 6.8540a | 24.9 | 1.22 | 1.3 | 9.14 | 65 | 3.0 | ||||||||
| UVISTA-Y-001 | 8.53 | 24.8 | 1.37 | 2.1 | 10.0 | 73 | 3.5 | ||||||||
| UVISTA-Y-002 | 8.21 | 24.8 | 2.60 | 1.9 | 9.0 | 39.9 | 2.3 | ||||||||
| UVISTA-Y-003 | 7.62 | 25.0 | 1.88 | 1.3 | 9.9 | 241 | 10.7 | ||||||||
| UVISTA-Y-004 | 7.42 | 24.9 | 1.80 | 1.5 | 9.9 | 65 | 2.9 | ||||||||
| UVISTA-Y-005 | 8.60 | 24.9 | 1.59 | 1.8 | 9.0 | 38.7 | 2.5 | ||||||||
| UVISTA-Y-006 | 8.32 | 25.3 | 1.70 | 1.2 | 9.7 | 39.6 | 2.5 | ||||||||
| UVISTA-Y-007 | 8.47 | 25.5 | 2.00 | 1.1 | —e | 53.7 | 2.5 | ||||||||
| UVISTA-Y-009 | 7.69 | 25.4 | 2.60 | 1.0 | —e | 53.6 | 2.5 | ||||||||
| Stack at z7c | 6.95 | 24.6 | 1.99 | 1.5 | 9.6 | 33 | 1.4 | ||||||||
| Stack at z8c | 7.87 | 25.1 | 2.13 | 1.5 | 9.3 | 27 | 1.3 | ||||||||
|
7.72 | 24.9 | 2.16 | 1.4 | 9.2 | 23.5 | 1.2 |
Note. — Quoted redshifts are based on the photometric redshift estimates given in Schouws et al. (2021, in prep) or Stefanon et al. (2019). -continuum slopes and stellar masses are from Stefanon et al. (2019) or use the methodology described in Stefanon et al. (2019) for these estimates, assuming a 0.2 metallicity a constant star formation prescription, and a Calzetti et al. (2000) dust law. aSpectroscopic redshifts are from the [CII]line (Schouws et al. 2021, in prep and Smit et al. 2018 for COS-3018). bIntegrated flux derived with UVMULTIFIT (not corrected for CMB effects: see §3.1). Upper limits on non detections are 3. cStack fluxes and errors are determined using a bootstrapping analysis (see section 3.2). dTotal infrared luminosity integrated from 8-1000m assuming a modified black body SED with a dust temperature of 50K and a dust emissivity index =1.6 after correcting for CMB effects (see §3.1). eDue to the challenges in measuring the flux of these sources in the Spitzer/IRAC data due to confusion from bright neighbors (Stefanon et al., 2019), no stellar masses are estimated for these sources.
2.3 ALMA Data Reduction
The ALMA data were reduced and calibrated using Casa version 5.4.1 following the standard ALMA pipeline procedures. The imaging was performed using the tclean task in Casa, applying natural weighting to maximize signal to noise. Any channels containing line emission from the [CII]line were carefully excluded from the continuum imaging. All significant continuum sources in the field were masked and cleaned conservatively to 3. A range of uv-tapers from 1.0 to 2.0 arcseconds were applied, but it was found that the images without any uv-tapering had the highest SNR. Therefore we use the setup without any uv-tapering for the remainder of this paper unless specified otherwise. We reduce the observations for COS-3018 in a similar way except applying a 1.5 arcsecond taper to the visibility data; the full resolution results will be presented in Smit et al. (2021, in prep).
To examine in more detail the relative morphologies of galaxies in terms of their far-IR dust-continuum emission and in the rest-frame , we also re-imaged the sources using Briggs-weighting with robustness parameter 0.3, where a robustness parameter of 2 corresponds to uniform weighting (which maximizes the spatial resolution of the continuum signal) and 2 to natural weighting (which maximizes the S/N). Our choice of 0.3 for the robustness parameter was made as a compromise between resolution and S/N. In particular, for the most luminous source UVISTA-Y-003 we used Briggs weighting to decrease the size of our beam from 0.60”0.52” beam to a 0.45”0.37”. This is useful to constrain the physical alignment between the UV and FIR, which will be further discussed in Section 3.3.
2.4 Near-IR Imaging Observations
In interpreting the dust-continuum observations for our -8 sources, it is helpful to compare against the sensitive imaging observations that are available for these targets in the near-IR. All 14 of our targets have available sensitive imaging observations from the UltraVISTA program, albeit with limited (FWHMPSF 0.8′′) spatial resolution. For a few sources, higher spatial resolution imaging observations exist from HST, in particular for UVISTA-Z-001 (1-orbit in F140W: Bowler et al., 2017), UVISTA-Y-003 (1-orbit in F160W, DASH: Momcheva et al., 2016) and COS-3018 (1.3-orbits in F160W, CANDELS: Grogin et al., 2011).
To ensure good registration of the available near-IR observations with our new ALMA-continuum observations, we took advantage of the high astrometric accuracy of the GAIA DR2 catalog (Gaia Collaboration et al., 2018) to make minor (0.1) adjustments to the astrometry of the near-infrared imaging observations available for the COSMOS field from UltraVISTA or HST (if available). As a further check on the astrometric accuracy of the near-IR imaging data, we compared the position of eight lower-redshift dust-continuum detections in our ALMA data with their position in the near-IR imaging data and found good agreement (0.2).
3 Results
3.1 Individual Detections
The new ALMA observations we have obtained on a significant sample of 15 bright -8 galaxies provide us with essential new information on the obscured star formation and dust-continuum emission in these sources.
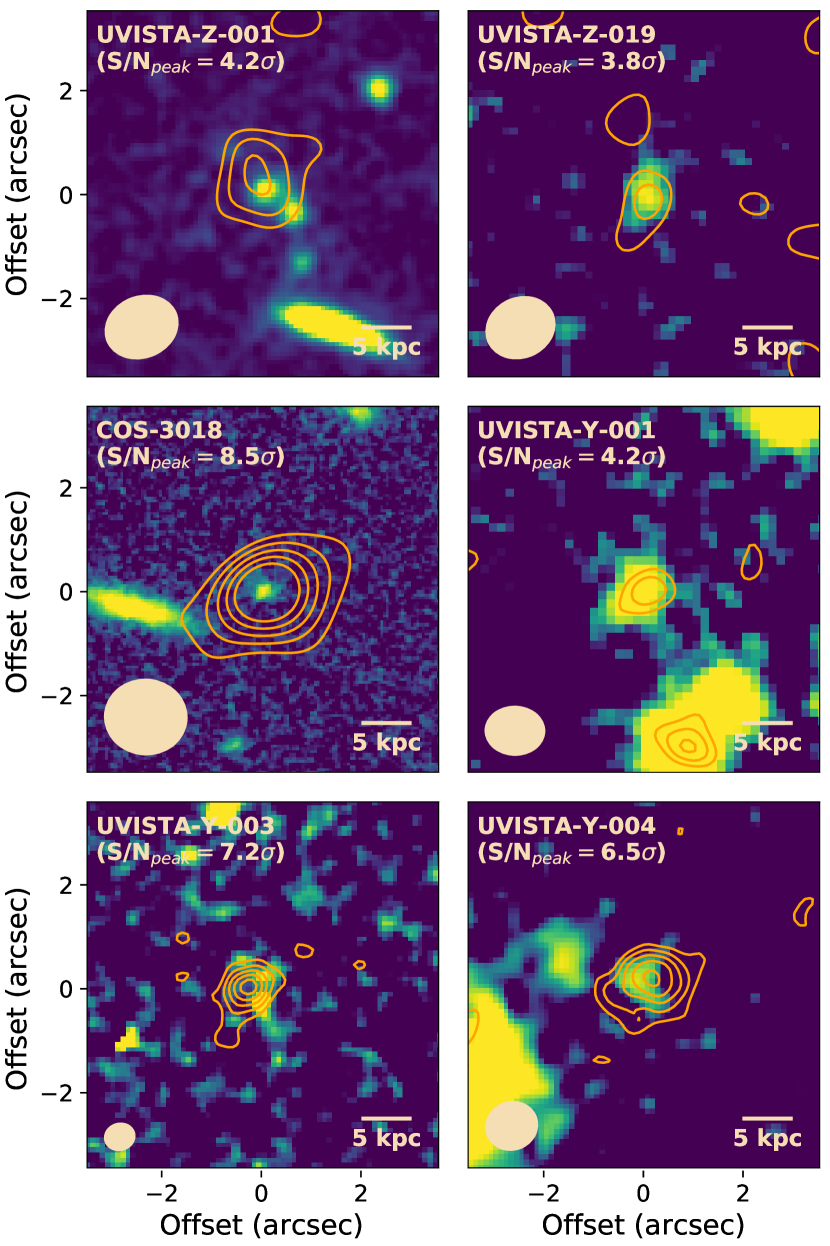
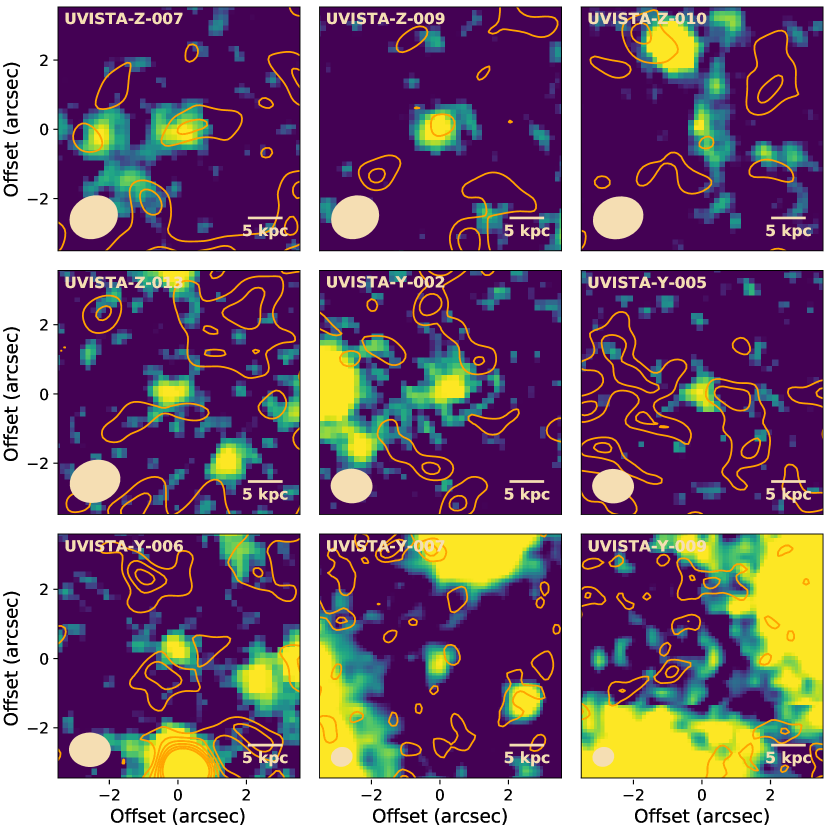
Using naturally-weighted reductions of the continuum observations, we performed a systematic search for 3 peaks within 1 of the rest- positions of our 15 targeted sources. We find a significant dust continuum detection for six of the sources, as is illustrated in Figure 1, which shows the 2, 3, 4, 5, 6 dust-continuum contours overlaid on the rest- emission. The continuum detections show 0.5 spatial offsets from the UV positions. We note that allowing for large spatial offsets (e.g., to 3) does not increase the number of detected sources.
To measure continuum fluxes for the detected sources, the complex visibilities were fitted using UVMULTIFIT (Martí-Vidal et al., 2014), applying a 2D Gaussian model with a single component. By fitting in the (u,v)-plane, the results are independent of the imaging parameters. The fluxes measured in this way are consistent with measurements in the image plane and measured fluxes range from 75 Jy to 302 Jy, comparable with previous studies at 7 (Watson et al., 2015; Willott et al., 2015; Laporte et al., 2017; Knudsen et al., 2017; Bowler et al., 2018; Tamura et al., 2019; Hashimoto et al., 2019). In the case of non-detections, we provide upper limits derived from the noise measured in the natural weighted imaging. For convenience, we summarize the results in Table 2. The fluxes in this table have not been corrected for effects arising from the Cosmic Microwave Background (CMB). For derived quantities (, etc.) we correct the measured fluxes for the reduced contrast due to the higher temperature of the CMB at high redshifts using Eq. (18) of da Cunha et al. (2013).
For comparison with other results in the literature and lower redshift studies, it is convenient to estimate the total infrared luminosities for the sources in our sample. Following previous studies, we adopt a modified single-temperature black body (greybody) dust spectral energy distribution and integrate the SED between 8-1000m to calculate . For the dust emissivity index we assume =1.6, which is the best-fitting value for local infrared luminous galaxies (Casey et al., 2014).
Dust temperatures in typical star-forming galaxies in the local universe are around 35 K (Casey et al., 2014; Rémy-Ruyer et al., 2015), but it has been shown using stacking of Herschel observations that dust temperatures increase with redshift (Béthermin et al., 2015; Schreiber et al., 2015, 2018; Faisst et al., 2017, 2020). Other observational (e.g., Bouwens et al., 2016b; Coppin et al., 2014; Knudsen et al., 2017; Capak et al., 2015; Watson et al., 2015; Bouwens et al., 2020) and theoretical (Behrens et al., 2018; Liang et al., 2019; Sommovigo et al., 2021) studies also suggest such a trend. We therefore adopt a dust temperature of 50K for our analysis (this is the dust temperature after any CMB heating).
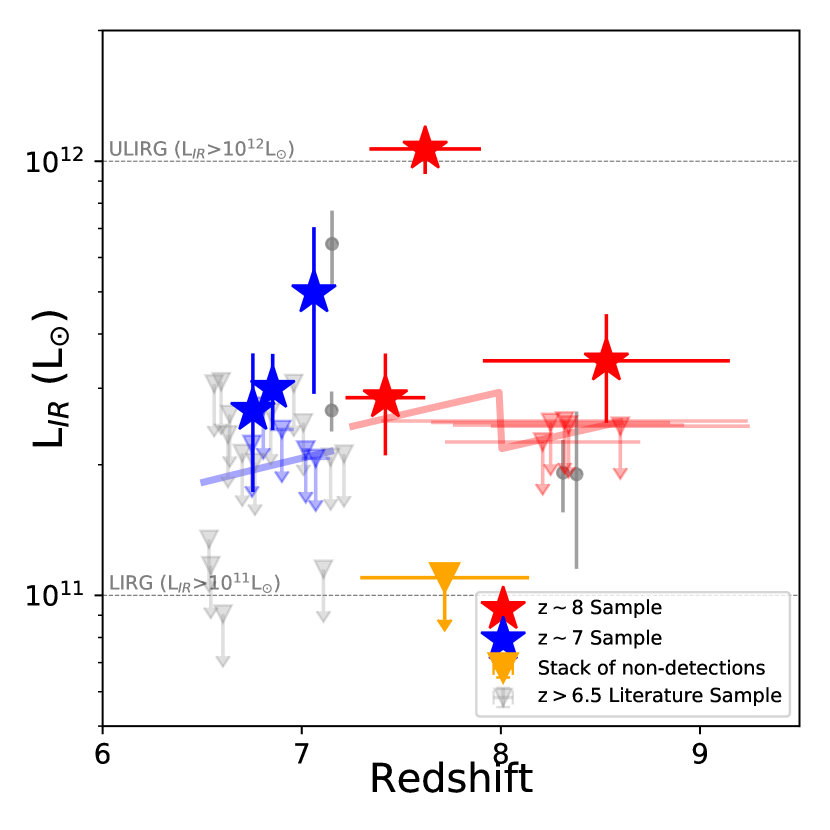
To put our dust continuum detections in context, we show the IR luminosities we have inferred for the sources in our samples vs. redshift in Figure 2 and then compare these detections with IR luminosities inferred for other dust-detected galaxies at . Interestingly enough, one of our galaxies has an IR luminosity in excess of , which places the source in the ULIRG category and is the most IR-luminous galaxy known at . For context, we have also estimated the limiting luminosities to which we would have succeeded in detecting bright and galaxies, given the integration times for sources in the two samples.
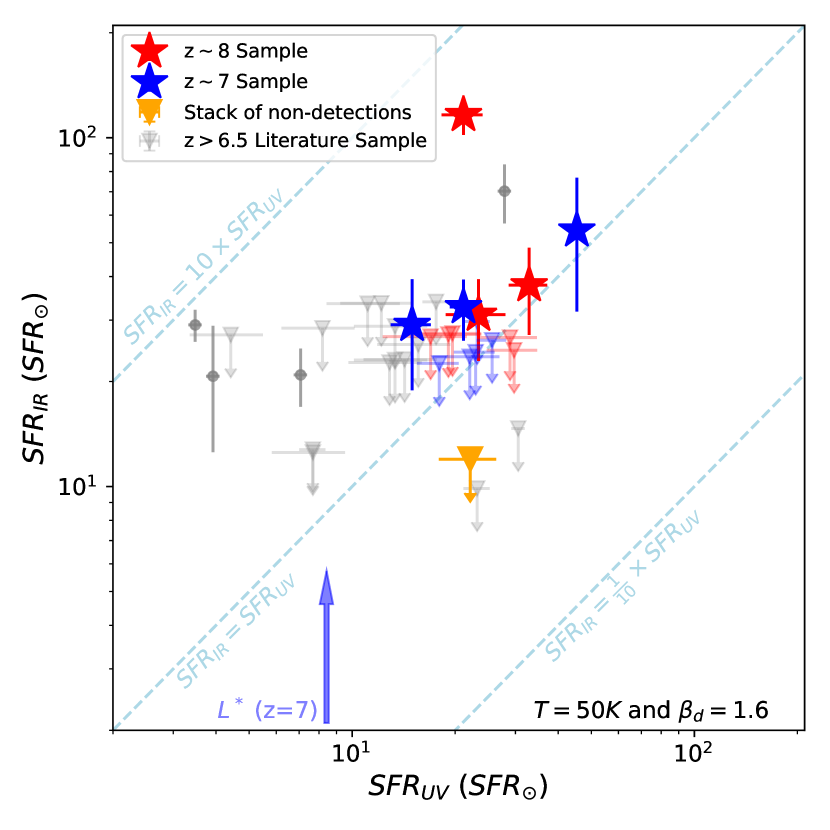
We estimate and for sources following Madau & Dickinson (2014), with and where and and we convert from a Salpeter IMF to Chabrier IMF with (Madau & Dickinson, 2014). We compare these SFR estimates for our sources to previous detections and upper limits at 6.5 (Ota et al., 2014; Maiolino et al., 2015; Watson et al., 2015; Pentericci et al., 2016; Inoue et al., 2016; Knudsen et al., 2017; Bradač et al., 2017; Laporte et al., 2017; Bowler et al., 2018; Carniani et al., 2018; Hashimoto et al., 2018; Smit et al., 2018; Hashimoto et al., 2019; Tamura et al., 2019; Matthee et al., 2019) in Figure 3.
Interestingly enough, we find that the obscured star formation rates for sources are fairly similar to the unobscured star formation rates , in cases where the dust is detected. This is consistent with previous results in the literature which include a few prominent detections where (Knudsen et al., 2017; Laporte et al., 2017; Bowler et al., 2018; Hashimoto et al., 2019; Tamura et al., 2019) and many sources which lack prominent dust detections and (Ota et al., 2014; Maiolino et al., 2015; Watson et al., 2015; Pentericci et al., 2016; Matthee et al., 2017, 2019).
3.2 Stacking analysis
Nine of the bright -8 galaxies targeted by our ALMA programs are not individually detected in our continuum observations. To better characterize dust-continuum emission and obscured star formation in these sources, we can combine the continuum observations on these sources to obtain an average constraint through median-stacking. In addition to stacking those sources which are individually undetected, we repeat the stacking analysis using our entire and samples separately, to constrain the properties of the median source in each sample.
For the stacking, we center sources according to their apparent position in the available HST or UltraVISTA rest-UV observations and coadd the ALMA continuum observations after tapering the continuum images with a 1-arcsec taper and and weighting the sources equally. We use tapered images to ensure that we capture all of the dust-continuum flux and to decrease the impact of both (1) the varying resolutions of the ALMA beam and (2) offsets between the dust continuum and UV emission on the stack. This most relevant for the sources that were observed with a smaller beam, i.e., .
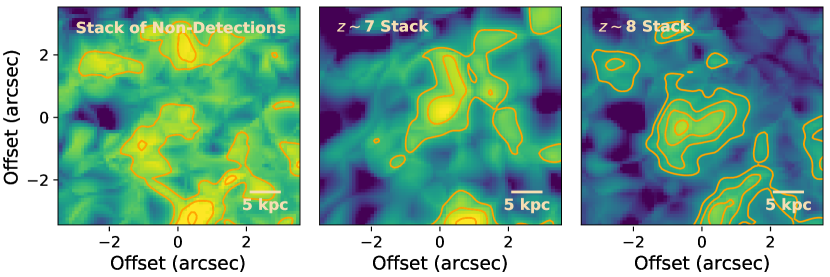
The results of the stack of the nine non-detections are presented in both Table 2 and Figure 4 (left panel). No significant (2) detection is found, which translates to a 3 upper limit of 1.2 (assuming T=50K and =1.6) on the IR luminosities of the undetected sources (the stack is also not detected when stacking using a weighted mean). In Table 2 and Figure 4, we also present our stack results for our and samples. A stack of our sample shows a detection and a stack of our sample shows a detection. The mean IR luminosities we infer for bright and is 1.4 and 1.3 , respectively. These results and those presented in Table 2 are derived based on a bootstrap resampling procedure, re-stacking sub-sets with replacement of our sources 10.000 and using the median peak flux measured in the stacked images. The uncertainties are based on the derived 68 spread in the stack results.
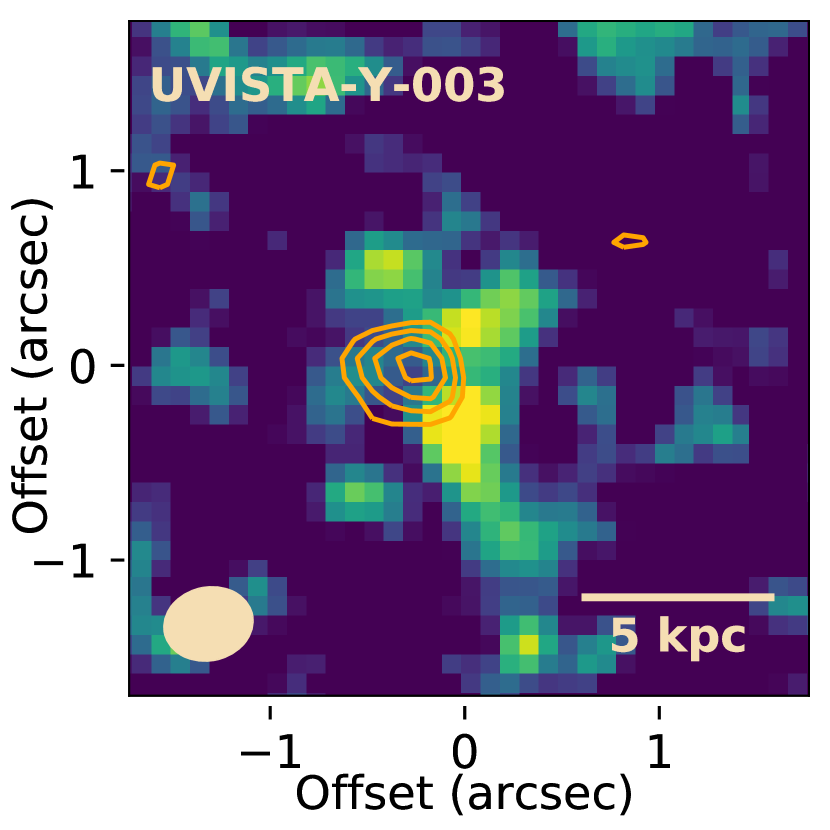
3.3 Physical alignment between UV and FIR
An important longstanding question regards the possible presence of spatial offsets between the dust-continuum emission and the rest- emission, as have frequently been found when considering IR luminous galaxies (Smail et al., 2014; Dunlop et al., 2016; Aravena et al., 2016; Laporte et al., 2019). Indeed, one would expect significant spatial offsets between rest- and -continuum emission in galaxies with a non-uniform dust covering fraction, especially when the optical depths become non-negligible.
To investigate whether similar spatial offsets are found amongst the bright -8 galaxies we observe with ALMA, we reimage the sources using Briggs weighting, as described in §2.3, with a beam of 0.45”0.37” to examine sources at higher spatial resolution. Figure 5 illustrates how our most prominent dust-continuum detection UVISTA-Y-003 compares to the available rest- imaging from HST.
For the majority of our sources, the UV and FIR continuum seem well aligned, with the exception of UVISTA-Y-003, which is offset by 0.3 arcseconds (2 kpc: see Figure 5). Furthermore, for this source the rest- emission seems to be divided into three separate clumps, each of which are offset from the dust emission. The clumps are discussed in more detail in Stefanon et al. (2019), who performed simulations to assess the robustness of the clumps and also confirmed high- solutions for the clumps based on deblended photometry. Because of these offsets between the clumps and the dust continuum emission, it seems likely that there is a high star formation region in UVISTA-Y-003, which is almost entirely obscured in the rest-, similar to what is observed in ULIRGs at and -3. It is unclear whether the three rest- components indicate the presence of merging activity or not. It is worth emphasizing the value of the high resolution space-based imaging for UVISTA-Y-003 in revealing both the clumpy nature of this source and the offset between the UV and dust continuum emission.
3.4 Infrared Excess versus UV continuum Slope
The measured infrared excess in galaxies () is well established to show a correlation with the -continuum slope (where ). Meurer et al. (1999) showed that the correlation between the infrared excess and could be expressed as follows:
| (1) |
| (2) |
where expresses the steepness of the attenuation law and represents the unattenuated -continuum slope of star-forming galaxies. The IRX- relation has been used as a constraint on the dust attenuation curve of galaxies. In the local universe, starburst galaxies have been shown (Meurer et al., 1999) to be well described by a Calzetti attenuation law (Calzetti et al., 2000), with with . However, subsequent studies have found that some galaxies at higher redshifts do not follow Calzetti dust law and tend to favour a steeper attenuation curve, similar to the Small Magellanic Cloud (SMC) for which and =2.23 (Reddy et al., 2006, 2018; Siana et al., 2008; Capak et al., 2015; Bouwens et al., 2016b; Barisic et al., 2017; Fudamoto et al., 2020).
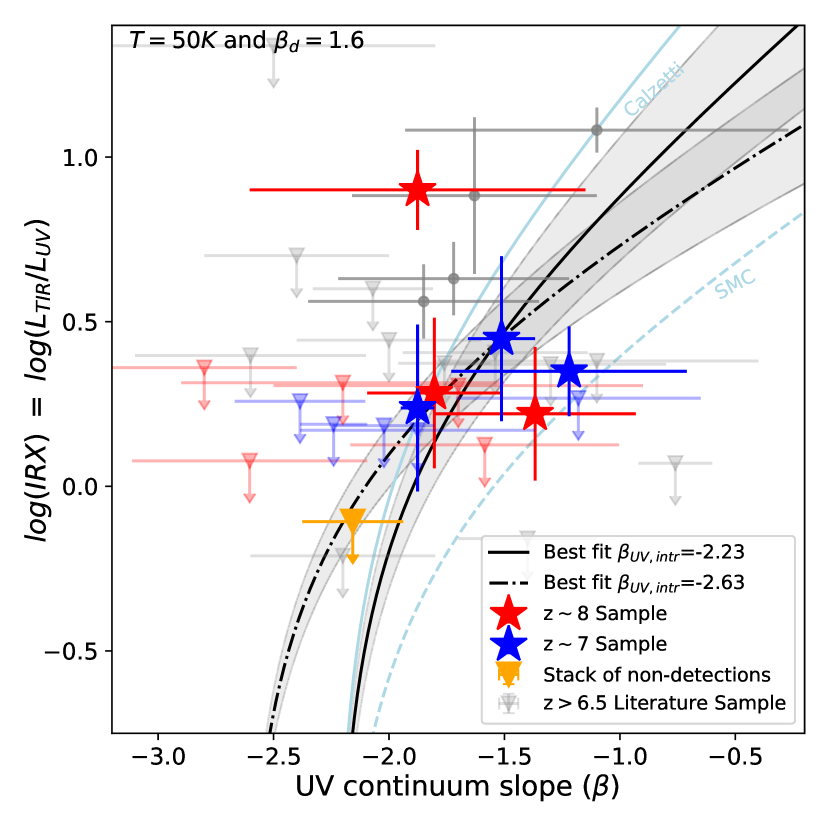
In Figure 6, we present our measurements for the infrared excess (IRX ) versus the UV continuum slope () for sources with new measurements from our ALMA programs. In determining the best-fit value for , we consider two different values for : (1) , as used in modeling the IRX- relation at (Meurer et al., 1999) and (2) , as expected for a younger, lower-metallicity stellar population (Reddy et al., 2018) seen at higher redshift. For these two values of we determine the best-fit value for for a dust temperature of 50 K and dust emissivity index . For these fits we use the detections and non-detections described in this paper and a compilation from the literature (M21.5; Maiolino et al., 2015; Pentericci et al., 2016; Inoue et al., 2016; Matthee et al., 2017, 2019; Hashimoto et al., 2019) and determine the best fit value and errors using a total least squares method which takes account of errors in both dependent and independent parameters.
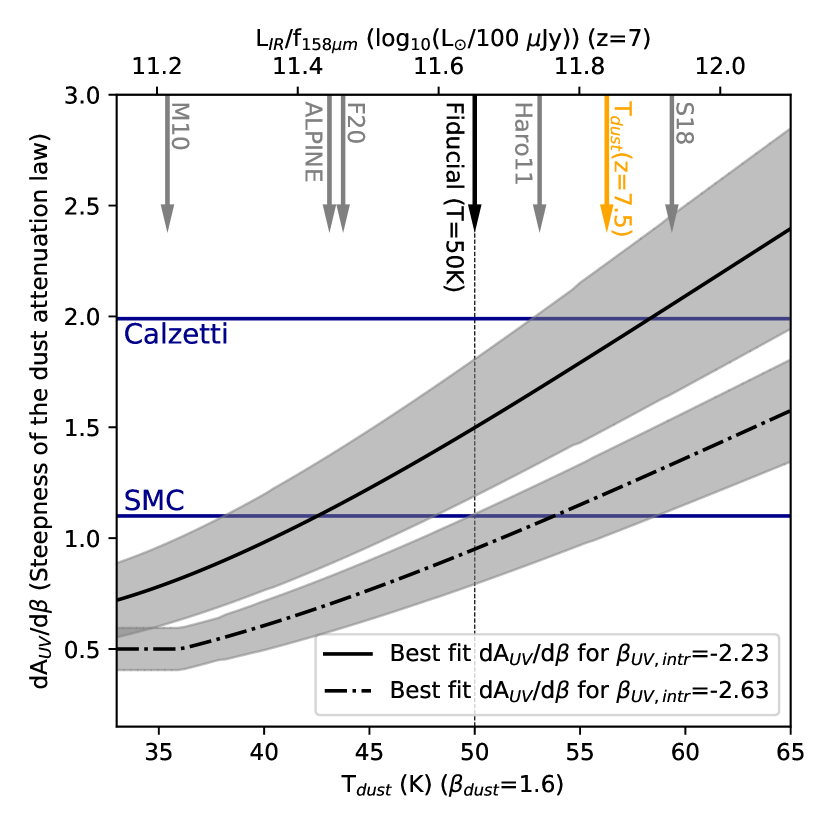
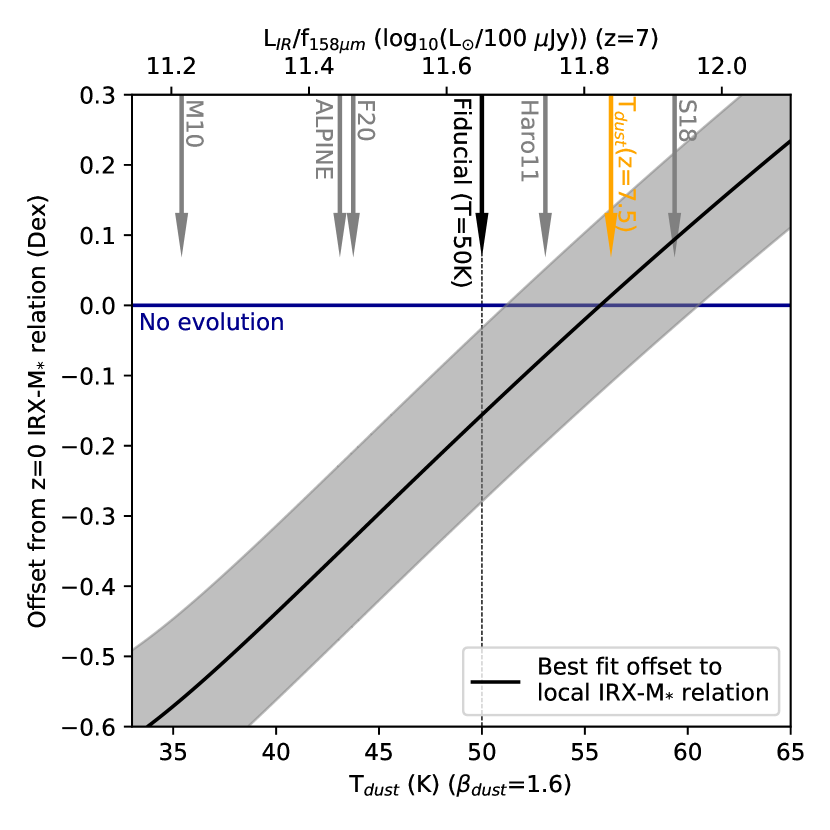
In Figure 7, we generalize the fit results presented in Figure 6 for to allow for an arbitrary dust temperature, given the current uncertainties in establishing the typical dust temperatures for galaxies. The slopes () of the SMC and Calzetti attenuation curves are shown with horizontal blue lines. On Figure 7, we indicate with a black arrow (and dotted vertical line) the fiducial dust temperature we assume 50 K. We also indicate with an orange arrow the determination of 54.31.6 K that Bouwens et al. (2020) derived by extrapolating the results from Béthermin et al. (2015), Strandet et al. (2016), Knudsen et al. (2017), Schreiber et al. (2018), Hashimoto et al. (2019), Bakx et al. (2020), Béthermin et al. (2020), Harikane et al. (2020), and Faisst et al. (2020). Also shown on Figure 7 are where other high-redshift SED templates would lie (Béthermin et al., 2015; Schreiber et al., 2018; Faisst et al., 2020; Michałowski et al., 2010; Rossi et al., 2018), including Haro11, which has been argued by Rossi et al. (2018) to be a good low redshift analogue for LBGs and has a relatively high dust temperature, and the ALPINE SED template (Béthermin et al., 2020), which is based on a stacking analysis of the ALPINE target and analogue galaxies fitted to models from Béthermin et al. (2017). The Michałowski et al. (2010) template is based on the average SED from a sample of submillimeter galaxies (SMGs). Finally we also indicate the approximate conversion factor and dust temperatures found by Faisst et al. (2020) analyzing a small sample of galaxies using the Casey et al. (2018) models.
For our fiducial dust temperature of 50 K and assuming , the current results appear to be more consistent ( signifiance) with a SMC-like attenuation law than a Calzetti-like attenuation law, while for a , current results lie somewhere between a Calzetti and SMC-like attenuation law. The present results are similar to earlier results by Watson et al. (2015), Laporte et al. (2017), Knudsen et al. (2017), Bowler et al. (2018), and Tamura et al. (2019) who also found greater consistency with a Calzetti-like attenuation law when assuming .
3.5 IRX-Stellar Mass relation
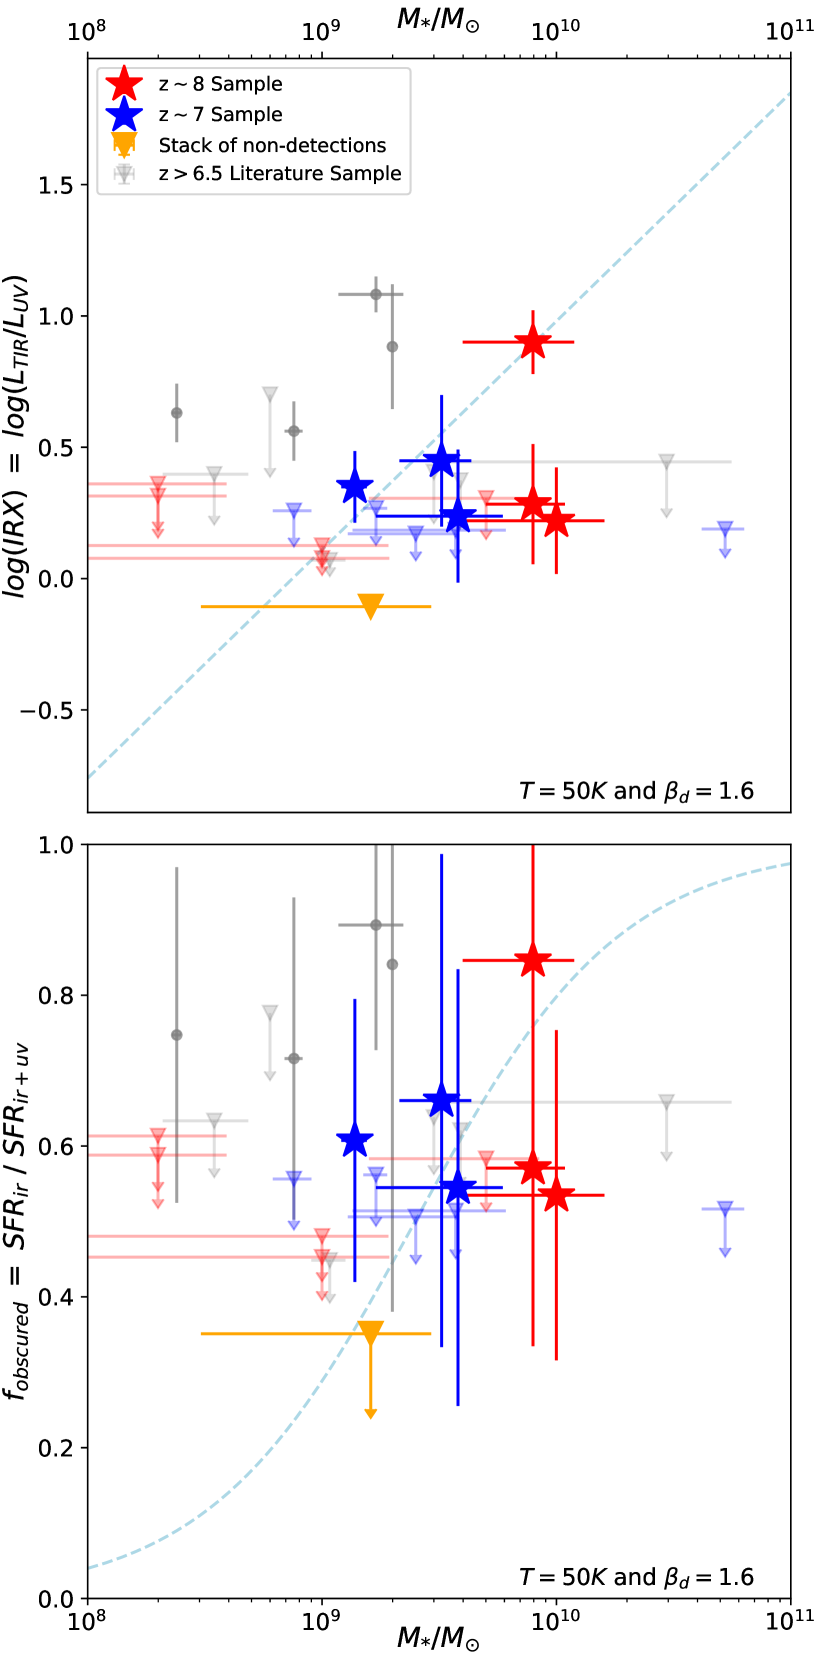
The infrared excess is also known to show a strong correlation with the stellar mass of sources, with an approximately linear power-law dependence on stellar mass (e.g., Bouwens et al., 2016a; Dunlop et al., 2016; McLure et al., 2018). Interestingly enough, little evolution is observed between and in the relationship between the infrared excess and the stellar mass (Pannella et al., 2015; Bouwens et al., 2016b; Whitaker et al., 2017; McLure et al., 2018).
In Figure 8 (upper panel), we present the infrared excess we derive for our sources vs. their inferred stellar masses. The blue and red stars correspond to and galaxies, respectively, detected in the dust-continuum, while the light blue and light red upper limits correspond to sources which are not detected in the dust continuum (). The grey circles show dust-continuum detections from the literature. Stellar masses for bright sources in our selection are as inferred in Stefanon et al. (2019). Stellar masses for bright sources are inferred using the same SED-fitting assumptions as Stefanon et al. (2019) use at , i.e., with a 0.2 metallicity, constant star formation rate, and Calzetti et al. (2000) dust curve. The lower panel in Figure 8 shows fraction of obscured star formation vs. stellar mass. Our results seem fairly consistent with the relation presented in Whitaker et al. (2017).
Similar to Figure 7, we illustrate in Figure 9 how the normalization in the IRX-stellar mass relation depends on the assumed dust temperature of -8 galaxies. We quantify the normalization in terms of an offset (in dex) from the low-redshift relation (Whitaker et al., 2017) and fit this offset as a function of dust temperature in a similar way as described in Section 3.4. As in Figure 7, the vertical orange line indicates the expected temperature for -8 galaxies when extrapolating lower redshift results. At this temperature, the offset we derive is consistent with no evolution from . Not surprisingly, for lower and higher values of the dust temperature, the IRX is lower and higher respectively than the relation.
4 Discussion
4.1 Constraints on Dust Evolution Models
Our new observations provide constraints on the build-up of dust in early high-redshift galaxies. In addition to the significant impact dust has on the fraction of light seen from star-forming galaxies and that re-emitted in the far-infrared, dust can play a critical role in galaxy evolution (Salim & Narayanan, 2020). Significantly, the surfaces of dust grains serve as the main production sites of many molecular species and can catalyze the formation of molecular clouds in which star formation (SF) takes place (e.g., Gould & Salpeter, 1963; Cazaux & Tielens, 2004; Hirashita & Ferrara, 2002; Yamasawa et al., 2011; Chen et al., 2017). Additionally, dust cooling induces fragmentation inside molecular clouds, which has a significant impact on the stellar initial mass function (IMF; Omukai, 2000; Omukai et al., 2005; Schneider et al., 2006).
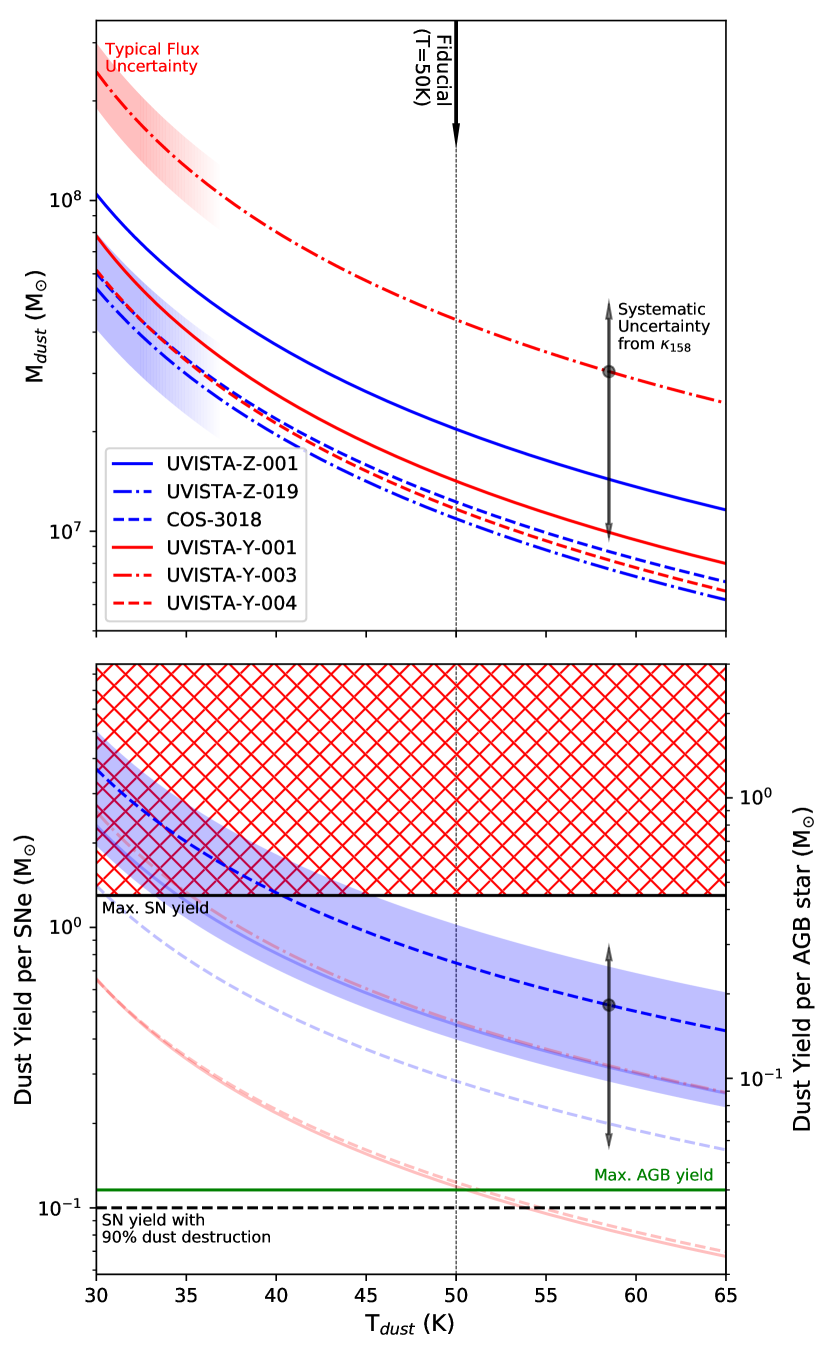
In Figure 10, we show estimates for the dust masses of our sources as a function of temperature, and a strong dependence on the assumed dust temperature can be clearly seen. We derive our estimates for the dust masses of our sources following the procedure described in Ota et al. (2014):
| (3) |
where is the observed flux density after correction for contrast with the CMB (da Cunha et al., 2013, equation 18), is the luminosity distance, is the Planck function at a rest-frame frequency and dust temperature , and finally is the dust mass absorption coefficient, which scales as = . Here we assume = 8.94 at 158 m which is appropriate for dust ejected from SN after reverse shock destruction (Hirashita et al., 2014), since it is expected that the majority of dust is produced by SN (Michałowski, 2015; Leśniewska & Michałowski, 2019). Alternatively, values ranging from = 28.4 at 158 m for dust consisting of amorphous carbon to = 5.57 at 158 m for dust condensed in SN before reverse shock destruction (Hirashita et al., 2014) could be considered, leading to an additional 0.7 dex systematic uncertainty. The impact of these systematic uncertainties is shown with the black arrow on Figure 10. Because our data are observed at 158 m rest-frame, which is the same as the calibration wavelength of the dust mass absorption coefficient, our choice of introduces minimal uncertainty in the derived dust masses. While most of our galaxies appear consistent with dust masses of , the large systematic uncertainty limits us to inferring that the dust mass lies somewhere in the range to for our sources.
In the bottom panel of Figure 10 we use these dust masses in combination with the stellar mass from SED fitting to derive the required dust yields per SNe or AGB star following the method described by Michałowski et al. (2010). The stellar mass is translated to the number of SNe or AGB stars that could have contributed to the formation of dust assuming a Chabrier (2003) IMF and a maximum age of 500 Myr. This number is subsequently divided by the dust mass to obtain the required yields. We compare the required yields for our observed dust masses to the maximum yield from a single AGB star (0.004 M⊙: Morgan & Edmunds, 2003; Ferrarotti & Gail, 2006; Ventura et al., 2012; Nanni et al., 2014; Schneider et al., 2014) and a single supernova without any dust destruction (approximately 1.3 M⊙: Todini & Ferrara, 2001; Nozawa et al., 2003). However, it is likely that a large portion of the dust produced by supernovae is destroyed by internal shocks, realeasing only 0.1 into the ISM (Bianchi & Schneider, 2007; Cherchneff & Dwek, 2010; Gall et al., 2011; Lakićević et al., 2015).
From this figure it is clear that for our sources dust production from supernovae alone could explain the majority of the observed dust, but only when dust destruction is low (less than 90%). Production from AGB stars by itself (green line) is insufficient to explain the observed dust masses for all dust temperatures. For low dust temperatures T40K even dust production from supernovae without any dust destruction would be insufficient and other mechanism like grain growth (Michałowski, 2015; Leśniewska & Michałowski, 2019) would be necessary to explain the observed dust masses.
4.2 Impact on Measurements of the SFR Density and the IR luminosity function at
The ALMA observations from our programs have particular value in determining the quantity of the star formation from bright galaxies at -8 that is obscured by dust. This is particularly useful for gaining a handle on the likely build-up of mass that occurs in the brightest and most massive galaxies with cosmic time.
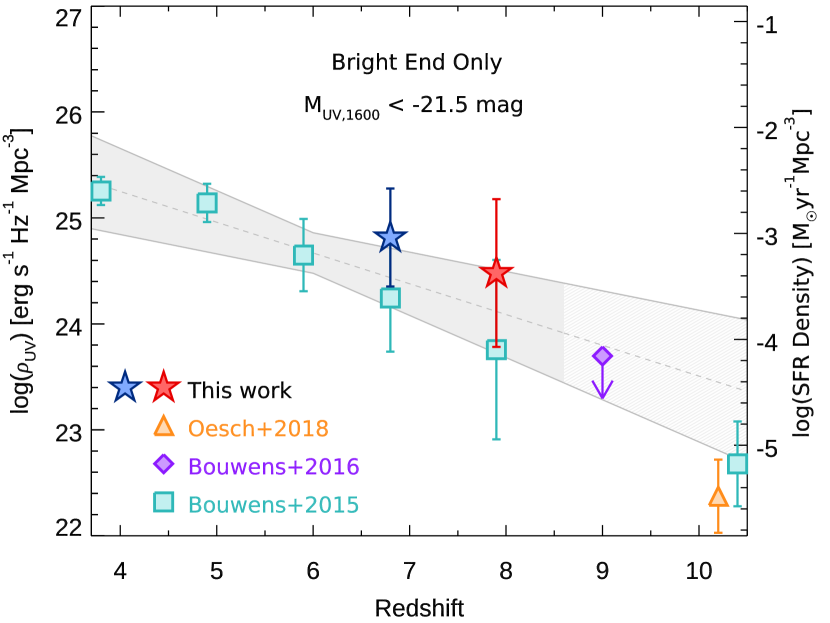
To estimate the approximate correction that we need to make to the SFR density of bright -8 galaxies to correct for the impact of dust, we compute an effective infrared excess for the entire population of bright and we have targeted as part of multiple programs by dividing the mean SFRIR by the mean SFRUV. Using our bootstrap stacking results from section 3.2, we can compute the median ratio and errors (68%) on the obscured and UV luminous star formation rates to be 0.5 and 0.6, respectively. This suggests that unobscured SFRs measured from the rest- data should be corrected by factors of 1.5 (0.18 dex) for and 1.6 (0.20 dex) for .
We can illustrate the impact these corrections have on the estimated SFR densities at -8 from bright galaxies based on the LFs derived by Bouwens et al. (2015) and Stefanon et al. (2019) integrated down to 21.5 mag (1.7 ). Applying these corrections to the UV luminosity density Bouwens et al. (2015) derive at and Stefanon et al. (2019) derive at , we show the impact of these corrections on the computed SFR densities at -8 in Figure 11. Our ALMA results suggest that of the SFR density in 1.7 galaxies is obscured by dust. This is consistent with the 20-25% fraction of the cosmic star formation rate density that Zavala et al. (2021) infer to be obscured at -7, but it is worth emphasizing that the fraction we infer is for the -bright population and the fraction Zavala et al. (2021) derive is with respect to the total.
Finally, we can combine the present constraints on the IR luminosities of sources with the -8 rest- luminosity function results of Bowler et al. (2017) and Stefanon et al. (2019) to place constraints on the IR LF at such as discussed in Koprowski et al. (2017), Casey et al. (2018), Gruppioni et al. (2020), and Zavala et al. (2021). We find that the number density of galaxies with /yr is Mpc-3 dex-1. This limit is fairly consistent with the dust poor model described in Casey et al. (2018), being 0.3 dex lower. This lower however excludes the model evolution of the IR luminosity function presented in Koprowski et al. (2017).
5 Summary
We describe the analysis of sensitive ALMA continuum observations we have obtained over 15 bright Lyman-break galaxies at -8. The ALMA continuum observations we consider (25.7 hours in total on source) are drawn from five distinct ALMA programs (Table 1) and allow us to assess the contribution of obscured star formation to the build-up of stellar mass in these galaxies. The observations are sensitive enough to probe down to unobscured SFRs of 20 /yr (3). The bright Lyman-break galaxies we have targeted were drawn from a selection of the brightest -8 galaxies identified over the UltraVISTA (Stefanon et al., 2017, 2019, S. Schouws et al. 2021, in prep) and CANDELS COSMOS field (Smit et al., 2015, 2018).
Out of the 15 -8 galaxies we target, we detect six in the dust continuum, with inferred IR luminosities ranging from to , with a median of . This is equivalent to obscured SFRs of 25 to 101 /yr (Figure 1). These dust detections more than double the number of normal star-forming galaxies at which are detected in the IR continuum from four (Watson et al., 2015; Laporte et al., 2017; Tamura et al., 2019; Bowler et al., 2018; Hashimoto et al., 2019) to 10 (Figure 2). We find the spatial position of dust-continuum detections to be approximately cospatial with the rest- light (median offset 0.2”), with UVISTA-Y-003 being a notable exception. For UVISTA-Y-003, the dust-continuum detection is offset by 0.3 from three distinct star-forming clumps seen in the rest- (Figure 5).
Using the new dust-continuum detections, we can quantify the relative contribution that obscured and unobscured star formation provide to bright galaxies at -8. For the 6 bright galaxies in our sample which show ALMA continuum detections, we find that obscured SFR in these galaxies is comparable to the unobscured SFR in the median (Figure 3).
We also use our observations to look at the measured infrared excess IRX () in these galaxies and quantify how the infrared excess depends on the -continuum slope and the stellar mass. The infrared excess IRX is well known to correlate with both quantities, but there continues to be significant debate regarding the precise trend at with both and stellar mass.
Our IRX vs. results show a significant dependence on what we assume for the dust temperature of -8 galaxies as well as what we assume for the unreddened slope for star-forming galaxies at -8. If we adopt a modified blackbody SED with a dust temperature of 50 K and an opacity index as our fiducial far-IR SED, we find current IRX vs. results are most consistent with an SMC dust curve if and lie somewhere between a Calzetti and SMC dust curve if (Figure 6). Adopting the same fiducial SEDs for interpreting IRX trends with stellar mass, we find results (Figure 8) which are consistent with no evolution in IRX-stellar mass relation from (Whitaker et al., 2017).
Additionally, we use our new dust detections to estimate the total mass in dust in bright -8 galaxies, for dust ejected from SN after reverse shock destruction. The dust masses we derive are dependent on the assumed dust temperature and range from for low dust temperatures (T30K) to for high temperatures (T60K) (Figure 10). Combining these dust masses with the estimates for the stellar mass from SED fitting enable constraints on dust formation mechanisms (following Michałowski (2015). This shows that the our observed dust masses could be most likely be explained by dust production from SNe with low dust destruction (less than 90%: see bottom panel of Figure 10).
The new measurements we make of the obscured SFRs in bright -8 allow us to improve our estimates of the contribution very luminous bright galaxies make to the SFR density at -8. Incorporating the contribution from obscured star formation for both our bright (1.7) and sample to the unobscured SFRs in these galaxies, we measure correction factors of 1.5 (0.18 dex) and 1.6 (0.20 dex), respectively. These results clearly illustrate the important role that obscured star formation can play in the early stellar mass build-up of galaxies at .
Finally, we use these results to set a lower limit on the IR luminosity function of -8 galaxies, finding Mpc-3 dex-1 for galaxies with /yr. This limit is most consistent with the dust poor model of Casey et al. (2018), being 0.3 dex lower.
In the future, we expect a significant increase in the number of dust detected galaxies in normal star-forming galaxies at -8 from the ongoing ALMA observations from the REBELS ALMA Large program (2019.1.01634.L). This should allow us to look at the build-up of dust in massive galaxies in much more detail, while allowing for a much more detailed look into how the measured IRX depends on both stellar mass and the slope.
Acknowledgements
We are greatly appreciative to our ALMA program coordinators Daniel Harsono and Carmen Toribio at ALLEGRO for support with our ALMA programs. This paper makes use of the following ALMA data: ADS/JAO.ALMA#2017.1.01217.S,
ADS/JAO.ALMA#2017.1.00604.S,
ADS/JAO.ALMA#2018.1.00236.S,
ADS/JAO.ALMA#2018.1.00085.S
and ADS/JAO.ALMA#2018.A.00022.S. ALMA is a partnership of ESO (representing its member states), NSF (USA) and NINS (Japan), together with NRC (Canada), MOST and ASIAA (Taiwan), and KASI (Republic of Korea), in cooperation with the Republic of Chile. The Joint ALMA Observatory is operated by ESO, AUI/NRAO and NAOJ. SS and RB acknowledge support from TOP grant TOP1.16.057 and a NOVA (Nederlandse Onderzoekschool Voor Astronomie) 5 grant. RS acknowledges support from an STFC Ernest Rutherford Fellowship (ST/S004831/1). JH acknowledges support of the VIDI research programme with project number 639.042.611, which is (partly) financed by the Netherlands Organisation for Scientific Research (NWO). SC acknowledges support from the European Research Council No. 74120 INTERSTELLAR.
Appendix A ALMA Observations of Bright -8 Galaxies that are Undetected in the Dust Continuum
Nine of the 15 bright -8 galaxies (60%) targeted by the ALMA programs considered here did not show detections in the dust continuum. Figure 12 shows rest- images of those nine sources along with (1, 2, 3, 4, 5) contours showing the dust continuum emission. Interestingly enough, in the observations we obtain of UVISTA-Y-006, one foreground galaxy in our ALMA beam shows a clear dust-continuum detection (lowest row in Figure 12, left panel).
References
- Álvarez-Márquez et al. (2016) Álvarez-Márquez, J., Burgarella, D., Heinis, S., et al. 2016, A&A, 587, A122. https://doi.org/10.1051/0004-6361/201527190
- Aravena et al. (2016) Aravena, M., Decarli, R., Walter, F., et al. 2016, The Astrophysical Journal, 833, 68. https://doi.org/10.3847%2F1538-4357%2F833%2F1%2F68
- Aravena et al. (2020) Aravena, M., Boogaard, L., Gónzalez-López, J., et al. 2020, The Astrophysical Journal, 901, 79. https://doi.org/10.3847/1538-4357/ab99a2
- Ashby et al. (2018) Ashby, M. L. N., Caputi, K. I., Cowley, W., et al. 2018, The Astrophysical Journal Supplement Series, 237, 39. https://doi.org/10.3847%2F1538-4365%2Faad4fb
- Bakx et al. (2020) Bakx, T. J. L. C., Tamura, Y., Hashimoto, T., et al. 2020, MNRAS, 493, 4294
- Barisic et al. (2017) Barisic, I., Faisst, A. L., Capak, P. L., et al. 2017, The Astrophysical Journal, 845, 41. https://doi.org/10.3847%2F1538-4357%2Faa7eda
- Bañados et al. (2015) Bañados, E., Decarli, R., Walter, F., et al. 2015, The Astrophysical Journal, 805, L8. https://doi.org/10.1088%2F2041-8205%2F805%2F1%2Fl8
- Behrens et al. (2018) Behrens, C., Pallottini, A., Ferrara, A., Gallerani, S., & Vallini, L. 2018, MNRAS, 477, 552
- Béthermin et al. (2015) Béthermin, M., Daddi, E., Magdis, G., et al. 2015, A&A, 573, A113. https://doi.org/10.1051/0004-6361/201425031
- Béthermin et al. (2017) Béthermin, M., Wu, H.-Y., Lagache, G., et al. 2017, A&A, 607, A89. https://doi.org/10.1051/0004-6361/201730866
- Béthermin et al. (2020) Béthermin, M., Fudamoto, Y., Ginolfi, M., et al. 2020, A&A, 643, A2. https://doi.org/10.1051/0004-6361/202037649
- Bianchi & Schneider (2007) Bianchi, S., & Schneider, R. 2007, Monthly Notices of the Royal Astronomical Society, 378, 973. https://doi.org/10.1111/j.1365-2966.2007.11829.x
- Bouwens et al. (2020) Bouwens, R., González-López, J., Aravena, M., et al. 2020, ApJ, 902, 112
- Bouwens et al. (2017) Bouwens, R. J., Oesch, P. A., Illingworth, G. D., Ellis, R. S., & Stefanon, M. 2017, The Astrophysical Journal, 843, 129. https://doi.org/10.3847%2F1538-4357%2Faa70a4
- Bouwens et al. (2011) Bouwens, R. J., Illingworth, G. D., Oesch, P. A., et al. 2011, The Astrophysical Journal, 737, 90. https://doi.org/10.1088%2F0004-637x%2F737%2F2%2F90
- Bouwens et al. (2014) Bouwens, R. J., Bradley, L., Zitrin, A., et al. 2014, The Astrophysical Journal, 795, 126. https://doi.org/10.1088%2F0004-637x%2F795%2F2%2F126
- Bouwens et al. (2015) Bouwens, R. J., Illingworth, G. D., Oesch, P. A., et al. 2015, The Astrophysical Journal, 803, 34. https://doi.org/10.1088%2F0004-637x%2F803%2F1%2F34
- Bouwens et al. (2016a) Bouwens, R. J., Oesch, P. A., Labbé, I., et al. 2016a, The Astrophysical Journal, 830, 67. https://doi.org/10.3847%2F0004-637x%2F830%2F2%2F67
- Bouwens et al. (2016b) Bouwens, R. J., Aravena, M., Decarli, R., et al. 2016b, The Astrophysical Journal, 833, 72. https://doi.org/10.3847%2F1538-4357%2F833%2F1%2F72
- Bowler et al. (2018) Bowler, R. A. A., Bourne, N., Dunlop, J. S., McLure, R. J., & McLeod, D. J. 2018, Monthly Notices of the Royal Astronomical Society, 481, 1631. https://doi.org/10.1093/mnras/sty2368
- Bowler et al. (2017) Bowler, R. A. A., Dunlop, J. S., McLure, R. J., & McLeod, D. J. 2017, Monthly Notices of the Royal Astronomical Society, 466, 3612. https://doi.org/10.1093/mnras/stw3296
- Bradač et al. (2017) Bradač, M., Garcia-Appadoo, D., Huang, K.-H., et al. 2017, The Astrophysical Journal, 836, L2. https://doi.org/10.3847%2F2041-8213%2F836%2F1%2Fl2
- Calzetti et al. (2000) Calzetti, D., Armus, L., Bohlin, R. C., et al. 2000, The Astrophysical Journal, 533, 682. https://doi.org/10.1086%2F308692
- Capak et al. (2007) Capak, P., Aussel, H., Ajiki, M., et al. 2007, The Astrophysical Journal Supplement Series, 172, 99. https://doi.org/10.1086%2F519081
- Capak et al. (2013) Capak, P., Aussel, H., Bundy, K., et al. 2013, SPLASH: Spitzer Large Area Survey with Hyper-Suprime-Cam, Spitzer Proposal, ,
- Capak et al. (2015) Capak, P. L., Carilli, C., Jones, G., et al. 2015, Nature, 522, 455. https://doi.org/10.1038/nature14500
- Caputi et al. (2017) Caputi, K. I., Deshmukh, S., Ashby, M. L. N., et al. 2017, The Astrophysical Journal, 849, 45. https://doi.org/10.3847%2F1538-4357%2Faa901e
- Carniani et al. (2018) Carniani, S., Maiolino, R., Smit, R., & Amorín, R. 2018, The Astrophysical Journal, 854, L7. https://doi.org/10.3847%2F2041-8213%2Faaab45
- Carniani et al. (2017) Carniani, S., Maiolino, R., Pallottini, A., et al. 2017, A&A, 605, A42. https://doi.org/10.1051/0004-6361/201630366
- Casey (2012) Casey, C. M. 2012, Monthly Notices of the Royal Astronomical Society, 425, 3094. https://doi.org/10.1111/j.1365-2966.2012.21455.x
- Casey et al. (2014) Casey, C. M., Scoville, N. Z., Sanders, D. B., et al. 2014, The Astrophysical Journal, 796, 95. https://doi.org/10.1088%2F0004-637x%2F796%2F2%2F95
- Casey et al. (2018) Casey, C. M., Zavala, J. A., Spilker, J., et al. 2018, The Astrophysical Journal, 862, 77. https://doi.org/10.3847%2F1538-4357%2Faac82d
- Cazaux & Tielens (2004) Cazaux, S., & Tielens, A. G. G. M. 2004, The Astrophysical Journal, 604, 222. https://doi.org/10.1086%2F381775
- Chabrier (2003) Chabrier, G. 2003, Publications of the Astronomical Society of the Pacific, 115, 763. https://doi.org/10.1086%2F376392
- Chen et al. (2017) Chen, L.-H., Hirashita, H., Hou, K.-C., et al. 2017, Monthly Notices of the Royal Astronomical Society, 474, 1545. https://doi.org/10.1093/mnras/stx2863
- Cherchneff & Dwek (2010) Cherchneff, I., & Dwek, E. 2010, The Astrophysical Journal, 713, 1–24. https://doi.org/10.1088/0004-637x/713/1/1
- Coppin et al. (2014) Coppin, K. E. K., Geach, J. E., Almaini, O., et al. 2014, Monthly Notices of the Royal Astronomical Society, 446, 1293. https://doi.org/10.1093/mnras/stu2185
- Cucciati et al. (2012) Cucciati, O., Tresse, L., Ilbert, O., et al. 2012, A&A, 539, A31. https://doi.org/10.1051/0004-6361/201118010
- da Cunha et al. (2013) da Cunha, E., Groves, B., Walter, F., et al. 2013, The Astrophysical Journal, 766, 13. https://doi.org/10.1088%2F0004-637x%2F766%2F1%2F13
- Daddi et al. (2007) Daddi, E., Dickinson, M., Morrison, G., et al. 2007, The Astrophysical Journal, 670, 156. https://doi.org/10.1086%2F521818
- Daddi et al. (2009) Daddi, E., Dannerbauer, H., Stern, D., et al. 2009, The Astrophysical Journal, 694, 1517. https://doi.org/10.1088%2F0004-637x%2F694%2F2%2F1517
- Dunlop et al. (2016) Dunlop, J. S., McLure, R. J., Biggs, A. D., et al. 2016, Monthly Notices of the Royal Astronomical Society, 466, 861. https://doi.org/10.1093/mnras/stw3088
- Ellis et al. (2012) Ellis, R. S., McLure, R. J., Dunlop, J. S., et al. 2012, The Astrophysical Journal, 763, L7. https://doi.org/10.1088%2F2041-8205%2F763%2F1%2Fl7
- Endsley et al. (2021) Endsley, R., Stark, D. P., Chevallard, J., & Charlot, S. 2021, MNRAS, 500, 5229
- Erben et al. (2009) Erben, T., Hildebrandt, H., Lerchster, M., et al. 2009, A&A, 493, 1197. https://doi.org/10.1051/0004-6361:200810426
- Faisst et al. (2020) Faisst, A. L., Fudamoto, Y., Oesch, P. A., et al. 2020, Monthly Notices of the Royal Astronomical Society, https://academic.oup.com/mnras/advance-article-pdf/doi/10.1093/mnras/staa2545/33674766/staa2545.pdf, staa2545. https://doi.org/10.1093/mnras/staa2545
- Faisst et al. (2017) Faisst, A. L., Capak, P. L., Yan, L., et al. 2017, The Astrophysical Journal, 847, 21. https://doi.org/10.3847%2F1538-4357%2Faa886c
- Ferrarotti & Gail (2006) Ferrarotti, A. S., & Gail, H. P. 2006, A&A, 447, 553. https://doi.org/10.1051/0004-6361:20041198
- Finkelstein et al. (2015) Finkelstein, S. L., Ryan, R. E., Papovich, C., et al. 2015, The Astrophysical Journal, 810, 71. https://doi.org/10.1088%2F0004-637x%2F810%2F1%2F71
- Fudamoto et al. (2017) Fudamoto, Y., Oesch, P. A., Schinnerer, E., et al. 2017, Monthly Notices of the Royal Astronomical Society, 472, 483. https://doi.org/10.1093/mnras/stx1948
- Fudamoto et al. (2019a) Fudamoto, Y., Oesch, P. A., Magnelli, B., et al. 2019a, Monthly Notices of the Royal Astronomical Society, 491, 4724. https://doi.org/10.1093/mnras/stz3248
- Fudamoto et al. (2019b) —. 2019b, Monthly Notices of the Royal Astronomical Society, 491, 4724. https://doi.org/10.1093/mnras/stz3248
- Fudamoto et al. (2020) Fudamoto, Y., Oesch, P. A., Faisst, A., et al. 2020, A&A, 643, A4
- Gaia Collaboration et al. (2018) Gaia Collaboration, Brown, A. G. A., Vallenari, A., et al. 2018, A&A, 616, A1. https://doi.org/10.1051/0004-6361/201833051
- Gall et al. (2011) Gall, C., Hjorth, J., & Andersen, A. C. 2011, A&A Rev., 19, 43. https://doi.org/10.1007/s00159-011-0043-7
- Gould & Salpeter (1963) Gould, R. J., & Salpeter, E. E. 1963, ApJ, 138, 393
- Grogin et al. (2011) Grogin, N. A., Kocevski, D. D., Faber, S. M., et al. 2011, The Astrophysical Journal Supplement Series, 197, 35. https://doi.org/10.1088/0067-0049/197/2/35
- Gruppioni et al. (2020) Gruppioni, C., Béthermin, M., Loiacono, F., et al. 2020, A&A, 643, A8. https://doi.org/10.1051/0004-6361/202038487
- Harikane et al. (2020) Harikane, Y., Ouchi, M., Inoue, A. K., et al. 2020, ApJ, 896, 93
- Hashimoto et al. (2018) Hashimoto, T., Laporte, N., Mawatari, K., et al. 2018, Nature, 557, 392. https://doi.org/10.1038/s41586-018-0117-z
- Hashimoto et al. (2019) Hashimoto, T., Inoue, A. K., Mawatari, K., et al. 2019, Publications of the Astronomical Society of Japan, 71, https://academic.oup.com/pasj/article-pdf/71/4/71/29163312/psz049.pdf, 71. https://doi.org/10.1093/pasj/psz049
- Hildebrandt et al. (2009) Hildebrandt, H., Pielorz, J., Erben, T., et al. 2009, A&A, 498, 725. https://doi.org/10.1051/0004-6361/200811042
- Hirashita & Ferrara (2002) Hirashita, H., & Ferrara, A. 2002, Monthly Notices of the Royal Astronomical Society, 337, 921. https://doi.org/10.1046/j.1365-8711.2002.05968.x
- Hirashita et al. (2014) Hirashita, H., Ferrara, A., Dayal, P., & Ouchi, M. 2014, Monthly Notices of the Royal Astronomical Society, 443, 1704. https://doi.org/10.1093/mnras/stu1290
- Hodge & da Cunha (2020) Hodge, J. A., & da Cunha, E. 2020, Royal Society Open Science, 7, 200556
- Inoue et al. (2016) Inoue, A. K., Tamura, Y., Matsuo, H., et al. 2016, Science, 352, 1559. https://science.sciencemag.org/content/early/2016/06/15/science.aaf0714
- Karim et al. (2011) Karim, A., Schinnerer, E., Martínez-Sansigre, A., et al. 2011, The Astrophysical Journal, 730, 61. https://doi.org/10.1088%2F0004-637x%2F730%2F2%2F61
- Kawamata et al. (2018) Kawamata, R., Ishigaki, M., Shimasaku, K., et al. 2018, The Astrophysical Journal, 855, 4. https://doi.org/10.3847%2F1538-4357%2Faaa6cf
- Knudsen et al. (2017) Knudsen, K. K., Watson, D., Frayer, D., et al. 2017, Monthly Notices of the Royal Astronomical Society, 466, 138. https://doi.org/10.1093/mnras/stw3066
- Koprowski et al. (2017) Koprowski, M. P., Dunlop, J. S., Michałowski, M. J., et al. 2017, Monthly Notices of the Royal Astronomical Society, 471, 4155. https://doi.org/10.1093/mnras/stx1843
- Lakićević et al. (2015) Lakićević, M., van Loon, J. T., Meixner, M., et al. 2015, The Astrophysical Journal, 799, 50. https://doi.org/10.1088/0004-637x/799/1/50
- Laporte et al. (2012) Laporte, Pelló, R., Hayes, M., et al. 2012, A&A, 542, L31. https://doi.org/10.1051/0004-6361/201219486
- Laporte et al. (2017) Laporte, N., Ellis, R. S., Boone, F., et al. 2017, The Astrophysical Journal, 837, L21. https://doi.org/10.3847%2F2041-8213%2Faa62aa
- Laporte et al. (2019) Laporte, N., Katz, H., Ellis, R. S., et al. 2019, MNRAS, 487, L81
- Le Fèvre et al. (2020) Le Fèvre, O., Béthermin, M., Faisst, A., et al. 2020, A&A, 643, A1
- Leśniewska & Michałowski (2019) Leśniewska, A., & Michałowski, M. J. 2019, A&A, 624, L13. https://doi.org/10.1051/0004-6361/201935149
- Liang et al. (2019) Liang, L., Feldmann, R., Kereš, D., et al. 2019, MNRAS, 489, 1397
- Madau & Dickinson (2014) Madau, P., & Dickinson, M. 2014, ARA&A, 52, 415. https://ui.adsabs.harvard.edu/abs/2014ARA&A..52..415M
- Magnelli et al. (2009) Magnelli, Elbaz, D., Chary, R. R., et al. 2009, A&A, 496, 57. https://doi.org/10.1051/0004-6361:200811443
- Magnelli et al. (2013) Magnelli, Popesso, P., Berta, S., et al. 2013, A&A, 553, A132. https://doi.org/10.1051/0004-6361/201321371
- Magnelli et al. (2020) Magnelli, Boogaard, L., Decarli, R., et al. 2020, The Astrophysical Journal, 892, 66. https://doi.org/10.3847%2F1538-4357%2Fab7897
- Maiolino et al. (2015) Maiolino, R., Carniani, S., Fontana, A., et al. 2015, Monthly Notices of the Royal Astronomical Society, 452, 54. https://doi.org/10.1093/mnras/stv1194
- Marrone et al. (2018) Marrone, D. P., Spilker, J. S., Hayward, C. C., et al. 2018, Nature, 553, 51. https://doi.org/10.1038/nature24629
- Martí-Vidal et al. (2014) Martí-Vidal, I., Vlemmings, W. H. T., Muller, S., & Casey, S. 2014, A&A, 563, A136. https://doi.org/10.1051/0004-6361/201322633
- Matthee et al. (2017) Matthee, J., Sobral, D., Boone, F., et al. 2017, The Astrophysical Journal, 851, 145. https://doi.org/10.3847%2F1538-4357%2Faa9931
- Matthee et al. (2019) Matthee, J., Sobral, D., Boogaard, L. A., et al. 2019, The Astrophysical Journal, 881, 124. https://doi.org/10.3847%2F1538-4357%2Fab2f81
- Mazzucchelli et al. (2017) Mazzucchelli, C., Bañados, E., Venemans, B. P., et al. 2017, The Astrophysical Journal, 849, 91. https://doi.org/10.3847%2F1538-4357%2Faa9185
- McCracken et al. (2012) McCracken, H. J., Milvang-Jensen, B., Dunlop, J., et al. 2012, A&A, 544, A156. https://doi.org/10.1051/0004-6361/201219507
- McLeod et al. (2016) McLeod, D. J., McLure, R. J., & Dunlop, J. S. 2016, Monthly Notices of the Royal Astronomical Society, 459, 3812. https://doi.org/10.1093/mnras/stw904
- McLure et al. (2013) McLure, R. J., Dunlop, J. S., Bowler, R. A. A., et al. 2013, Monthly Notices of the Royal Astronomical Society, 432, 2696. https://doi.org/10.1093/mnras/stt627
- McLure et al. (2018) McLure, R. J., Dunlop, J. S., Cullen, F., et al. 2018, Monthly Notices of the Royal Astronomical Society, 476, 3991. https://doi.org/10.1093/mnras/sty522
- Meurer et al. (1999) Meurer, G. R., Heckman, T. M., & Calzetti, D. 1999, The Astrophysical Journal, 521, 64. https://doi.org/10.1086%2F307523
- Michałowski et al. (2010) Michałowski, M., Hjorth, J., & Watson, D. 2010, A&A, 514, A67. https://doi.org/10.1051/0004-6361/200913634
- Michałowski (2015) Michałowski, M. J. 2015, A&A, 577, A80. https://doi.org/10.1051/0004-6361/201525644
- Momcheva et al. (2016) Momcheva, I. G., van Dokkum, P. G., van der Wel, A., et al. 2016, Publications of the Astronomical Society of the Pacific, 129, 015004. https://doi.org/10.1088%2F1538-3873%2F129%2F971%2F015004
- Morgan & Edmunds (2003) Morgan, H. L., & Edmunds, M. G. 2003, Monthly Notices of the Royal Astronomical Society, 343, 427. https://doi.org/10.1046/j.1365-8711.2003.06681.x
- Nanni et al. (2014) Nanni, A., Bressan, A., Marigo, P., & Girardi, L. 2014, Monthly Notices of the Royal Astronomical Society, 438, 2328. https://doi.org/10.1093/mnras/stt2348
- Nozawa et al. (2003) Nozawa, T., Kozasa, T., Umeda, H., Maeda, K., & Nomoto, K. 2003, The Astrophysical Journal, 598, 785–803. https://doi.org/10.1086/379011
- Oesch et al. (2015) Oesch, P. A., Bouwens, R. J., Illingworth, G. D., et al. 2015, The Astrophysical Journal, 808, 104. https://doi.org/10.1088%2F0004-637x%2F808%2F1%2F104
- Oesch et al. (2018) Oesch, P. A., Bouwens, R. J., Illingworth, G. D., Labbé, I., & Stefanon, M. 2018, The Astrophysical Journal, 855, 105. https://doi.org/10.3847%2F1538-4357%2Faab03f
- Oesch et al. (2014) Oesch, P. A., Bouwens, R. J., Illingworth, G. D., et al. 2014, The Astrophysical Journal, 786, 108. https://doi.org/10.1088%2F0004-637x%2F786%2F2%2F108
- Oke & Gunn (1983) Oke, J. B., & Gunn, J. E. 1983, ApJ, 266, 713. https://ui.adsabs.harvard.edu/abs/1983ApJ...266..713O
- Omukai (2000) Omukai, K. 2000, The Astrophysical Journal, 534, 809. https://doi.org/10.1086%2F308776
- Omukai et al. (2005) Omukai, K., Tsuribe, T., Schneider, R., & Ferrara, A. 2005, The Astrophysical Journal, 626, 627. https://doi.org/10.1086%2F429955
- Ota et al. (2014) Ota, K., Walter, F., Ohta, K., et al. 2014, The Astrophysical Journal, 792, 34. https://doi.org/10.1088%2F0004-637x%2F792%2F1%2F34
- Oteo et al. (2016) Oteo, I., Ivison, R. J., Dunne, L., et al. 2016, The Astrophysical Journal, 827, 34. https://doi.org/10.3847%2F0004-637x%2F827%2F1%2F34
- Overzier et al. (2010) Overzier, R. A., Heckman, T. M., Wang, J., et al. 2010, The Astrophysical Journal, 726, L7. https://doi.org/10.1088%2F2041-8205%2F726%2F1%2Fl7
- Pannella et al. (2015) Pannella, M., Elbaz, D., Daddi, E., et al. 2015, The Astrophysical Journal, 807, 141. https://doi.org/10.1088%2F0004-637x%2F807%2F2%2F141
- Pentericci et al. (2016) Pentericci, L., Carniani, S., Castellano, M., et al. 2016, The Astrophysical Journal, 829, L11. https://doi.org/10.3847%2F2041-8205%2F829%2F1%2Fl11
- Reddy et al. (2011) Reddy, N., Dickinson, M., Elbaz, D., et al. 2011, The Astrophysical Journal, 744, 154. https://doi.org/10.1088%2F0004-637x%2F744%2F2%2F154
- Reddy et al. (2010) Reddy, N. A., Erb, D. K., Pettini, M., Steidel, C. C., & Shapley, A. E. 2010, The Astrophysical Journal, 712, 1070. https://doi.org/10.1088%2F0004-637x%2F712%2F2%2F1070
- Reddy et al. (2006) Reddy, N. A., Steidel, C. C., Fadda, D., et al. 2006, The Astrophysical Journal, 644, 792. https://doi.org/10.1086%2F503739
- Reddy et al. (2018) Reddy, N. A., Oesch, P. A., Bouwens, R. J., et al. 2018, The Astrophysical Journal, 853, 56. https://doi.org/10.3847/1538-4357/aaa3e7
- Rémy-Ruyer et al. (2015) Rémy-Ruyer, A., Madden, S. C., Galliano, F., et al. 2015, A&A, 582, A121. https://ui.adsabs.harvard.edu/abs/2015A&A...582A.121R
- Riechers et al. (2013) Riechers, D. A., Bradford, C. M., Clements, D. L., et al. 2013, Nature, 496, 329. https://doi.org/10.1038/nature12050
- Roberts-Borsani et al. (2016) Roberts-Borsani, G. W., Bouwens, R. J., Oesch, P. A., et al. 2016, The Astrophysical Journal, 823, 143. https://doi.org/10.3847%2F0004-637x%2F823%2F2%2F143
- Rossi et al. (2018) Rossi, M. E. D., Rieke, G. H., Shivaei, I., Bromm, V., & Lyu, J. 2018, The Astrophysical Journal, 869, 4. https://doi.org/10.3847%2F1538-4357%2Faaebf8
- Salim & Narayanan (2020) Salim, S., & Narayanan, D. 2020, ARA&A, 58, 529
- Schenker et al. (2013) Schenker, M. A., Robertson, B. E., Ellis, R. S., et al. 2013, The Astrophysical Journal, 768, 196. https://doi.org/10.1088%2F0004-637x%2F768%2F2%2F196
- Schneider et al. (2006) Schneider, R., Omukai, K., Inoue, A. K., & Ferrara, A. 2006, Monthly Notices of the Royal Astronomical Society, 369, 1437. https://doi.org/10.1111/j.1365-2966.2006.10391.x
- Schneider et al. (2014) Schneider, R., Valiante, R., Ventura, P., et al. 2014, Monthly Notices of the Royal Astronomical Society, 442, 1440. https://doi.org/10.1093/mnras/stu861
- Schreiber et al. (2018) Schreiber, C., Elbaz, D., Pannella, M., et al. 2018, A&A, 609, A30. https://doi.org/10.1051/0004-6361/201731506
- Schreiber et al. (2015) Schreiber, C., Pannella, M., Elbaz, D., et al. 2015, A&A, 575, A74. https://doi.org/10.1051/0004-6361/201425017
- Scoville et al. (2007) Scoville, N., Aussel, H., Brusa, M., et al. 2007, The Astrophysical Journal Supplement Series, 172, 1. https://doi.org/10.1086%2F516585
- Siana et al. (2008) Siana, B., Teplitz, H. I., Chary, R.-R., Colbert, J., & Frayer, D. T. 2008, ApJ, 689, 59
- Sklias et al. (2014) Sklias, P., Zamojski, M., Schaerer, D., et al. 2014, A&A, 561, A149. https://doi.org/10.1051/0004-6361/201322424
- Smail et al. (2014) Smail, I., Geach, J. E., Swinbank, A. M., et al. 2014, The Astrophysical Journal, 782, 19. https://doi.org/10.1088%2F0004-637x%2F782%2F1%2F19
- Smit et al. (2015) Smit, R., Bouwens, R. J., Franx, M., et al. 2015, The Astrophysical Journal, 801, 122. https://doi.org/10.1088%2F0004-637x%2F801%2F2%2F122
- Smit et al. (2018) Smit, R., Bouwens, R. J., Carniani, S., et al. 2018, Nature, 553, 178. https://doi.org/10.1038/nature24631
- Sommovigo et al. (2021) Sommovigo, L., Ferrara, A., Carniani, S., et al. 2021, MNRAS, 503, 4878
- Stefanon et al. (2017) Stefanon, M., Labbé, I., Bouwens, R. J., et al. 2017, ApJ, 851, 43
- Stefanon et al. (2019) —. 2019, ApJ, 883, 99
- Strandet et al. (2016) Strandet, M. L., Weiss, A., Vieira, J. D., et al. 2016, ApJ, 822, 80
- Takeuchi et al. (2010) Takeuchi, T. T., Buat, V., Heinis, S., et al. 2010, A&A, 514, A4. https://doi.org/10.1051/0004-6361/200913476
- Tamura et al. (2019) Tamura, Y., Mawatari, K., Hashimoto, T., et al. 2019, The Astrophysical Journal, 874, 27. https://doi.org/10.3847%2F1538-4357%2Fab0374
- Todini & Ferrara (2001) Todini, P., & Ferrara, A. 2001, Monthly Notices of the Royal Astronomical Society, 325, 726. https://doi.org/10.1046/j.1365-8711.2001.04486.x
- Venemans et al. (2015a) Venemans, B. P., Walter, F., Zschaechner, L., et al. 2015a, The Astrophysical Journal, 816, 37. https://doi.org/10.3847%2F0004-637x%2F816%2F1%2F37
- Venemans et al. (2012) Venemans, B. P., McMahon, R. G., Walter, F., et al. 2012, The Astrophysical Journal, 751, L25. https://doi.org/10.1088%2F2041-8205%2F751%2F2%2Fl25
- Venemans et al. (2015b) Venemans, B. P., Bañados, E., Decarli, R., et al. 2015b, The Astrophysical Journal, 801, L11. https://doi.org/10.1088%2F2041-8205%2F801%2F1%2Fl11
- Venemans et al. (2017) Venemans, B. P., Walter, F., Decarli, R., et al. 2017, The Astrophysical Journal, 851, L8. https://doi.org/10.3847%2F2041-8213%2Faa943a
- Venemans et al. (2018) Venemans, B. P., Decarli, R., Walter, F., et al. 2018, The Astrophysical Journal, 866, 159. https://doi.org/10.3847%2F1538-4357%2Faadf35
- Ventura et al. (2012) Ventura, P., Criscienzo, M. D., Schneider, R., et al. 2012, Monthly Notices of the Royal Astronomical Society, 424, 2345. https://doi.org/10.1111/j.1365-2966.2012.21403.x
- Wang et al. (2019) Wang, T., Schreiber, C., Elbaz, D., et al. 2019, Nature, 572, 211. https://doi.org/10.1038/s41586-019-1452-4
- Watson et al. (2015) Watson, D., Christensen, L., Knudsen, K. K., et al. 2015, Nature, 519, 327. https://doi.org/10.1038/nature14164
- Whitaker et al. (2017) Whitaker, K. E., Pope, A., Cybulski, R., et al. 2017, The Astrophysical Journal, 850, 208. https://doi.org/10.3847%2F1538-4357%2Faa94ce
- Williams et al. (2019) Williams, C. C., Labbe, I., Spilker, J., et al. 2019, The Astrophysical Journal, 884, 154. https://doi.org/10.3847%2F1538-4357%2Fab44aa
- Willott et al. (2015) Willott, C. J., Carilli, C. L., Wagg, J., & Wang, R. 2015, The Astrophysical Journal, 807, 180. https://doi.org/10.1088%2F0004-637x%2F807%2F2%2F180
- Yamasawa et al. (2011) Yamasawa, D., Habe, A., Kozasa, T., et al. 2011, The Astrophysical Journal, 735, 44. https://doi.org/10.1088%2F0004-637x%2F735%2F1%2F44
- Zavala et al. (2021) Zavala, J. A., Casey, C. M., Manning, S. M., et al. 2021, The Astrophysical Journal, 909, 165. https://doi.org/10.3847/1538-4357/abdb27