High-redshift quasars at – I. Radio spectra
Abstract
We present the radio properties of optically selected quasars with . The complete sample consists of 102 quasars with a flux density level mJy in a declination range . The observations were obtained in 2017–2020 using the radio telescope RATAN-600. We measured flux densities at six frequencies 1.2, 2.3, 4.7, 8.2, 11.2, and 22 GHz quasi-simultaneously with uncertainties of 9–31 per cent. The detection rate is 100, 89, and 46 per cent at 4.7, 11.2, and 22 GHz, respectively. We have analysed the averaged radio spectra of the quasars based on the RATAN and literature data. We classify 46 per cent of radio spectra as peaked-spectrum, 24 per cent as flat, and none as ultra-steep spectra (). The multifrequency data reveal that a peaked spectral shape (PS) is a common feature for bright high-redshift quasars. This indicates the dominance of bright compact core emission and the insignificant contribution of extended optically thin kpc-scale components in observed radio spectra. Using these new radio data, the radio loudness was estimated for 71 objects with a median value of 3.5, showing that the majority of the quasars are highly radio-loud with . We have not found any significant correlation between and . Several new megahertz-peaked spectrum (MPS) and gigahertz-peaked spectrum (GPS) candidates are suggested. Further studies of their variability and additional low-frequency observations are needed to classify them precisely.
keywords:
galaxies: active – galaxies: high-redshift – quasars: general – radio continuum: galaxies1 Introduction
High-redshift () quasars are important to study because they provide information about the growth of supermassive black holes and the evolution of active galactic nuclei (AGNs) in the early Universe. Most of high-redshift and radio-loud objects are expected to be blazars, a subclass of AGNs with a relativistic jet pointing toward the observer (Urry & Padovani, 1995). Relativistically beamed sources dominate the high-redshift radio source population due to the Doppler boosting effect. The number of radio-loud () quasars decreases with increasing redshift. For example, at only several radio-loud quasars are found, and radio emission is not detected at in optically detected quasars (Wang et al., 2007; Momjian et al., 2014).
An observed radio spectrum of a blazar is a combination of a flat spectrum by a compact core and a steep spectrum by a kiloparsec jet. The relationship between the core and the jet power determines the shape of the observed radio spectrum based on their contribution. Hence, the majority of radio sources at high redshifts should have a flat spectrum. However, we observe the well-known steep-spectrum (Momjian et al., 2008; Frey et al., 2008, 2010) and the gigahertz-peaked spectrum (GPS) population high-redshift radio-loud quasars (O’Dea, 1990; Frey et al., 2010).
Currently, only a few high-redshift blazars are found at , for example SDSS J114657.79+403708.6 (Frey et al., 2010; Ghisellini et al., 2014), SDSS J102623.61+254259.5 (Sbarrato et al., 2012; Frey et al., 2015), SDSS J164854+460328 (Caccianiga et al., 2019), Q0906+6930 (Romani et al., 2004), and PSO J047.4478+27.2992 (Belladitta et al., 2020). Their radio loudness is much less than that of quasars at redshifts .
The most distant known blazar at , PSO J047.4478+27.2992, was discovered by Belladitta et al. (2020) in 2020 and is considered a compact steep-spectrum or a megahertz-peaked spectrum (CSS/MPS) candidate based on the RATAN-600 and Very Large Array (VLA) measurements (Spingola et al., 2020; Mufakharov et al., 2021). It is a radio-loud blazar with a , which is higher by several orders of magnitude than for quasars at –5.
Several studies have compiled and studied statistically high-redshift blazars based on the optical (Sloan Digital Sky Survey (SDSS), e.g. Sbarrato et al. 2013) or radio (Cosmic Lens All Sky Survey (CLASS)) observations (e.g. Caccianiga et al. 2019). A systematic study of 30 high-redshift () quasars was presented by Coppejans et al. (2016b, 2017), where multifrequency radio spectra were used to classify the spectral type of the sources and no preferable spectral type for high-redshift objects was found. Blumenthal & Miley (1979), Tielens et al. (1979), Laing & Peacock (1980), and De Breuck et al. (2000) demonstrated that sources with higher redshifts had steeper radio spectra. In some studies an ultra-steep spectrum is used either as an indicator of high redshift (e.g. Jarvis et al. 2001; Singh et al. 2014) or as a reasonable tracer of intermediate-redshift () galaxies (Smolčić et al., 2014). There are only four radio-loud quasars known at to date, PSO J172.3556+18.7734 at is the most distant among them (Bañados et al., 2021). It has a steep radio spectrum () and radio loudness about .
Unfortunately, for most quasars at observed data are available at very few radio frequencies. In this study, new RATAN-600 observed data for 102 high-redshift quasars are presented. In 2017–2020 we obtained radio spectra measured quasi-simultaneously at 1.2, 2.3, 4.7, 8.2, 11.2, and 22 GHz and compiled a catalogue of six-frequency flux densities. Combining our new observations with those from the literature, we investigated the radio spectra of quasars at . We estimated the radio luminosity and radio loudness for these objects and made an analysis for different redshift ranges. Spectral classification was performed and new GPS/MPS candidates were found.
2 The sample
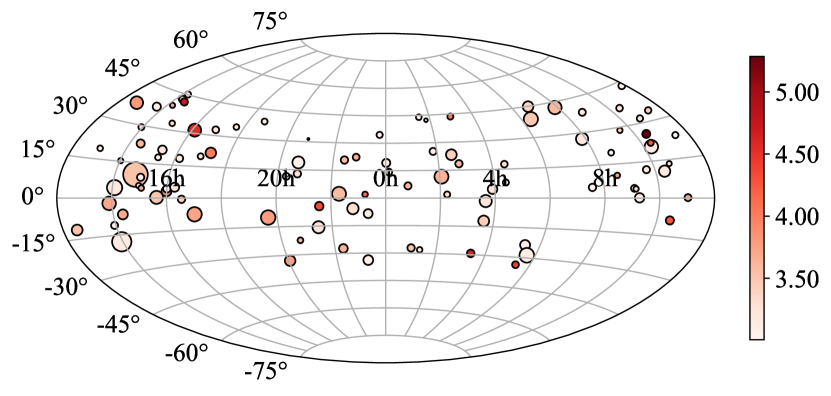
The complete sample consists of 102 quasars at with a flux density level mJy in the declination range (Fig. 1).
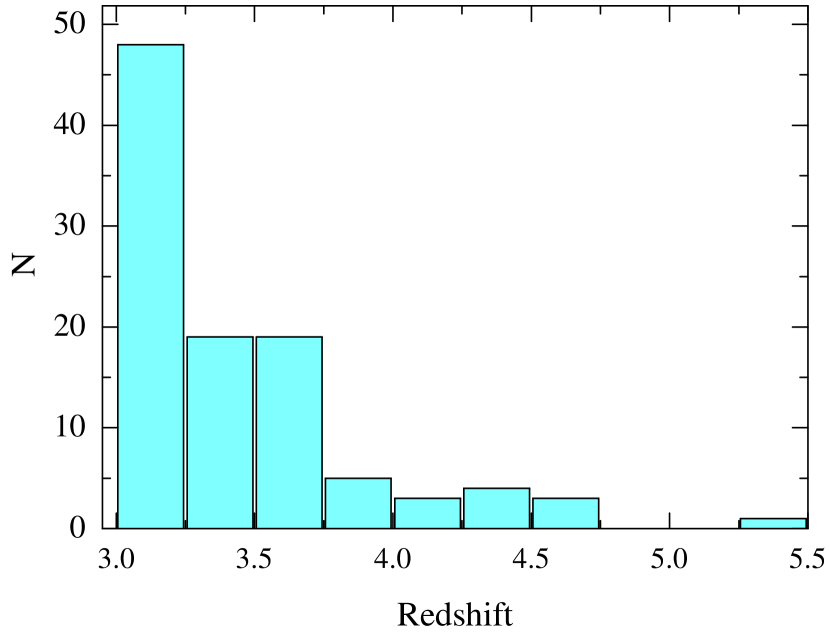
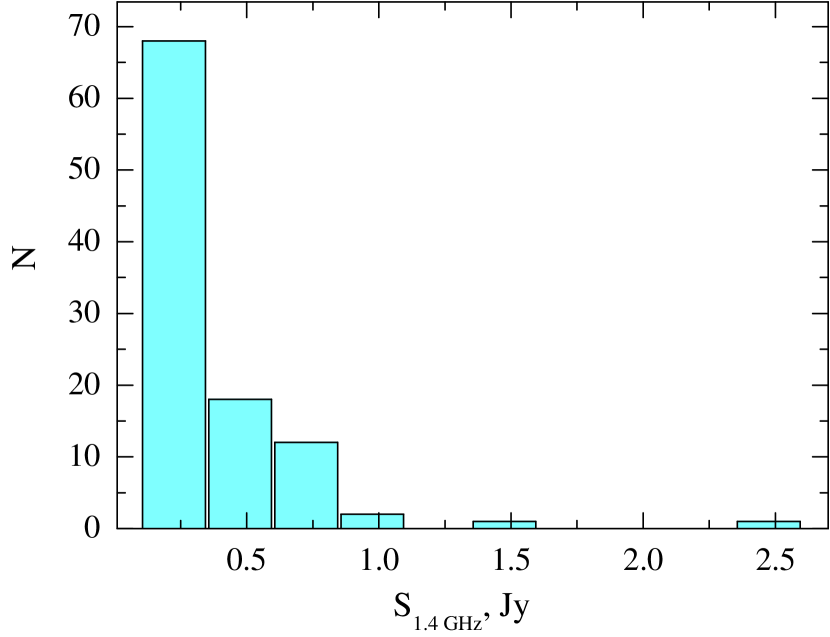
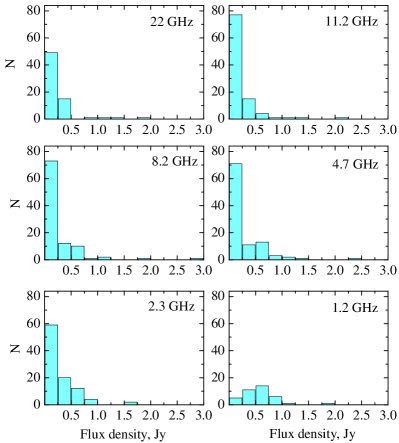
The spectroscopic redshifts were taken from the National Aeronautics and Space Administration (NASA)/Infrared Processing and Analysis Center (IPAC) Extragalactic Database (NED),111https://ned.ipac.caltech.edu and the redshift median value was found to be 3.26. There are 10 quasars at in the sample and only one, B2 1023+25, at (; Sbarrato et al. (2012)). The number of objects decreases exponentially with increasing redshift (Fig. 2). There are 22 bright radio quasars with flux densities 0.5–2.4 Jy in the sample, and the median value of the flux density at 1.4 GHz is 0.22 Jy (Fig. 3).
Table LABEL:tab:param presents the list of the sources with their characteristics, where Column 1 is the source name, Column 2 is the redshift , Column 3 is the average flux density at 4.7 GHz (RATAN-600 measurements), Column 4 is the radio luminosity at 4.7 GHz, Column 5 is the radio loudness , Columns 6 and 7 are the spectral indices, Column 8 is the radio spectrum type, and Column 9 is the blazar type.
The list includes 48 quasars that are classified as blazars according to the 5th Edition of the Roma-BZCAT catalogue (Massaro et al., 2015). Almost all blazars (46) are flat-spectrum radio quasars (FSRQs), and two of them are blazars of an uncertain type.
For high-energy bands, we found that only seven sources have their matches in the Fermi-LAT 4th catalog (Ballet et al., 2020), and 30 sources have X-ray photon fluxes available according to the NED database.
3 Observations and data reduction
We carried out the observations in transit mode with the RATAN-600 radio telescope (Parijskij, 1993; Sotnikova, 2020) at six frequencies between 1.2 and 22 GHz simultaneously. For a single transit observation, one can obtain an instantaneous spectrum of a source. RATAN-600 continuum radiometer parameters are presented in Sotnikova et al. (2019a).
The sample was observed in 2017–2020. We observed the sources 3–15 times for each observing epoch to improve the signal-to-noise (S/N) ratio. The median number of the observing epochs is for the sample.
The observations were processed using the Flexible Astronomical Data Processing System (FADPS) standard data reduction software developed by Verkhodanov (1997) for the broadband RATAN-600 continuum radiometers and the automated data reduction system (Tsybulev, 2011; Tsybulev et al., 2018; Udovitskiy et al., 2016). We used the following eight flux density secondary calibrators: 3C48, 3C138, 3C147, 3C161, 3C286, 3C295, 3C309.1, and NGC 7027. The flux-density scale is based on measurements by Baars et al. (1977) and Perley & Butler (2013, 2017); these are in good agreement, and their differences are within the measurement errors. Additionally we used traditional RATAN-600 flux density calibrators: J0240-23, J1154-35, and J0521+16 (Sotnikova et al., 2019b). The measurements of the calibrators were corrected for angular size and linear polarisation, according to the data from Ott et al. (1994) and Tabara & Inoue (1980).
4 Results
4.1 Flux densities
The total number of observations is more than 1400, and the detection rates are 46 per cent and 100 per cent at 22 and 4.7 GHz, respectively (Table 1). The number of sources with RATAN data available at five to six frequencies is 75. The median value of the S/N ratio varies from 9 to 17 at 4.7–22 GHz. At 1.2 and 2.3 GHz, the median S/N values are 25 and 31 due to strong radio frequency interference (RFI). The strong RFI contamination at 11.2 GHz is also the reason for the non-detection of objects in the declination range .
The flux density standard errors are 5–20 per cent for 11.2, 8.2, and 4.7 GHz, and 10–35 per cent for 2.3, 1.2, and 22 GHz. Table 1 presents the detection rate statistics, median flux densities, and their uncertainties for different frequencies. Fig. 4 presents the average flux density distribution at the six frequencies.
| Frequency | Nobs | Detections | ||
|---|---|---|---|---|
| (GHz) | (Jy) | (%) | (%) | |
| 22 | 0.56 (0.59) | 18 | 1418 | |
| 11.2 | 0.41 (0.55) | 11 | 1418 | |
| 8.2 | 0.32 (0.51) | 11 | 801 | |
| 4.7 | 0.44 (0.52) | 9 | 1418 | |
| 2.3 | 0.38 (0.37) | 31 | 801 | |
| 1.2 | 0.77 (0.50) | 25 | 801 |
| NVSS name | JD | ||||||
|---|---|---|---|---|---|---|---|
| 000108191434 | 2457793 | – | – | ||||
| 000108191434 | 2457838 | – | |||||
| 000108191434 | 2457853 | – | |||||
| 000108191434 | 2458027 | ||||||
| 000108191434 | 2458104 | – | |||||
| 000108191434 | 2458192 | – | – | ||||
| 000108191434 | 2458236 | – | – | ||||
| 000108191434 | 2458309 | – | |||||
| 000108191434 | 2458530 | – | – | ||||
| 000108191434 | 2458717 | ||||||
| 000108191434 | 2458771 | – | – |
Table 2 presents the flux densities, where Columns 1 and 2 are the source name and the averaged observing epoch (JD), Columns 3–14 are the flux densities and their uncertainties (Jy). The data is distributed in the VizieR Information System.222https://vizier.u-strasbg.fr/viz-bin/VizieR The RATAN-600 flux densities and the instantaneous spectra for some quasars are published in the BL Lac database333www.sao.ru/blcat/ maintained by the Special Astrophysical Observatory. The database is constantly updated with new data and is freely available (Mingaliev et al., 2014).
4.2 Radio spectra and classification
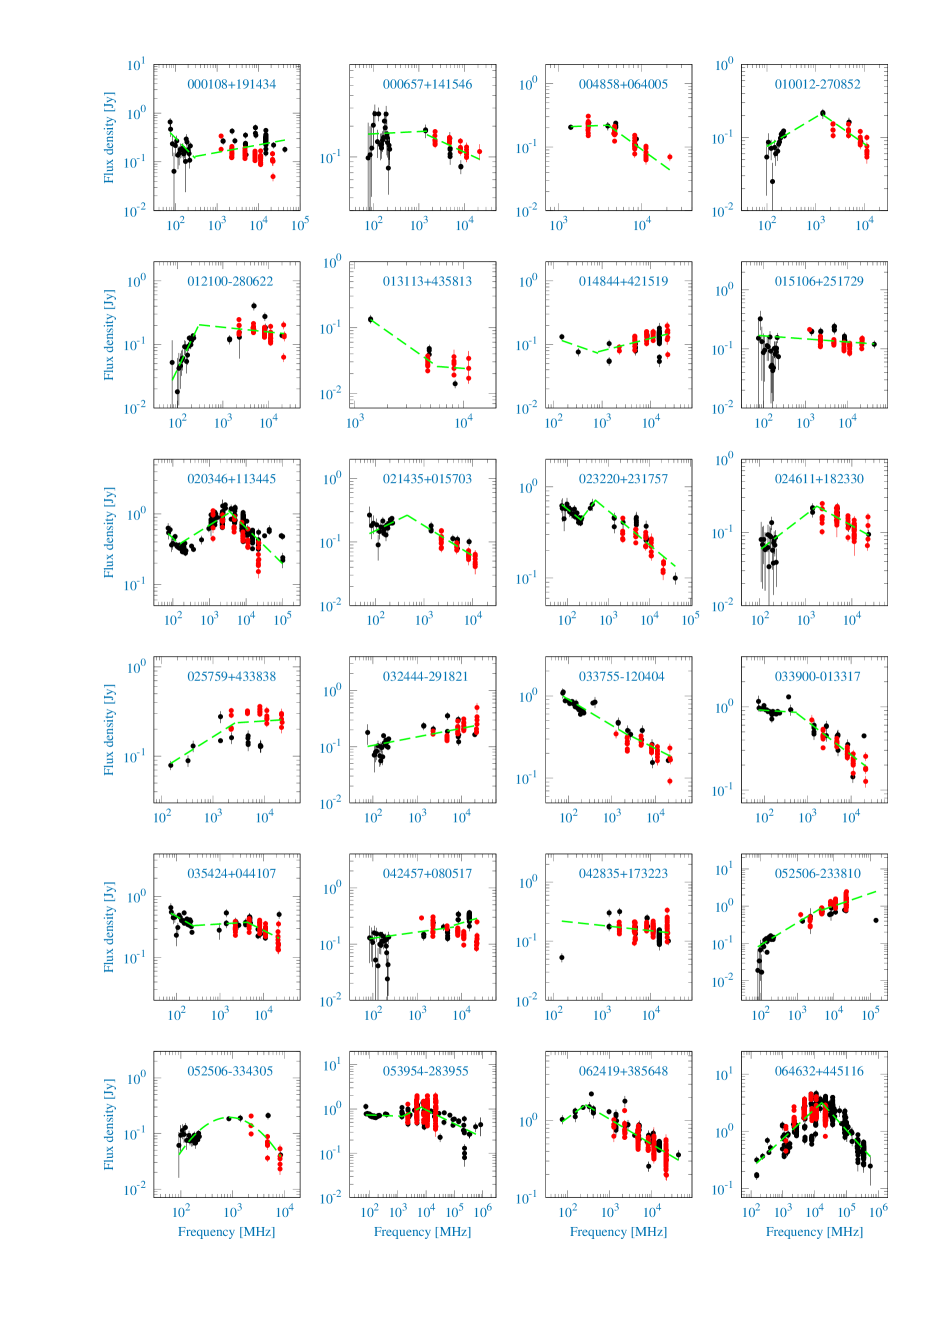
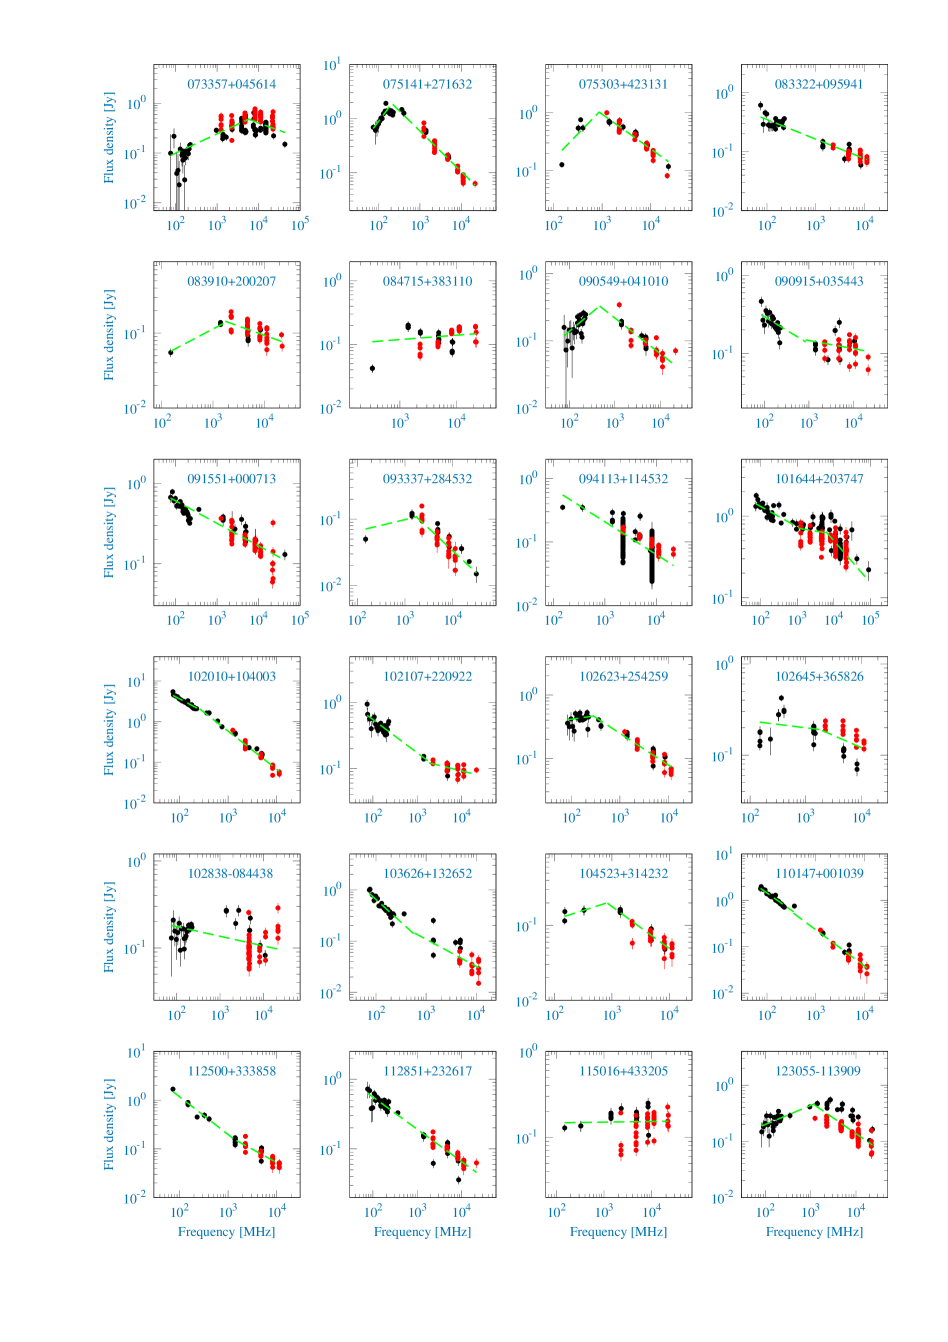
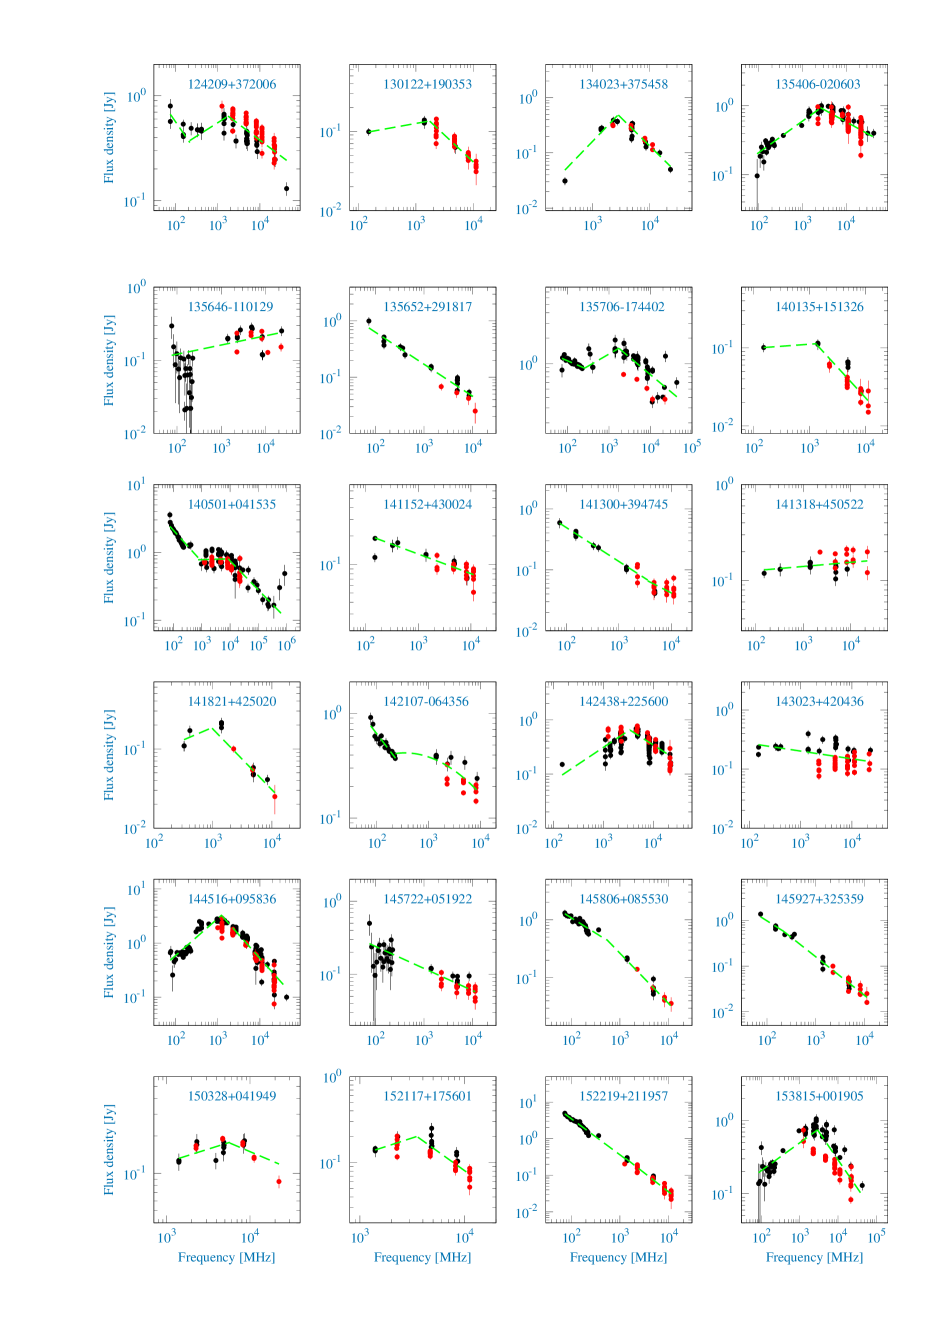
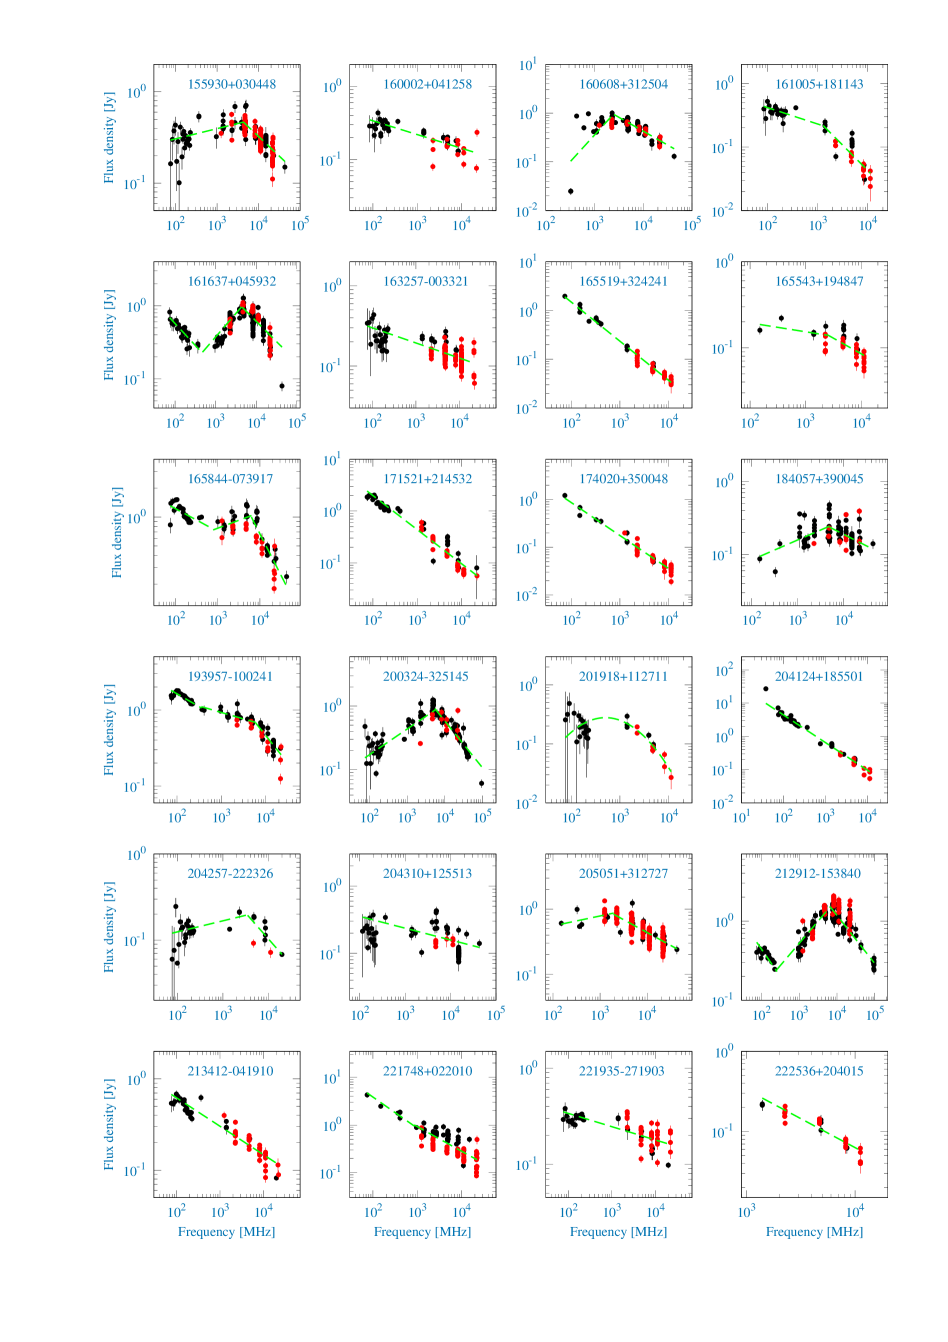
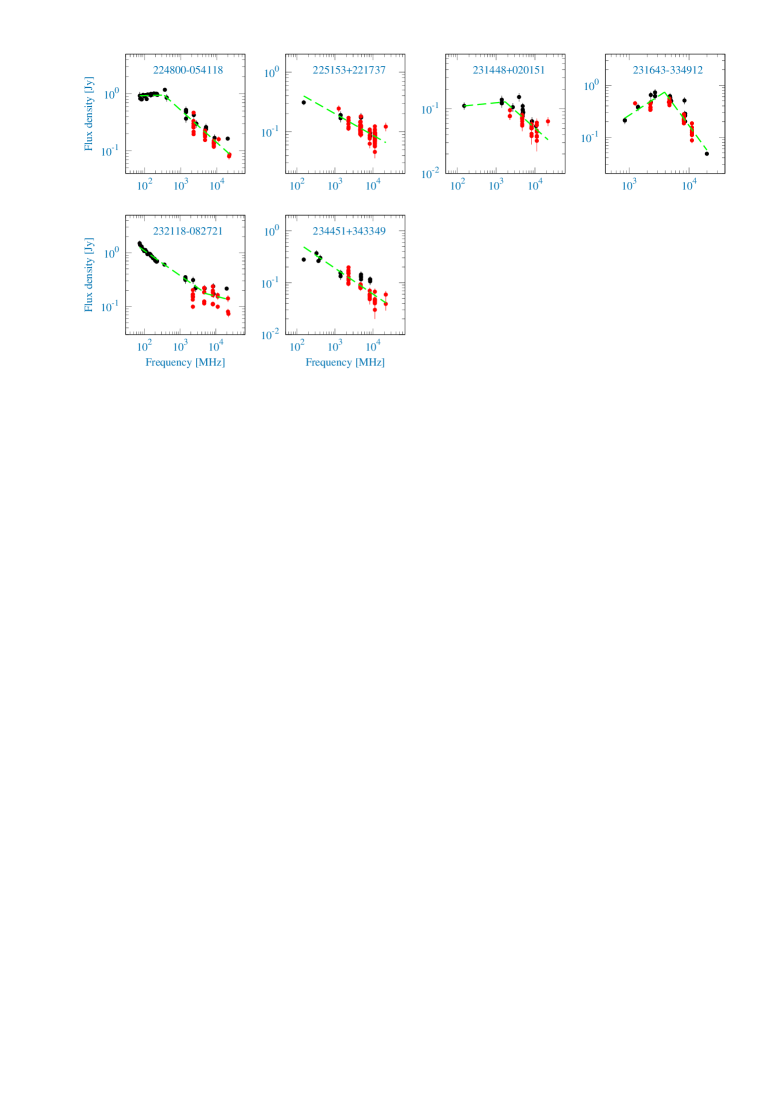
Figs. 13–17 show the broad-band radio spectra of the quasars. We compiled the spectra using both RATAN (red circles) and CATS (black circles) data (Verkhodanov et al., 2005, 1997). The RATAN-600 measurements cover the time period 2017–2020, except for several objects which were observed from 2014. The CATS data cover a time period of several dozens years, and the main data are represented by the National Radio Astronomy Observatory (NRAO) VLA Sky Survey (NVSS: Condon et al. (1998)), Faint Images of the Radio Sky at Twenty cm (FIRST: Becker et al. (1994)), Westerbork Northern Sky Survey (WENSS: Rengelink et al. (1997)), Green Bank 6-cm survey (GB6: Gregory et al. (1996)), Australia Telescope 20 GHz Survey (ATCA20: Murphy et al. (2010)), and VLA measurements. Low-frequency data are well presented by the GaLactic and Extragalactic All-sky Murchison Widefield Array (GLEAM) survey at 72–231 MHz (2013–2014; Hurley-Walker et al. (2017)) and the Giant Metrewave Radio Telescope Sky Survey (TGSS) at 150 MHz (2015, Intema et al. (2017)); the data were obtained almost simultaneously with the RATAN-600 observations.
We analysed the averaged radio spectra of quasars compiled from the RATAN and CATS data. The spectral parameters were estimated by fitting with polynomials, which were calculated by weight averaging of measurements in the FADPS software package (Verkhodanov et al., 1997). The resulting approximations are shown by the green dotted lines in Figs. 13–17. We defined the spectral index from the power-law ( is a flux density at the frequency , and is a spectral index).
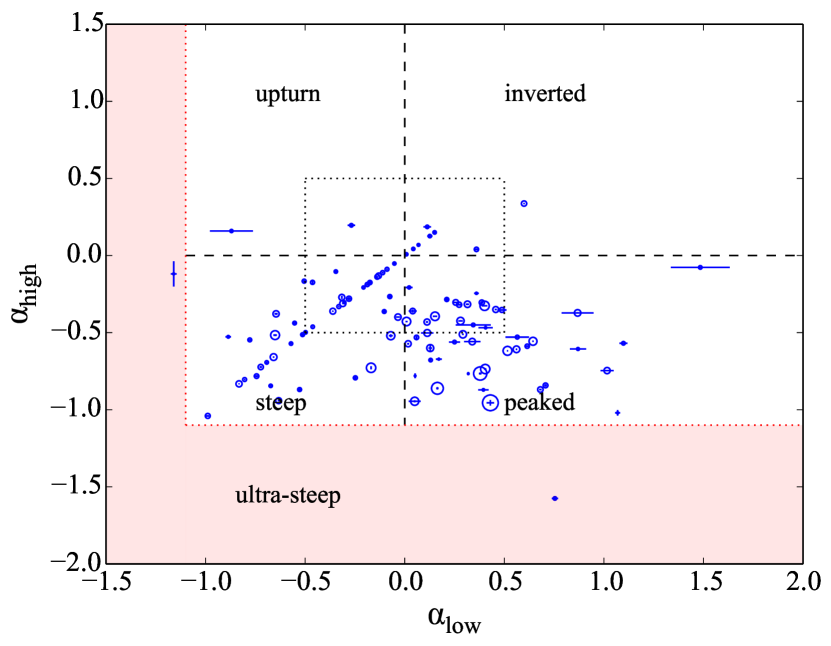
Table 3 presents the criteria based on which the spectral classification was made. We determined the spectral indices and for peaked and upturn spectra for the frequencies where the spectral slope changes its sign from positive to negative or vice versa. For the rest of the spectra, the low-frequency spectral index was calculated between the TGSS, GLEAM, WENSS, and other decimeter-wavelength measurements. The high-frequency spectral index was estimated between centimeter catalog data points. We considered a spectrum to be flat if the spectral index , and inverted if . The spectrum is assumed to be complex for indeterminate shapes with two or more maxima or minima. The spectrum is called steep or ultra-steep for and , respectively.
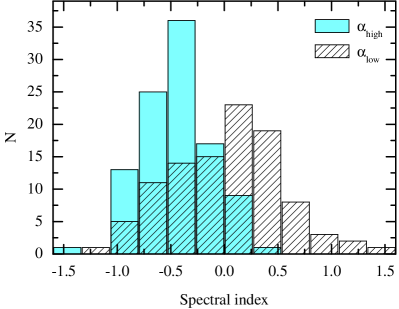
Fig. 5 presents the spectral-type distribution in the convinient form of a two-color diagram in which is plotted against . The point size is proportional to the radio luminosity at 4.7 GHz. The ’blazar box’ corresponds to the spectral index range from 0.5 to 0.5. The median values of and are 0.01 (0.52) and 0.44 (0.33), respectively (Fig. 6). Thus, the majority of the radio spectra steepens at higher frequencies.
We found 47 (46 per cent) of quasars had peaked radio spectra (PS) with a turnover in their average spectrum (Table 6). There are 17 sources with classical (de Vries et al., 1997) GPS spectral features and 13 quasars with a peak at MHz frequencies (MPS). We present 24 new GPS and MPS candidates in Table 6.
A large part of the sample (24 per cent) has flat spectra and 15 per cent has steep ones. A small number of the sources have complex, upturn, and inverted spectra.
We have not found ultra-steep radio spectra. The spectrum of PKS 2313-330 has an ultra-steep part with and is classified as PS. The spectral index was determined based on the multi-epoch RATAN observations in 2015–2020 at four frequencies simultaneously. For the second quasar, 87GB 012817.1+434250, we found an ultra-steep spectral part at low frequencies with . This object is classified as having a complex spectrum. Its ultra-steep spectral part was obtained from two non-simultaneous measurements (NVSS and RATAN) on a time-scale of 20 years.
For nine quasars, the radio spectra are well described by a sum of two spectral components at low (LFC) and high (HFC) frequencies (Kovalev et al., 2002; Kovalev et al., 2020), which are denoted by ’*’ in Table LABEL:tab:param. LFC indicates an optically thin synchrotron emission of extended kpc-scale structures with a peak frequency much less than 1 GHz due to its characteristic size (Slish, 1963). HFC dominates at frequencies of several GHz and more and is associated with the pc-scale jet.
| Type | Criteria | N | % |
|---|---|---|---|
| Peaked | , | 47 | 46 |
| Flat | 25 | 24 | |
| Inverted | 8 | 8 | |
| Upturn | , | 2 | 2 |
| Steep | 15 | 15 | |
| Ultra-steep | 0 | 0 | |
| Complex | Two or more maxima/minima | 5 | 5 |
4.3 The average spectrum
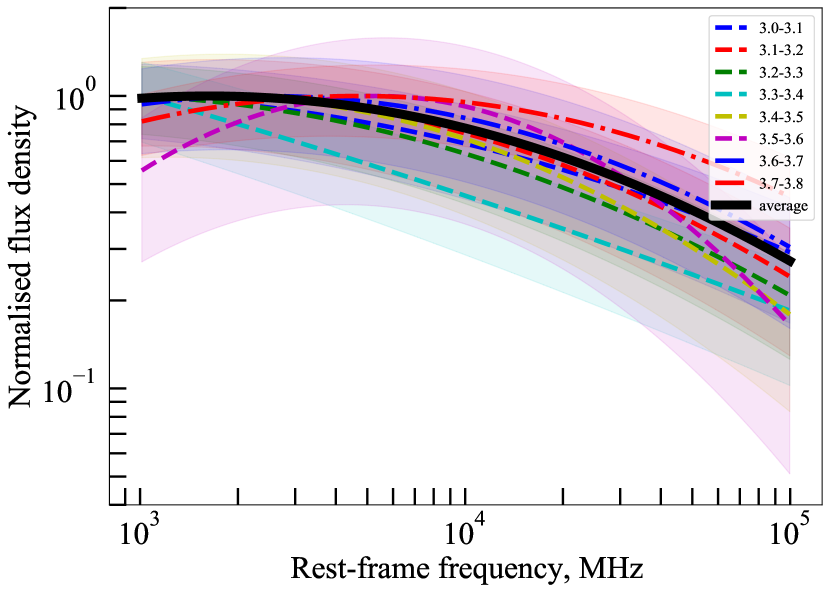
To study the distant radio sources population, we used continuum radio spectra averaged over the objects located within close redshift intervals . The spectrum of each object was preliminarily recalculated into the rest frame using the correction. The spectra of individual objects were then approximated by a polynomial of the first or second degree. Finally, the average spectrum of all objects in each bin was calculated using the formula (Verkhodanov et al., 2018)
| (1) |
where is the set of frequencies in the approximating data set for the the source, is the flux density calculated for the th source approximation at a frequency , and is the number of sources. The averaging procedure was carried out using the utility of the FADPS data processing system. As a result, we have calculated eight average spectra in the range –3.8. The mean error of the averaged spectrum in each redshift bin is determined by the quadratic sum of spectrum approximation uncertainties. The uncertainty of the spectrum approximation of an individual object was calculated using errors of polynomial fitting coefficients by a standard method. At higher redshift intervals, there are only a few objects, and the averaging procedure was not applied.
Fig. 7 presents the normalised average radio spectra for the redshift bins . The cumulative radio spectrum is shown by the black line. A 99 per cent confidence intervals (3) are shown as strips with different colors.
The eight average spectra in the redshifts range 3.0–3.8 show a similar shape within their uncertainties. The values of low and high spectral indices for the cumulative radio spectrum are =0.2003 and =-0.400.02, respectively. The peak frequency for the average spectrum is about 1.6 GHz in the rest frame.
4.4 – correlation
We have not found any significant correlation between redshifts and spectral indices at low and high frequencies (Fig. 8). The Pearson correlation coefficient is for and for , with 46 and 95 per cent of probability that these weak correlations appear by chance and not weighty, although this dependence was reported for radio sources in several studies (e.g. Blumenthal & Miley 1979; Laing & Peacock 1980; De Breuck et al. 2000). The result does not contradict the existing theories, explaining – correlation by the interaction of the radio lobes with the dense intergalactic medium at –3. Our sample contains distant () and very compact radio sources, mostly with peaked radio spectra, for which the core emission dominates at the GHz frequencies and the influence of radio lobes is negligible (Ker et al., 2012).
4.5 Radio luminosity
We used the CDM cosmology with km s-1 Mpc-1, =0.3089, and =0.6911 (Planck Collaboration, 2016) to estimate the radio luminosity at 4.7 GHz:
| (2) |
where is the frequency, the measured flux density, the redshift, the spectral index calculated at 4.7 GHz by linear approximation of the spectrum between 1 and 8 GHz, and the luminosity distance.
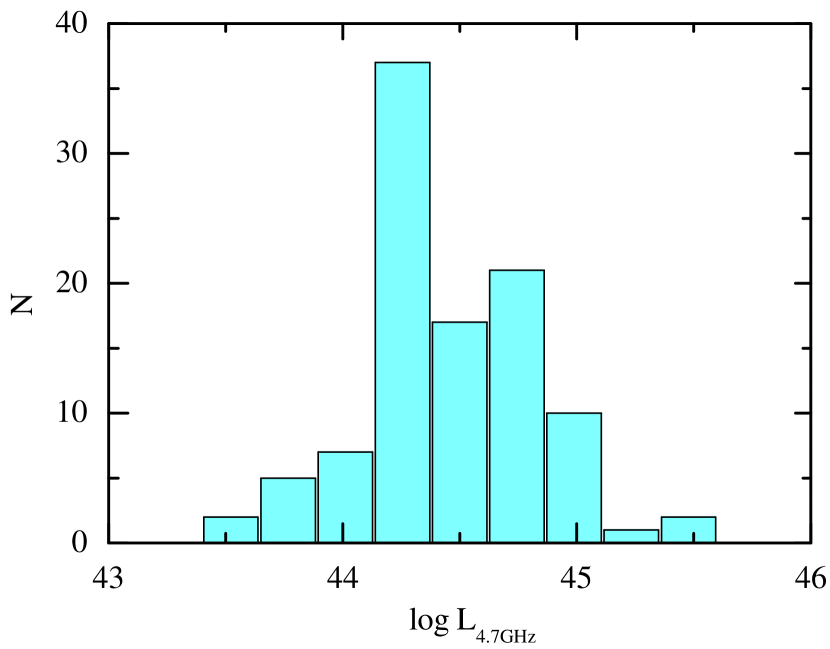
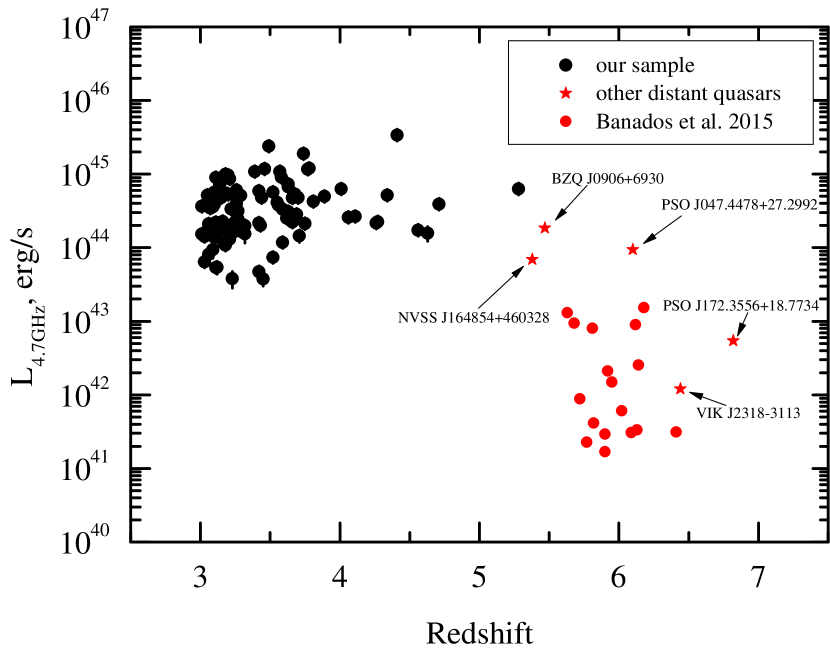
The median value of the radio luminosity for our sample is erg s-1, and the source J05253343 at has the highest luminosity of erg s-1. Figs 9 and 10 show the luminosity distribution and the redshift versus luminosity plot, respectively.
In Fig. 10 we compare the luminosities of our sample with the luminosities calculated for the 17 distant quasars at selected from the FIRST and Pan-STARRS1 surveys cross-match in Bañados et al. (2015). Also, we draw in the figure five individual sources: BZQ J0906+6930 at , PSO J047.4478+27.2992 at and NVSS J164854+460328 at (Mufakharov et al., 2021), VIK J2318-3113 at (Ighina et al., 2021), and PSO J172.3556+18.7734 at (Bañados et al., 2021). The sample of Bañados et al. (2015) consists of the sources with the 1.4 GHz flux densities in the range 0.035–3.04 mJy, and accordingly their luminosity values are two orders of magnitude lower compared to the values in our sample.
4.6 Radio loudness
The radio loudness is defined as
| (3) |
where is the estimated radio flux density at 4.7 GHz and is the optical flux density corresponding to the filter or .
Optical data were taken from the SIMBAD database,444https://simbad.u-strasbg.fr/simbad/ where or magnitudes are presented for 71 of 102 objects. The magnitudes were transformed into flux densities using the Pogson law. We adopted Jy for = 0,555https://www.sdss.org/dr12/algorithms/fluxcal/#SDSStoAB, Jy for (Bessell, 1979), and the optical spectral index (Ganci et al., 2019).
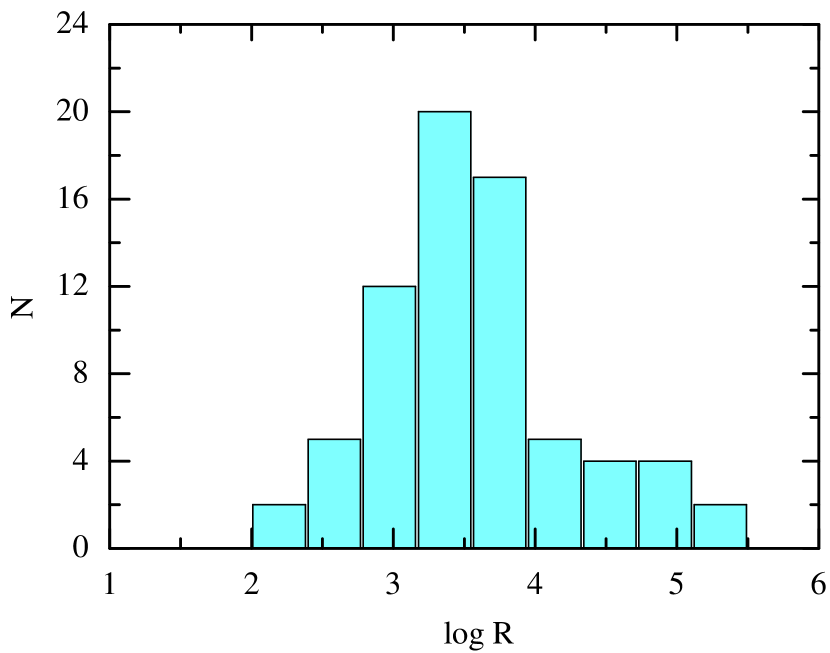
Fig. 11 presents the radio loudness distribution. The value spans from 2.1 to 5.43, the median is 3.5, and the majority of the sources are highly radio loud with (Zhu et al., 2019). Only 5 of 71 quasars have .
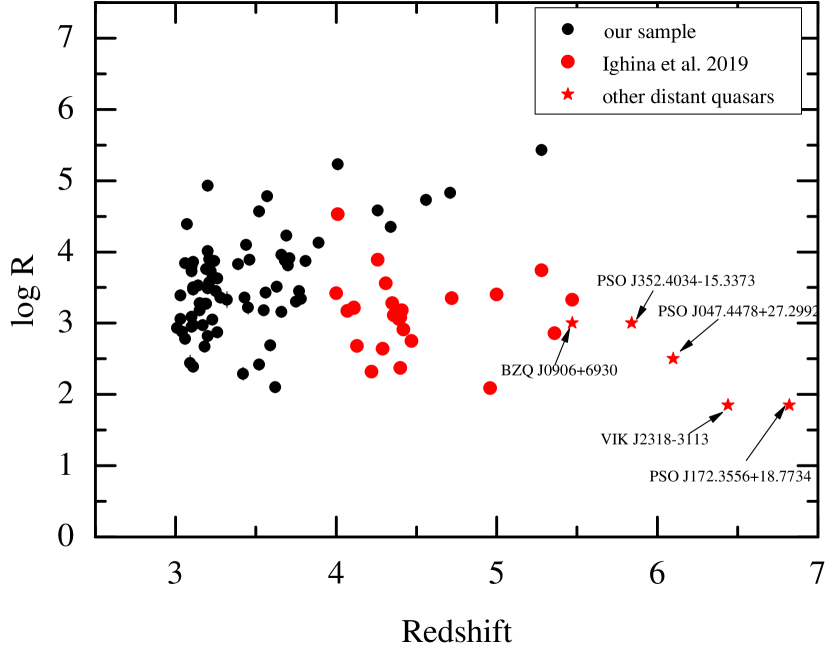
In Fig. 12 we draw 24 radio-loud blazars at selected from the Cosmic Lens All Sky Survey (CLASS: Ighina et al. 2019) as well as five individual sources - BZQ J0906+6930 at (Romani et al., 2004), PSO J352.4034-15.3373 at (Bañados et al., 2018), PSO J047.4478+27.2992 at (Belladitta et al., 2020), VIK J2318-3113 at (Ighina et al., 2021), and PSO J172.3556+18.7734 at (Bañados et al., 2021), - to compare with our results. The sample of Ighina et al. (2019) was selected with a lower limit of 30 mJy at 1.4 GHz, therefore it contains fainter radio sources with lower radio-loudness values than our sample, which is reflected in Fig. 12. We also discuss selection effects in the following section.
5 Discussion
We have classified 46 per cent spectra of quasars as PS type, which is quite a large fraction of bright distant quasars. Thus, we confirm the earlier result of O’Dea et al. (1990) who revealed that seven of the 14 quasars studied at are GPS. Also, O’Dea (1998) expects about 40 per cent of all bright radio sources to be PS type (GPS and CSS).
If a PS source has a peak between 0.5 and 10 GHz, then it is classified as GPS; however, if the spectrum has a peak around 1 GHz, the spectral indices of the optically thin and thick parts are about 0.51 and 0.73, and the source is non-variable, then it is classified more precisely as a classical or canonical GPS (de Vries et al., 1997). In our sample, 17 sources (17 per cent) fit the criteria of classical GPS. 12 of them are already known as GPS or MPS in de Vries et al. (1997), O’Dea (1998), and Callingham et al. (2017). For the other five, further study of their variability (Sotnikova 2021, in preparation) will help classify them more precisely. The variability is a crucial parameter when distinguishing between PS quasars and classical GPS (O’Dea & Saikia, 2020).
Several studies (Torniainen et al., 2005; Mingaliev et al., 2012; Mingaliev et al., 2013; Sotnikova et al., 2019a) have shown that only 2–3 per cent of PS objects are classical GPS, whereas other GPS sources could be, in fact, the blazars that temporarily have broader peaked spectra during their flares (Planck Collaboration et al., 2011). 50 per cent of PS objects in the sample (24 of 47) are FSRQs .
We compared the spectra of GPS quasars in the samples from Mingaliev et al. (2012); Mingaliev et al. (2013) and Sotnikova et al. (2019a). There is no difference between averaged optically thick and thin spectral indices within the measurement uncertainties (Table 4). This can mean that the high redshift GPS have, on average, the same spectral indices as the low- and medium-redshift GPS, and there is no evidence for the evolution of the radio spectrum.
Among 47 PS objects, we determined that 13 (13 per cent) MPSs in the sample that are the sources with a peak below 1 GHz in the observer’s frame. They are also interesting as young compact (5–10 mas) radio sources (Coppejans et al., 2015; Coppejans et al., 2016a; Callingham et al., 2017), possibly evolved versions of GPS sources (Kunert-Bajraszewska et al., 2010). On the whole, MPS sources are a combination of PS sources, the peak frequency of which have been shifted to low frequencies due to cosmological redshift (O’Dea & Saikia, 2021). Two of our 13 MPSs had already been identified as MPSs in Callingham et al. (2017). We note that 15 objects of the sample with the steep spectrum could also be MPS candidates, and additional low-frequency (1 GHz) data are needed to obtain their radio spectra at megahertz frequencies and define a possible peak.
Whitfield (1957), Blumenthal & Miley (1979), Tielens et al. (1979), Laing & Peacock (1980), De Breuck et al. (2000), Jarvis et al. (2001), Verkhodanov & Khabibullina (2010), and Singh et al. (2014) reported a correlation between the observed spectral index and redshift and also proposed to use the presence of an ultra-steep spectral index as a method for selecting high-redshift radio sources. However, this correlation was detected mostly for radio galaxies, while more and more distant quasars with flat radio spectra have been revealed later. The steeper spectra for distant quasars could be explained by selection effects and higher inverse Compton losses due to the increased photon energy density of the cosmic microwave background (Morabito & Harwood, 2018). We have no quasars with the ultra-steep spectrum in the sample.
The number of objects in our sample decreases with increasing redshift, whereas the radio loudness increases. This means that our initial criterion of mJy selects only the most radio-loud quasars at high redshifts. There are other radio-loud quasars underrepresented in our study because of their low radio flux density at GHz. The quasar radio-loud fraction was investigated in several studies, and it was shown that it remains about 10 per cent in optically selected quasar samples up to redshift (Kellermann et al., 1989; Stern et al., 2000; Liu et al., 2021). When higher redshifts are considered, the lower-frequency observations are needed to detect the radio emission because of the steep spectrum at MHz–GHz frequencies. We think that the artificial trend we obtained in the – plane will be eliminated if the selection criterion is changed toward a lower flux density limit at 1.4 GHz, or if a lower frequency survey is applied to the high-redshift sample construction.
| N | Reference | |||
|---|---|---|---|---|
| 0.14–4.56 | 45 | 0.7 (0.1) | 0.7 (0.1) | Mingaliev et al. (2012) |
| 0–5 | 43 | 0.9 (0.1) | 0.6 (0.1) | Mingaliev et al. (2013) |
| Jy | ||||
| 0–5 | 71 | 0.7 (0.2) | 0.7 (0.2) | Sotnikova et al. (2019a) |
| Jy | ||||
| 3–5 | 12 | 0.7 (0.2) | 0.7 (0.3) | This study |
| Jy |
6 Summary
We present the results of multifrequency RATAN observations in 2017–2020 of a complete sample of bright quasars at . The flux densities were measured at frequencies of 1.1, 2.3, 4.7, 8.2, 11.2, and 22 GHz quasi-simultaneously with uncertainties of 9–31 per cent. The detection rate is 100, 89, and 46 per cent at 4.7, 11.2, and 22 GHz, respectively. The main conclusions are the following:
-
1.
The sample has peaked and flat radio spectra (46 per cent and 24 per cent, respectively). There are 15 per cent quasars with a steep spectrum (), indicating the dominance of bright compact core emission and insignificant contribution of extended optically thin kpc-scale components in observed radio spectra. There are no quasars with ultra-steep radio spectra () in the sample. We have not found any significant correlation between the redshifts and spectral indices.
-
2.
Eight new MPSs (J02140157, J02322317, J05253343, J06243856, J09050410, J10453142, J14184250, J20191127) and 16 new GPS (Table 6) candidates are suggested. Further study of their variability and additional low-frequency observations are needed to classify them precisely.
-
3.
The radio luminosity has been calculated with a median value of erg s-1 for the sample.
-
4.
Using new radio data, we have estimated the radio loudness for 71 objects with a mean value of 3.5. The values span from 2.1 to 5.43. The majority of the quasars are highly radio-loud with , and only five quasars have .
We are preparing a follow-up work with a further study of the sample, including assessing the variability and notes on individual objects (Sotnikova, in preparation).
Acknowledgements
We thank the referee for providing useful suggestions and comments that significantly improved the article. This work was supported in the framework of the national project “Science” by the Ministry of Science and Higher Education of the Russian Federation under the contract 075-15-2020-778. The observations were carried out with the RATAN-600 scientific facility. This research has made use of the CATS database, operated at SAO RAS, Russia. The research has made use of the NASA/IPAC Extragalactic Database (NED), which is operated by the Jet Propulsion Laboratory, California Institute of Technology, under contract with the National Aeronautics and Space Administration. We used of the SIMBAD database, operated at CDS, Strasbourg, France.
Data Availability
The data underlying this article are available in the article and in its online supplementary material. The measured flux densities are distributed in the VizieR Information System and partly published in the BL Lac database available at the Special Astrophysical Observatory website.
References
- Bañados et al. (2015) Bañados E., et al., 2015, ApJ, 804, 118
- Bañados et al. (2018) Bañados E., Carilli C., Walter F., Momjian E., Decarli R., Farina E. P., Mazzucchelli C., Venemans B. P., 2018, ApJ, 861, L14
- Bañados et al. (2021) Bañados E., et al., 2021, ApJ, 909, 80
- Baars et al. (1977) Baars J. W. M., Genzel R., Pauliny-Toth I. I. K., Witzel A., 1977, A&A, 61, 99
- Ballet et al. (2020) Ballet J., Burnett T. H., Digel S. W., Lott B., 2020, arXiv e-prints, p. arXiv:2005.11208
- Becker et al. (1994) Becker R. H., White R. L., Helfand D. J., 1994, in Crabtree D. R., Hanisch R. J., Barnes J., eds, Astronomical Society of the Pacific Conference Series Vol. 61, Astronomical Data Analysis Software and Systems III. p. 165
- Belladitta et al. (2020) Belladitta S., et al., 2020, A&A, 635, L7
- Bessell (1979) Bessell M. S., 1979, PASP, 91, 589
- Blumenthal & Miley (1979) Blumenthal G., Miley G., 1979, A&A, 80, 13
- Caccianiga et al. (2019) Caccianiga A., et al., 2019, MNRAS, 484, 204
- Callingham et al. (2017) Callingham J. R., et al., 2017, ApJ, 836, 174
- Condon et al. (1998) Condon J. J., Cotton W. D., Greisen E. W., Yin Q. F., Perley R. A., Taylor G. B., Broderick J. J., 1998, AJ, 115, 1693
- Coppejans et al. (2015) Coppejans R., Cseh D., Williams W. L., van Velzen S., Falcke H., 2015, MNRAS, 450, 1477
- Coppejans et al. (2016a) Coppejans R., et al., 2016a, MNRAS, 459, 2455
- Coppejans et al. (2016b) Coppejans R., et al., 2016b, MNRAS, 463, 3260
- Coppejans et al. (2017) Coppejans R., et al., 2017, MNRAS, 467, 2039
- De Breuck et al. (2000) De Breuck C., van Breugel W., Röttgering H. J. A., Miley G., 2000, A&AS, 143, 303
- Frey et al. (2008) Frey S., Gurvits L. I., Paragi Z., É. Gabányi K., 2008, A&A, 484, L39
- Frey et al. (2010) Frey S., Paragi Z., Gurvits L. I., Cseh D., Gabányi K. É., 2010, A&A, 524, A83
- Frey et al. (2015) Frey S., Paragi Z., Fogasy J. O., Gurvits L. I., 2015, MNRAS, 446, 2921
- Ganci et al. (2019) Ganci V., Marziani P., D’Onofrio M., del Olmo A., Bon E., Bon N., Negrete C. A., 2019, A&A, 630, A110
- Ghisellini et al. (2014) Ghisellini G., Sbarrato T., Tagliaferri G., Foschini L., Tavecchio F., Ghirlanda G., Braito V., Gehrels N., 2014, MNRAS, 440, L111
- Gregory et al. (1996) Gregory P. C., Scott W. K., Douglas K., Condon J. J., 1996, ApJS, 103, 427
- Hurley-Walker et al. (2017) Hurley-Walker N., et al., 2017, MNRAS, 464, 1146
- Ighina et al. (2019) Ighina L., Caccianiga A., Moretti A., Belladitta S., Della Ceca R., Ballo L., Dallacasa D., 2019, MNRAS, 489, 2732
- Ighina et al. (2021) Ighina L., Belladitta S., Caccianiga A., Broderick J. W., Drouart G., Moretti A., Seymour N., 2021, arXiv e-prints, p. arXiv:2101.11371
- Intema et al. (2017) Intema H. T., Jagannathan P., Mooley K. P., Frail D. A., 2017, A&A, 598, A78
- Jarvis et al. (2001) Jarvis M. J., et al., 2001, MNRAS, 326, 1563
- Kellermann et al. (1989) Kellermann K. I., Sramek R., Schmidt M., Shaffer D. B., Green R., 1989, AJ, 98, 1195
- Ker et al. (2012) Ker L. M., Best P. N., Rigby E. E., Röttgering H. J. A., Gendre M. A., 2012, MNRAS, 420, 2644
- Kovalev et al. (2002) Kovalev Y. Y., Kovalev Y. A., Nizhelsky N. A., Bogdantsov A. B., 2002, Publications of the Astronomical Society of Australia, 19, 83
- Kovalev et al. (2020) Kovalev Y. A., et al., 2020, Advances in Space Research, 65, 745
- Kunert-Bajraszewska et al. (2010) Kunert-Bajraszewska M., Gawroński M. P., Labiano A., Siemiginowska A., 2010, MNRAS, 408, 2261
- Laing & Peacock (1980) Laing R. A., Peacock J. A., 1980, MNRAS, 190, 903
- Liu et al. (2021) Liu Y., et al., 2021, ApJ, 908, 124
- Marecki et al. (1999) Marecki A., Falcke H., Niezgoda J., Garrington S. T., Patnaik A. R., 1999, A&AS, 135, 273
- Massaro et al. (2015) Massaro E., Maselli A., Leto C., Marchegiani P., Perri M., Giommi P., Piranomonte S., 2015, Ap&SS, 357, 75
- Mingaliev et al. (2001) Mingaliev M. G., Stolyarov V. A., Davies R. D., Melhuish S. J., Bursov N. A., Zhekanis G. V., 2001, A&A, 370, 78
- Mingaliev et al. (2012) Mingaliev M. G., Sotnikova Y. V., Torniainen I., Tornikoski M., Udovitskiy R. Y., 2012, A&A, 544, A25
- Mingaliev et al. (2013) Mingaliev M. G., Sotnikova Y. V., Mufakharov T. V., Erkenov A. K., Udovitskiy R. Y., 2013, Astrophysical Bulletin, 68, 262
- Mingaliev et al. (2014) Mingaliev M. G., Sotnikova Y. V., Udovitskiy R. Y., Mufakharov T. V., Nieppola E., Erkenov A. K., 2014, A&A, 572, A59
- Momjian et al. (2008) Momjian E., Carilli C. L., McGreer I. D., 2008, AJ, 136, 344
- Momjian et al. (2014) Momjian E., Carilli C. L., Walter F., Venemans B., 2014, AJ, 147, 6
- Morabito & Harwood (2018) Morabito L. K., Harwood J. J., 2018, MNRAS, 480, 2726
- Mufakharov et al. (2021) Mufakharov T., Mikhailov A., Sotnikova Y., Mingaliev M., Stolyarov V., Erkenov A., Nizhelskij N., Tsybulev P., 2021, MNRAS, 503, 4662
- Murphy et al. (2010) Murphy T., et al., 2010, MNRAS, 402, 2403
- O’Dea (1990) O’Dea C. P., 1990, MNRAS, 245, 20
- O’Dea (1998) O’Dea C. P., 1998, PASP, 110, 493
- O’Dea & Saikia (2020) O’Dea C. P., Saikia D. J., 2020, arXiv e-prints, p. arXiv:2009.02750
- O’Dea & Saikia (2021) O’Dea C. P., Saikia D. J., 2021, A&ARv, 29, 3
- O’Dea et al. (1990) O’Dea C. P., Baum S. A., Stanghellini C., Morris G. B., Patnaik A. R., Gopal-Krishna 1990, A&AS, 84, 549
- O’Dea et al. (1991) O’Dea C. P., Baum S. A., Stanghellini C., 1991, ApJ, 380, 66
- Ott et al. (1994) Ott M., Witzel A., Quirrenbach A., Krichbaum T. P., Standke K. J., Schalinski C. J., Hummel C. A., 1994, A&A, 284, 331
- Parijskij (1993) Parijskij Y. N., 1993, IEEE Antennas and Propagation Magazine, 35, 7
- Perley & Butler (2013) Perley R. A., Butler B. J., 2013, ApJS, 204, 19
- Perley & Butler (2017) Perley R. A., Butler B. J., 2017, ApJS, 230, 7
- Planck Collaboration (2016) Planck Collaboration 2016, A&A, 594, A13
- Planck Collaboration et al. (2011) Planck Collaboration et al., 2011, A&A, 536, A14
- Rengelink et al. (1997) Rengelink R. B., Tang Y., de Bruyn A. G., Miley G. K., Bremer M. N., Roettgering H. J. A., Bremer M. A. R., 1997, A&AS, 124, 259
- Romani et al. (2004) Romani R. W., Sowards-Emmerd D., Greenhill L., Michelson P., 2004, ApJ, 610, L9
- Sbarrato et al. (2012) Sbarrato T., et al., 2012, MNRAS, 426, L91
- Sbarrato et al. (2013) Sbarrato T., Ghisellini G., Nardini M., Tagliaferri G., Greiner J., Rau A., Schady P., 2013, MNRAS, 433, 2182
- Singh et al. (2014) Singh V., et al., 2014, A&A, 569, A52
- Slish (1963) Slish V. I., 1963, Nature, 199, 682
- Smolčić et al. (2014) Smolčić V., et al., 2014, MNRAS, 443, 2590
- Sotnikova (2020) Sotnikova Y. V., 2020, in Romanyuk I. I., Yakunin I. A., Valeev A. F., Kudryavtsev D. O., eds, Ground-Based Astronomy in Russia. 21st Century. pp 32–40, doi:10.26119/978-5-6045062-0-2˙2020˙32
- Sotnikova et al. (2019a) Sotnikova Y. V., Mufakharov T. V., Majorova E. K., Mingaliev M. G., Udovitskii R. Y., Bursov N. N., Semenova T. A., 2019a, Astrophysical Bulletin, 74, 348
- Sotnikova et al. (2019b) Sotnikova Y. V., Kovalev Y. A., Erkenov A. K., 2019b, Astrophysical Bulletin, 74, 497
- Spingola et al. (2020) Spingola C., Dallacasa D., Belladitta S., Caccianiga A., Giroletti M., Moretti A., Orienti M., 2020, A&A, 643, L12
- Stern et al. (2000) Stern D., Djorgovski S. G., Perley R. A., de Carvalho R. R., Wall J. V., 2000, AJ, 119, 1526
- Tabara & Inoue (1980) Tabara H., Inoue M., 1980, A&AS, 39, 379
- Tielens et al. (1979) Tielens A. G. G. M., Miley G. K., Willis A. G., 1979, A&AS, 35, 153
- Torniainen et al. (2005) Torniainen I., Tornikoski M., Teräsranta H., Aller M. F., Aller H. D., 2005, A&A, 435, 839
- Tsybulev (2011) Tsybulev P. G., 2011, Astrophysical Bulletin, 66, 109
- Tsybulev et al. (2018) Tsybulev P. G., Nizhelskii N. A., Dugin M. V., Borisov A. N., Kratov D. V., Udovitskii R. Y., 2018, Astrophysical Bulletin, 73, 494
- Udovitskiy et al. (2016) Udovitskiy R. Y., Sotnikova Y. V., Mingaliev M. G., Tsybulev P. G., Zhekanis G. V., Nizhelskij N. A., 2016, Astrophysical Bulletin, 71, 496
- Urry & Padovani (1995) Urry C. M., Padovani P., 1995, PASP, 107, 803
- Verkhodanov (1997) Verkhodanov O. V., 1997, Astronomical Data Analysis Software and Systems VI, A.S.P. Conference Series, 125, 46
- Verkhodanov & Khabibullina (2010) Verkhodanov O. V., Khabibullina M. L., 2010, Astronomy Letters, 36, 7
- Verkhodanov et al. (1997) Verkhodanov O. V., Trushkin S. A., Chernenkov V. N., 1997, Baltic Astronomy, 6, 275
- Verkhodanov et al. (2005) Verkhodanov O. V., Trushkin S. A., Andernach H., Chernenkov V. N., 2005, Bulletin of the Special Astrophysics Observatory, 58, 118
- Verkhodanov et al. (2018) Verkhodanov O. V., Kozlova D. D., Sotnikova Y. V., 2018, Astrophysical Bulletin, 73, 393
- Wang et al. (2007) Wang R., et al., 2007, AJ, 134, 617
- Whitfield (1957) Whitfield G. R., 1957, MNRAS, 117, 680
- Zhu et al. (2019) Zhu S. F., Brandt W. N., Wu J., Garmire G. P., Miller B. P., 2019, MNRAS, 482, 2016
- de Vries et al. (1997) de Vries W. H., Barthel P. D., O’Dea C. P., 1997, A&A, 321, 105
| NVSS name | , | , | Sp. type | Blazar type | ||||
|---|---|---|---|---|---|---|---|---|
| (Jy) | (erg s-1) | |||||||
| 1 | 2 | 3 | 4 | 5 | 6 | 7 | 8 | 9 |
| 000108191434 | 3.10 | upturn | FSRQ | |||||
| 000657141546 | 3.20 | peaked | ||||||
| 004858064005 | 3.58 | peaked | ||||||
| 010012270852 | 3.52 | peaked | ||||||
| 012100280622 | 3.11 | peaked | FSRQ | |||||
| 013113435813 | 3.12 | complex | ||||||
| 014844421519 | 3.24 | upturn | FSRQ | |||||
| 015106251729 | 3.10 | flat | ||||||
| 020346113445 | 3.63 | peaked∗ | FSRQ | |||||
| 021435015703 | 3.28 | peaked | ||||||
| 023220231757 | 3.42 | peaked∗ | ||||||
| 024611182330 | 3.59 | peaked | FSRQ | |||||
| 025759433838 | 4.06 | inverted | ||||||
| 032444291821 | 4.63 | inverted | FSRQ | |||||
| 033755120404 | 3.44 | flat | FSRQ | |||||
| 033900013318 | 3.19 | flat | FSRQ | |||||
| 035424044107 | 3.26 | complex | ||||||
| 042457080517 | 3.09 | inverted | FSRQ | |||||
| 042835173223 | 3.32 | flat | FSRQ | |||||
| 052506233810 | 3.1 | inverted | bl.un. | |||||
| 052506334305 | 4.41 | peaked | FSRQ | |||||
| 053954283955 | 3.10 | peaked∗ | FSRQ | |||||
| 062419385648 | 3.46 | peaked | FSRQ | |||||
| 064632445116 | 3.39 | peaked | FSRQ | |||||
| 073357045614 | 3.01 | peaked | FSRQ | |||||
| 075141271632 | 3.20 | peaked | ||||||
| 075303423131 | 3.59 | peaked | ||||||
| 083322095941 | 3.75 | flat | ||||||
| 083910200207 | 3.03 | peaked | ||||||
| 084715383110 | 3.18 | inverted | ||||||
| 090549041010 | 3.15 | peaked | ||||||
| 090915035443 | 3.20 | flat | ||||||
| 091551000712 | 3.07 | flat | FSRQ | |||||
| 093337284532 | 3.42 | peaked | ||||||
| 094113114532 | 3.19 | flat | ||||||
| 101644203747 | 3.11 | complex | FSRQ | |||||
| 102010104003 | 3.15 | steep | ||||||
| 102107220922 | 4.26 | flat | ||||||
| 102623254259 | 5.28 | peaked | FSRQ | |||||
| 102645365826 | 3.25 | flat | ||||||
| 102838084438 | 4.27 | flat | FSRQ | |||||
| 103626132652 | 3.09 | steep | ||||||
| 104523314232 | 3.23 | peaked | ||||||
| 110147001039 | 3.69 | steep | ||||||
| 112500333858 | 3.43 | steep | ||||||
| 112851232617 | 3.04 | flat | ||||||
| 115016433205 | 3.03 | inverted | FSRQ | |||||
| 123055113909 | 3.52 | peaked | FSRQ | |||||
| 124209372006 | 3.81 | peaked∗ | ||||||
| 130122190353 | 3.10 | peaked | ||||||
| 134022375443 | 3.11 | peaked | ||||||
| 135406020603 | 3.70 | peaked | FSRQ | |||||
| 135646110130 | 3.01 | inverted | FSRQ | |||||
| 135652291817 | 3.24 | steep | ||||||
| 135706174402 | 3.14 | peaked∗ | FSRQ | |||||
| 140135151326 | 3.23 | peaked | ||||||
| 140501041535 | 3.20 | peaked∗ | FSRQ | |||||
| 141152430024 | 3.21 | flat | ||||||
| 141300394745 | 3.71 | flat | ||||||
| 141318450522 | 3.11 | inverted | FSRQ | |||||
| 141821425020 | 3.45 | peaked | ||||||
| 142107064356 | 3.68 | complex | FSRQ | |||||
| 142438225600 | 3.62 | peaked | FSRQ | |||||
| 143023420436 | 4.71 | flat | FSRQ | |||||
| 144516095836 | 3.55 | peaked | FSRQ | |||||
| 145722051922 | 3.17 | flat | ||||||
| 145805085529 | 3.06 | steep | ||||||
| 145927325359 | 3.32 | steep | ||||||
| 150328041949 | 3.66 | peaked | ||||||
| 152117175601 | 3.06 | peaked | ||||||
| 152219211957 | 3.22 | steep | ||||||
| 153815001905 | 3.49 | peaked | ||||||
| 155930030447 | 3.89 | peaked | FSRQ | |||||
| 160002041256 | 3.11 | flat | ||||||
| 160608312504 | 4.56 | peaked | ||||||
| 161005181143 | 3.11 | steep | ||||||
| 161637045932 | 3.21 | peaked∗ | FSRQ | |||||
| 163257003321 | 3.42 | flat | FSRQ | |||||
| 165519324241 | 3.18 | steep | ||||||
| 165543194847 | 3.26 | flat | ||||||
| 165844073917 | 3.74 | peaked∗ | FSRQ | |||||
| 171521214532 | 4.01 | steep | ||||||
| 174020350048 | 3.22 | steep | ||||||
| 184057390046 | 3.09 | peaked | FSRQ | |||||
| 193957100241 | 3.78 | complex | FSRQ | |||||
| 200324325144 | 3.77 | peaked | FSRQ | |||||
| 201918112712 | 3.27 | peaked | ||||||
| 204124185502 | 3.05 | steep | ||||||
| 204257222326 | 3.63 | peaked | FSRQ | |||||
| 204310125513 | 3.27 | flat | FSRQ | |||||
| 205051312727 | 3.18 | peaked | FSRQ | |||||
| 212912153840 | 3.26 | peaked∗ | FSRQ | |||||
| 213412041910 | 4.34 | flat | ||||||
| 221748022010 | 3.57 | steep | FSRQ | |||||
| 221935271903 | 3.63 | flat | FSRQ | |||||
| 222536204015 | 3.56 | steep | ||||||
| 224800054118 | 3.29 | peaked | bl.un. | |||||
| 225153221737 | 3.66 | flat | FSRQ | |||||
| 231448020151 | 4.11 | peaked | ||||||
| 231643334912 | 3.1 | peaked | FSRQ | |||||
| 232118082721 | 3.16 | flat | FSRQ | |||||
| 234451343349 | 3.05 | flat | ||||||
| ∗ sources with two components in the radio spectrum | ||||||||
| NVSS name | PS type | Reference | ||||
|---|---|---|---|---|---|---|
| (GHz) | (GHz) | (Jy) | ||||
| 1 | 2 | 3 | 4 | 5 | 6 | 7 |
| 000657141546 | 3.20 | 1.5 | 6.3 | 0.18 | GPS | |
| 004858064005 | 3.58 | 3.9 | 17.6 | 0.22 | GPS | Mingaliev et al. (2013) |
| 010012270852 | 3.52 | 1.4 | 6.3 | 0.22 | GPS | |
| 012100280622 | 3.11 | 0.3 | 1.2 | 0.20 | MPS | Mingaliev et al. (2013) |
| 020346113445 | 3.63 | 3.7 | 17.1 | 1.01 | GPS | O’Dea et al. (1991) |
| 021435015703 | 3.28 | 0.5 | 1.9 | 0.25 | MPS | |
| 023220231757 | 3.42 | 0.5 | 2.2 | 0.69 | MPS | |
| 024611182330 | 3.59 | 1.8 | 8.3 | 0.23 | GPS | |
| 052506334305 | 4.41 | 0.9 | 4.9 | 0.20 | MPS | |
| 053954283955 | 3.10 | 7.0 | 28.7 | 1.08 | GPS | |
| 062419385648 | 3.46 | 0.3 | 1.3 | 1.56 | MPS | |
| 064632445116 | 3.39 | 17.3 | 76.0 | 3.14 | GPS | O’Dea et al. (1991) |
| 073357045614 | 3.10 | 5.8 | 23.3 | 0.46 | GPS | |
| 075141271632 | 3.20 | 0.2 | 0.8 | 1.85 | MPS | Callingham et al. (2017) |
| 075303423131 | 3.59 | 0.9 | 4.1 | 1.01 | MPS | Mingaliev et al. (2013) |
| 083910200207 | 3.30 | 1.8 | 7.7 | 0.14 | GPS | |
| 090549041010 | 3.15 | 0.5 | 2.1 | 0.32 | MPS | |
| 093337284532 | 3.42 | 1.7 | 7.5 | 0.11 | GPS | |
| 102623254259 | 5.28 | 0.3 | 1.9 | 0.46 | MPS | |
| 104523314232 | 3.23 | 0.9 | 3.8 | 0.20 | MPS | |
| 123055113909 | 3.52 | 1.1 | 5.0 | 0.44 | GPS | Mingaliev et al. (2013) |
| 124209372006 | 3.81 | 1.7 | 8.2 | 0.62 | GPS | |
| 130122190353 | 3.10 | 1.7 | 7.0 | 0.13 | GPS | |
| 134022375443 | 3.11 | 2.7 | 11.1 | 0.46 | GPS | Mingaliev et al. (2013) |
| 135406020603 | 3.70 | 2.6 | 12.2 | 0.91 | GPS | O’Dea et al. (1991) |
| 135706174402 | 3.14 | 1.8 | 7.5 | 1.47 | GPS | O’Dea et al. (1991) |
| 140135151326 | 3.23 | 1.3 | 5.5 | 0.11 | GPS | |
| 140501041535 | 3.20 | 8.3 | 34.9 | 0.82 | GPS | |
| 141821425020 | 3.45 | 0.9 | 4.0 | 0.18 | MPS | |
| 142438225600 | 3.62 | 3.3 | 15.2 | 0.64 | GPS | O’Dea et al. (1991) |
| 144516095836 | 3.55 | 1.3 | 5.9 | 3.16 | GPS | O’Dea et al. (1991) |
| 150328041949 | 3.66 | 5.6 | 26.1 | 0.17 | GPS | |
| 152117175601 | 3.60 | 3.5 | 14.2 | 0.20 | GPS | |
| 153815001905 | 3.49 | 2.9 | 13.0 | 0.73 | GPS | Mingaliev et al. (2013) |
| 155930030447 | 3.89 | 4.5 | 22.0 | 0.47 | GPS | Callingham et al. (2017) |
| 160608312504 | 4.56 | 2.5 | 13.9 | 0.92 | GPS | O’Dea et al. (1991) |
| 161637045932 | 3.21 | 4.4 | 18.5 | 0.97 | GPS | O’Dea et al. (1991) |
| 165844073917 | 3.74 | 5.9 | 28.0 | 0.99 | GPS | O’Dea et al. (1991) |
| 184057390046 | 3.90 | 4.5 | 18.4 | 0.24 | GPS | Marecki et al. (1999) |
| 200324325144 | 3.77 | 5.6 | 26.7 | 0.86 | GPS | O’Dea et al. (1991) |
| 201918112712 | 3.27 | 0.5 | 2.1 | 0.27 | MPS | |
| 204257222326 | 3.63 | 3.5 | 16.2 | 0.19 | GPS | |
| 205051312727 | 3.18 | 1.9 | 7.9 | 0.83 | GPS | |
| 212912153840 | 3.26 | 6.8 | 28.9 | 1.44 | GPS | O’Dea et al. (1991) |
| 224800054118 | 3.29 | 0.4 | 1.7 | 0.91 | MPS | Callingham et al. (2017) |
| 231448020151 | 4.11 | 1.7 | 8.7 | 0.12 | GPS | |
| 231643334912 | 3.10 | 3.9 | 16.0 | 0.73 | GPS | Mingaliev et al. (2013) |